01 January 2019
By Maynard Paton
Happy New Year!
I trust you enjoyed the festive break and are now raring to do battle with the market for another twelve months!
This first Blog post of 2019 provides a ‘year in review’ of my current portfolio holdings. I recap how each of the underlying businesses performed during 2018, as well as provide a few remarks about valuation.
As I mentioned this time last year, I find writing such reviews extremely useful — not least because I am encouraged to double-check my investment logic to ensure I am still invested for all the right reasons!
I performed the same exercise on this Blog at the start of 2015, at the start of 2016 and at the start of 2017.
Something I always remind myself at this time of year is that the greatest portfolio upsets I will face during the next twelve months will most likely be caused by the shares I already own rather than by any new shares I will buy.
That experience was certainly the case last year — I did not purchase any fresh holdings during 2018 and most of my existing investments lost some of their value!
During 2018, my overall portfolio fell 6.6% on a bid-price-to-bid-price basis that includes all dividends and dealing costs. This next Blog post outlines that performance in more detail, as well as clarify how my portfolio begins 2019.
I have reviewed each of my holdings below in order of size within my portfolio.
I have accompanied each review with a SharePad chart in order to show how each company has performed over the longer term. The charts display the share price, earnings per share (or in two cases, net asset value per share) and dividend per share.
Of course my calculations, logic, assumptions and charts may have little bearing on the future… so please do your own research!
Contents
- Bioventix
- Tristel
- Mountview Estates
- FW Thorpe
- City of London Investment
- Daejan
- M Winkworth
- Castings
- Mincon
- S & U
- Tasty
- Getech
- Oleeo
- Andrews Sykes
- System1
- Record
- Summary
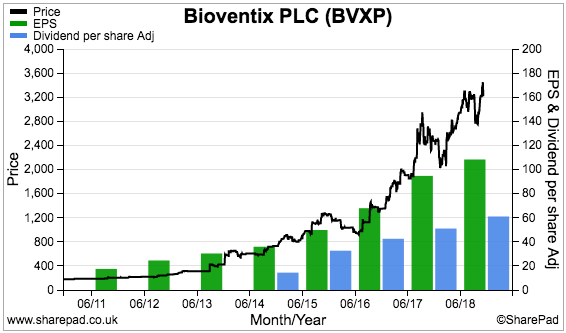
1) Bioventix (BVXP), mid-price: £30.65, market cap: £158m
BVXP became my largest holding during 2018 following a very welcome share-price gain.
Results this year from the antibody specialist were clouded somewhat by the receipt of back-dated royalties and the loss of income from a particular product.
However, my sums pointed to 20% sales growth from established antibodies during both the first half and the full year. Total annual earnings gained 14% and the ordinary dividend was lifted 20%.
The 2018 figures were BVXP’s best ever, and extended the group’s run of substantial annual growth to eight years.
The accounts remain among the classiest in the stock market, not least due to the eye-popping 76% operating margin and immense 126% return on equity.
The cash continues to mount up, too, and shareholders were rewarded during 2018 with a splendid 55p per share special dividend. A one-off payout has now been declared for the last three years.
Last year also saw long-time boss Peter Harrison continue to extol the group’s competitive advantage in a very persuasive manner.
Right now, the main doubts relate to the speed at which sales of a new troponin antibody can appear. Some delays have occurred, but the amiable Mr Harrison remains upbeat.
Anyway, I bought BVXP during 2016 at a fraction above £11, which did not seem an obvious bargain at the time…
…but with trailing earnings (before back-dated royalties) having since zoomed to 97p per share, the price I paid now looks very reasonable.
Throughout 2018, the near-term P/E has often looked rather racy at 30 or more.
However, this business does have exceptional economics… and as I discovered last year, holding on to such firms — even when their immediate valuations appear rich — quite often rewards investors.
I have not bought or sold any BVXP shares following my initial 2016 purchase.
My Bioventix buy report | All my Bioventix posts
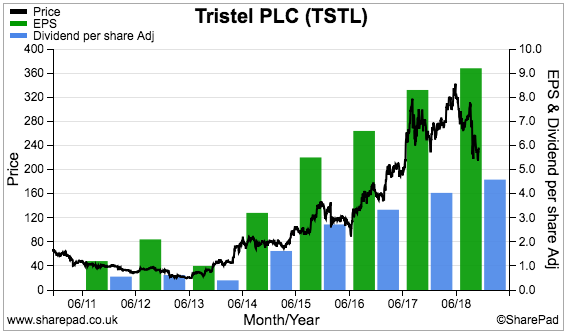
2) Tristel (TSTL), mid-price: 247p, market cap: £109m
I bought TSTL shares during 2013 and 2014 at an average of 46p. I then sold 75% of my holding at various occasions (and for various reasons) during 2014, 2015, 2016 and 2017 at 79p, 100p, 123p and 289p.
Last year was therefore the first time I had left my TSTL investment alone — and persuading me to sit still was the notion that TSTL’s medical disinfectants were continuing to create quite a respectable business.
Indeed, the group’s foams and wipes are used daily within most UK hospitals and should underpin a reliable top line.
Meanwhile, various patents, secret ingredients and scientific testimonies support some welcome financials. TSTL’s 2018 results showed a 20% underlying operating margin and a 29% return on equity.
The same full-year statement revealed revenue up 10%, profit up 14% (albeit before some hefty share-based payments) and the dividend up 14%. All set new records for the fourth consecutive year. Cash generation was first rate, too.
While TSTL’s disinfectants seem top notch, I remain irritated by the group’s board.
Similar to 2017, plans to expand into the US have suffered further delays and the real milestone event — FDA product approval — always seems to glimmer faintly on a very distant horizon.
Last year, a bizarre management decision relating to the FDA application added six months to the timescale.
At least the directors have now bagged the lesser EPA regulatory approval for Stateside sales. In addition, a tie-up with Parker Laboratories lends some credibility to the US project and its longer-term potential.
My sums suggest the shares might be priced at 25x earnings if the FDA regulatory costs are excluded. Although decent progress is presently being achieved in other overseas markets, the valuation does place some hope on a successful US launch.
I will be happy if 2019 witnesses an FDA product submission.
My Tristel buy report | All my Tristel posts
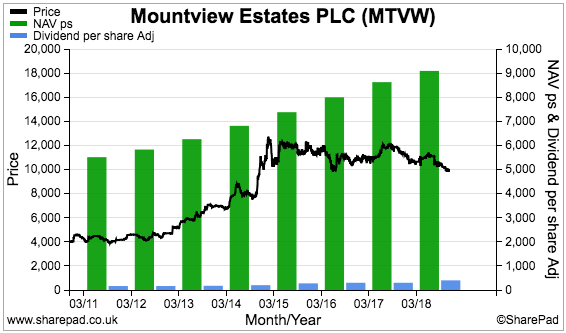
3) Mountview Estates (MTVW), mid-price: £95.25, market cap: £371m
I increased my MTVW holding by 20% during 2018.
I have owned shares in this residential-property operator since 2011 and, after buying initially at £42, acquired more shares at £98. I have never been tempted to sell.
True, MTVW’s results during 2018 were not spectacular.
The firm blamed Brexit for full-year profits sliding 10% and the weakest first-half performance for five years. Bear in mind that 2018’s lacklustre results followed on from the firm’s rather dull 2017 figures.
At least net asset value (NAV) continued to move higher. The balance sheet inched approximately 3% to a new £92 per share high during the twelve months.
In addition, the annual dividend was lifted a welcome 33% — in part to appease some dissident family shareholders.
Management and connected parties continue to control 52% of this business, which is perhaps why the payout has grown at an average of 14% per annum — and has never suffered a cut — since 1988.
For the first time I can recall, last year saw management admit that MTVW had a “finite life”.
You see, the regulated-tenancy properties the business acquires are diminishing in number, and one day supply will run out.
However, that day might be a couple of decades away, and for now at least, MTVW continues to locate “good purchases”.
Gearing on MTVW’s £378m property estate is just 11% — which should provide ample room to increase funding should house prices ever hit bargain levels.
Long term, my valuation sums remain encouraging.
I calculate MTVW’s NAV could be worth £202 per share should all of the group’s properties lose their regulated-tenancy status and are then sold.
For now, a £95 share price compares quite favourably to the £92 per share NAV that is prepared on a historical-cost basis.
Meanwhile, the present 4.2% dividend yield is the highest since the doldrum share-price years of 2008-2013.
My Mountview Estates buy report | All my Mountview Estates posts
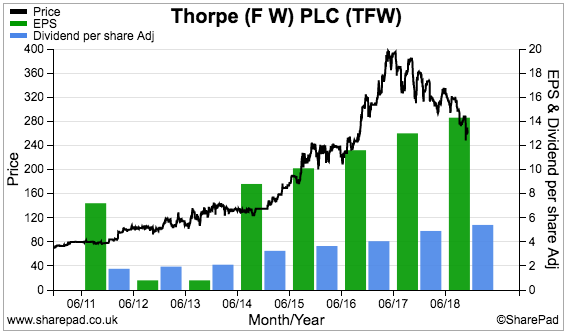
4) FW Thorpe (TFW), mid-price: 255p, market cap: £296m
A year ago, TFW was my largest holding.
However, an elevated P/E combined with an earnings wobble has since knocked the share price… and TFW now finds itself outside my top three.
Funnily enough, the lighting company issued record interim and preliminary results during 2018.
Underlying revenue and profit growth, though, was limited to approximately 2%. At least the annual dividend was hoisted 10% — which extended the run of payout increases to 16 years.
A profit warning issued at the November AGM was perhaps not so surprising.
The directors had been using cautious language all year and operating profit for the current first-half is now likely to drop 10%.
My reading of the situation suggests the setback is due to problems within the construction sector (think Carillion and so on), rather than TFW losing ground to rivals.
Looking back, long-time boss Andrew Thorpe timed his switch to become a part-time executive with perfection. At least Mr Thorpe and his wider family continue to have £150m riding on the share price.
I acquired my TFW shares between 2010 and 2012 at an average of 79p, and sold 25% of my holding during 2016 on valuation worries at 234p.
Even with the recent profit warning, the share price currently exceeds that 234p disposal price — which tells me something about selling decent companies on valuation grounds alone.
And TFW does remain a decent company. The aforementioned dividend history, a £46m net cash/investment hoard alongside an 18% operating margin and 27% return on equity tell me the recent earnings wobble could very likely be a temporary affair.
Such attractive fundamentals probably explain why the shares still trade at about 17 times earnings.
My FW Thorpe buy report | All my FW Thorpe posts
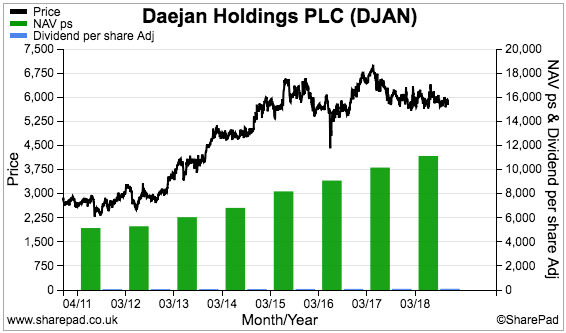
5) Daejan (DJAN), mid-price: £56.15, market cap: £915m
This time last year I said that I “could well buy more” DJAN shares.
Back then the price was £58 while the commercial-property group’s net asset value (NAV) was £103 per share.
Twelve months on, I have increased my holding by 10% after purchasing at £57. During the same time, DJAN’s NAV has advanced to £116 per share. History suggests buying at a 50% discount works out quite well for long-haul shareholders.
I should add that I first bought DJAN shares in 2015 at £55 and again during 2016 at £48. I have never sold any DJAN shares, either.
DJAN continues to grind out reliable progress. July’s annual results showed rental income, NAV and the dividend each increasing between 5% and 7% to set fresh peaks.
The 2018 performance extended DJAN’s very distinguished history. Since the current chairman took charge during 1980, NAV has ballooned 82-fold (+12% average), the dividend has surged 28-fold (+9% average) while rental and other income has rallied 14-fold (+7% average).
I am sure the wonderful track record and the family management’s 80% shareholding are not coincidental.
Although the board has carried on citing Brexit for providing “political and economic uncertainty which has led to reduced forecasts for economic growth”, November’s half-year results did show capex continuing to increase — which suggests property development opportunities still exist.
Debt represents just 11% of the property estate, too, and this ratio currently hovers close to a 10-year low. As such, DJAN seems well placed to pick up any property bargains should the wider sector falter.
In the meantime, the group’s web of subsidiaries contains all sorts of schemes that could deliver NAV gains during the years to come.
In particular, a “large and complex” project on Oxford Street, London, may one day produce notable returns after redevelopment and the launch of Crossrail.
My Daejan buy report | All my Daejan posts
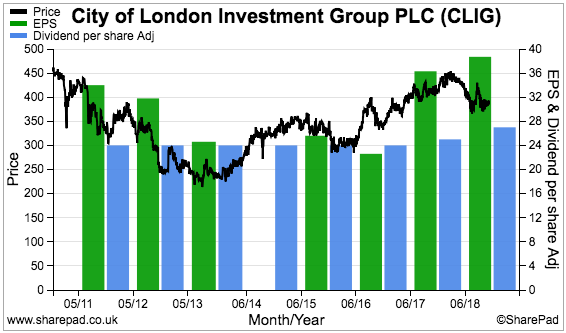
6) City of London Investment (CLIG), mid-price: 380p, market cap: £101m
I appreciated CLIG’s high-yield credentials during last year’s rough market.
The fund manager upped its annual payout by 2p to 27p per share during 2018, and provided me with a useful 6.6% income throughout the twelve months.
The dividend lift reflected CLIG’s positive financial progress.
July’s annual summary revealed funds under management had gained 8% and operating profit had increased 9%. The overall results were the best since 2011.
However, the bulk of the performance was delivered during the first half — weaker markets restrained second-half progress.
CLIG’s accounts remain impressive. The last figures showed margins at a super 37%, return on equity at a splendid 51% and net cash/investments standing at a hefty £20m.
However, the weaker GBP — CLIG earns its fees in USD — has papered over various operational drawbacks.
In particular, CLIG’s funds appear to have lagged their benchmarks for a while now. What’s more, new clients remain very elusive, fee rates continue to be chipped lower and costs keep on climbing.
Note, too, that founder/chief exec/8% shareholder Barry Olliff will retire at the end of this year. His departure has been planned for some time and I am still unsure how CLIG will perform thereafter.
Sliding markets have reduced my latest earnings guess to approximately 31p per share — versus the 40p per share CLIG reported in July. I make the cash-adjusted P/E to be around 10.
I invested at a 281p average between 2011 and 2013, sold 42% of my holding during 2015 at 335p, and have since just sat back and collected the dividends.
I suspect I will just sit back and collect the dividend during 2019 as well.
My City of London Investment buy report | All my City of London Investment posts
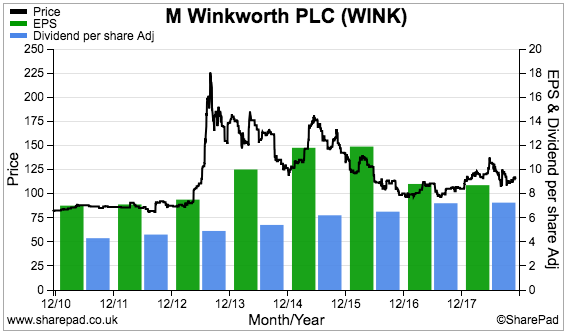
7) M Winkworth (WINK), mid-price: 113p, market cap: £14m
WINK was another high-yield saviour for my portfolio during last year’s rough market.
The estate-agency franchisor lifted its quarterly payouts by 0.05p to 1.85p per share during 2018 to provide me with a welcome 7.4% income.
An added bonus was a 9p per share return of capital, which I trust signals confidence about 2019.
The shareholder handouts contrasted a little with WINK’s financial achievements — the 2017 results announced in March were the weakest for at least four years.
However, September’s interim numbers did show a recovery, with both sales and profit gaining 10%.
Other plus points included WINK’s more dependable lettings income increasing to almost 50% of revenue, and the business continuing to capture market share from London rival Foxtons.
Famous last words, but I am also pleased how online opponent Purplebricks appears to have fallen from grace — at least judging by its precipitous share-price decline.
In fact, I am hopeful the hoo-haa about online agents will soon die down and investors will begin to appreciate WINK’s more sensible approach to estate agency.
In my view, WINK’s 24% operating margin, 49% return on equity and the ability to pay cash out to shareholders — rather than needing shareholders to pay cash in — appear to be a long way off for what WINK’s directors call the sector’s “digital experiments”.
WINK’s management — which owns a fraction over 50% of the business — appeared relatively upbeat about late-2018 trading and I trust that momentum can be sustained.
My sums indicate a P/E of 10-11 adjusted for the firm’s cash and investments. That rating points to potential upside should London’s housing market ever stir into life.
Just so you know, I bought initially at 90p during 2011 and then sold 70% of my holding during 2013 and 2014 at 173p. I then increased my residual investment twelve-fold after purchasing at an average 116p during 2016 and 2017.
My M Winkworth buy report | All my M Winkworth posts
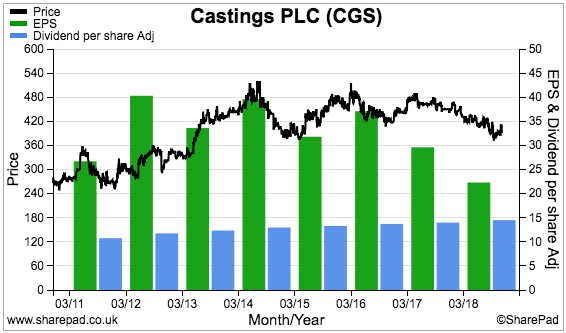
8) Castings (CGS), mid-price: 380p, market cap: £166m
CGS is turning out to be a rather dull investment — and not just because the business makes brake shoes for commercial vehicles.
I bought all my CGS shares during 2015 at 426p and, within less than a year, the engineer owned up to troubles within its smaller machining division.
Those problems sadly remain unsolved — machining profits that once hit £4m now run at £1m-plus losses.
CGS’s 2018 results showed only the dividend making positive progress — the payout gained 4% to a new high. I should add that, since the early 1990s, the payout has been lifted just about every year and has never suffered a cut.
Elsewhere, total annual profit hit its lowest level since 2010. Most of the group’s financial ratios were lacklustre — the operating margin came in at 9% and return on equity (ROE) at 10%.
At least productivity within the main foundry subsidiary improved to give divisional margin and ROE figures of approximately 13%.
CGS’s first-half update in November was not exactly thrilling.
For one thing, the statement contained an accounting re-jig that inflated the interim profit by 10%. A delay to the recovery of the machining division was also admitted.
I even confessed in my H1 write-up that I may sell this holding “should a great opportunity appear elsewhere”.
To date I have not sold any CGS shares, and for now, I continue to hold. The dividend record, an LTIP-free boardroom and a £20m cash hoard are still the foundations of this investment. I am hopeful the cash position can see CGS through the machining difficulties, too.
Needless to say, I am not expecting share-price fireworks for 2019.
I will take earnings flat-lining at approximately 28p per share, which would support a cash-adjusted P/E of 12, and a further pedestrian improvement to the dividend, which would give a yield of close to 4%.
My Castings buy report | All my Castings posts
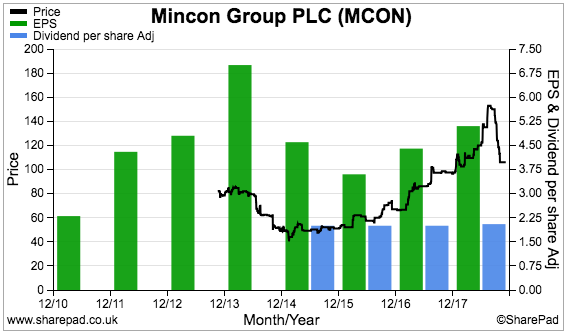
9) Mincon (MCON), mid-price: 108p, market cap: £227m
A positive share-price performance last year promoted MCON to my portfolio mid-pack.
The industrial-drill manufacturer issued buoyant annual figures, with revenue surging 28% and underlying profit soaring 38% following greater orders from the mining sector.
An acquisition then helped support 19% revenue and profit growth within the half-year statement. A repeat of that first-half performance during the second-half should deliver record annual earnings.
Similar to 2017, MCON’s headline progress belied some accounting drawbacks.
In particular, cash conversion still has room for improvement. The business carries lots of stock and customers can take a long time to pay their invoices.
The cash flow statement also includes a questionable ‘Other non-cash movements’ entry — the details of which I have yet to fathom.
Return on equity is not spectacular at 13% as well.
I would like to think MCON’s financials can strengthen over time.
Last year’s revenue boom created “capacity constraints” and unfilled orders, and I get the impression the business has been caught out a little by the sudden popularity of its drills.
Occasional acquisitions and the deliberate discontinuation of third-party equipment sales have also complicated the bookkeeping.
Nonetheless, MCON’s family management — which owns 57% of the business — appear the type that can reward patient investors over time.
Indeed, the board’s aim to build “long term sustainable, defensible market positions” through better engineering should perhaps take precedence over short-term accounting quirks.
Margins reaching 19% suggest the directors are indeed trying to drill out a competitive ‘moat’.
MCON’s last update suggested sales were running 11% higher, and the market appears to be anticipating even further expansion given the trailing P/E of 20. The dividend yield (before Irish withholding tax) is 1.7%.
I bought my MCON shares for 45p during 2015 and have not touched the holding since.
My Mincon buy report | All my Mincon posts
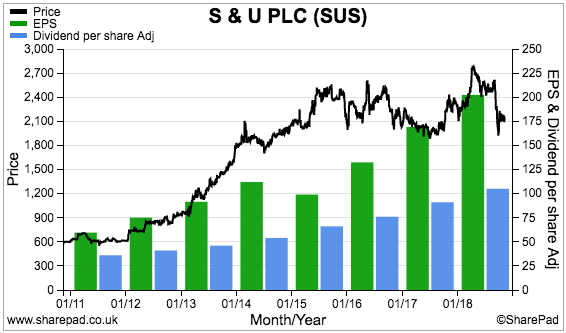
10) S & U (SUS), mid-price: £20.80, market cap: £250m
Worries about potential bad debts kept a lid on my SUS shares during 2018.
The motor-finance lender said its annual loan-loss provision had rocketed by 59%, which distracted from some otherwise very respectable preliminary figures.
For the full year, revenue jumped 32%, operating profit climbed 23% and the dividend was lifted 15%. In fact, the numbers marked the 18th consecutive year of growth — and set new all-time highs — for SUS’s car-loan division.
The same trend was revealed within the subsequent first-half update. Revenue advanced 18%, operating profit improved 22%, the dividend was raised 14%… while the bad-debt provision surged 32%.
A trading update last month then admitted a notable slowing of new customers…
…and left me feeling the 2019 annual results may not show much progress during the second half.
For now, I simply have to trust that SUS’s managers — they have run the business for decades and their family own at least 50% of the shares — can cope with what appears to be a slightly trickier lending environment.
The directors have said the group’s underwriting criteria have been tightened and I am hopeful the amount of potential bad loans can be limited from here. I should add that less than 3% of the applications SUS receives eventually turn into loans.
I bought SUS during 2017 at £21 and have not bought or sold since. Only the splendid dividend, which presently offers a 5%-plus income, has kept my returns in positive territory,
The P/E based on my last earnings estimate is almost 13.
My sums also indicate a modest 12% return on equity adjusted for some rather substantial borrowings. That ratio might have to improve before the lid is taken off the share price.
My S & U buy report | All my S & U posts
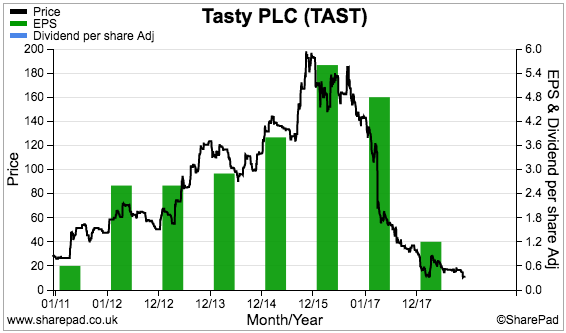
11) Tasty (TAST), mid-price: 11p, market cap: £7m
Oh dear. Following on from being my biggest disaster of 2017… TAST repeated the feat for 2018.
I had thought the hapless restaurant chain started last year relatively well.
True, March’s full-year results showed profit had collapsed from £4m to £0.7m.
However, the sale of various outlets for £4m helped reduce net debt to just £1m (or so I thought). No further property write-offs were announced, either, while management presented a no-nonsense recovery plan.
Some of the directors even bought a few shares, which helped the price rally from 10p to more than 30p in just a few weeks…
Roll on to September, and TAST’s interim figures revealed the harsh reality of a troubled sector. Profit had turned to loss, adverse cash flow left net debt rising to £4m and the restaurant estate suffered a £10m write-down.
A statement in November then admitted the directors will soon inject £0.5m into the business. The same statement also implied — but sadly did not confirm — that cash generation had improved since the summer.
I first bought TAST at 50p in 2011 and again at 98p in 2014. I sold 15% of my holding during 2016 at 179p — and naturally regret not selling the rest.
Instead, during 2017 I increased my holding by 321% after paying 45p. Then during 2018, I increased my holding by a further 85% after paying 15p.
Throughout TAST’s downfall, I have banged the drum for the Kaye family management — which owns 40% of the business and has already built and sold multi-bagger restaurant chains ASK Central for £223m (in 2004) and Prezzo for £304m (in 2015).
Suffice to say, my TAST faith remains dependent on the Kayes.
The brutal lesson I have learned from this investment is that (supposedly) good management cannot beat a bad balance sheet when profits disappear.
My Tasty buy report | All my Tasty posts
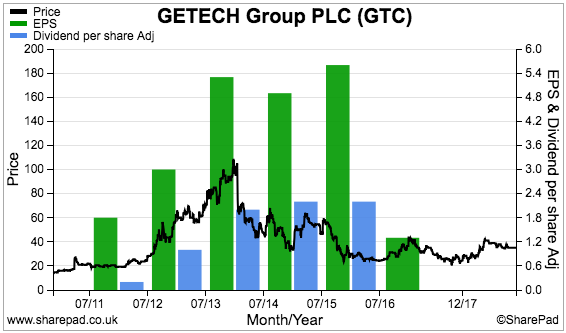
12) Getech (GTC), mid-price: 31p, market cap: £12m
The stock market often works in mysterious ways.
Take GTC. The shares of the geoscience software specialist were my best performer last year…
…and yet the underlying business is struggling to break-even while a dividend has not been seen since 2015.
I thought a complicated set of 17-month figures had showed GTC returning to profit. However, the follow-up interim statement revealed the lowest H1 sales for seven years and a disappointing operating loss.
Normally I would not waste my time with a business that is straining to report a profit. However, I can make an exception for GTC because the firm appears to possess some appealing products.
You see, management claims GTC is by some distance a ‘market leader’ and many of the group’s software services enjoy multi-year — and high margin — subscription income.
In fact, a company re-jig has left 85% of costs as “fixed” — meaning any additional revenue ought to flow mostly to earnings.
The issue, of course, is finding the additional revenue.
Most of GTC’s software products help companies explore for oil and gas — an activity that has remained somewhat subdued during the last few years.
A lot therefore depends on the oil price rising and then kick-starting wider exploration activity.
At least GTC has cash in the bank and a grandiose office up for sale to counterbalance any future losses. The latest directortalk mentioned a “robust sales pipeline”, while a significant sale of a Sierra Leone dataset lingers on the horizon.
I bought originally during 2013 and 2014 — when revenue and profits were riding high — at a 59p average.
I then increased my holding by 19% at 26p during 2017. I did not buy any more shares during 2018 and I have never sold.
My Getech buy report | All my Getech posts
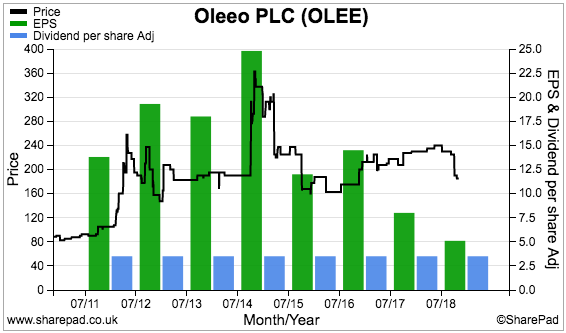
13) Oleeo (OLEE), mid-price: 185p, market cap: £14m
A name-change from World Careers Network to Oleeo darkened my mood towards this recruitment software developer during 2018.
Issuing annual results at 4:28pm on a Friday did not help matters, either, nor did my assumption that OLEE had lost a major contract with HMRC.
However, the HMRC deal was in fact never lost and in the event, 2018 revenue managed to inch 1% higher to a new company record.
Unfortunately, greater development and marketing costs pushed operating profit down 39% to a 14-year low. Both margins and return on equity were lamentable at less that 5%.
In addition, the second half barely broke even and the guidance for 2019 is to expect (yet) another earnings tumble.
At least the balance sheet remains robust — about £10m of ‘surplus’ net cash represents two-thirds of the current market cap.
Oh, and there is a token dividend — which has now been stuck at 3.5p per share for 13 years.
As before, everything now rests on OLEE’s 71% shareholder/founder/chief exec, and whether his strategy of reinvesting substantial sums into the business is ever going to pay off.
Looking closer at the numbers, perhaps the reinvestment has already begun to bear fruit.
You see, if you exclude OLEE’s largest customer (which I believe to be HMRC), revenue has grown from £6.0m to a rather impressive £9.0m between 2014 and 2018.
The majority of that advance has come from the US, where sales have climbed from £760k to £3.4m.
I note OLEE’s boss took a 14%/£41k pay cut last year, so at least the impact of the extra reinvestment has now reverberated to the boardroom.
Wishful thinking perhaps, but I would like to believe when directors cut their own pay, a greater focus is soon applied to lifting sales and profit.
I will be pleased if OLEE avoids reporting a loss for 2019 and offers hope of an improved performance for 2020.
I bought OLEE first during 2015 at 320p and again during 2016 at 182p. I have never bought or sold since.
My Oleeo buy report | All my Oleeo posts
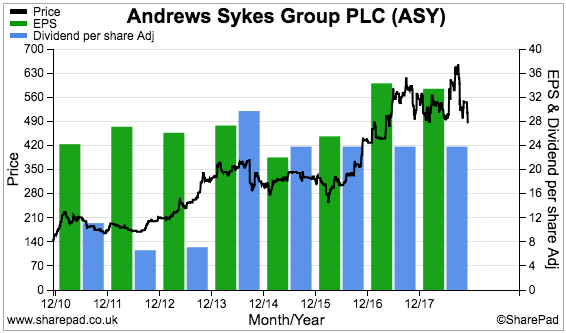
14) Andrews Sykes (ASY), mid-price: 481p, market cap: £198m
ASY is another example of the stock market working in mysterious ways.
This equipment hire firm becomes very busy if the weather turns really hot or cold…
…and yet last year’s deep snow and extended heatwave ultimately did nothing for the share price.
Ongoing demand for temporary boilers, heaters and air conditioners had already helped the 2017 results show turnover up 9% and profit up 11%.
However, the follow-on interims — assisted by the snow and heatwave — showed revenue up ‘only’ 6% and profit up ‘only’ 14%. I had expected a better performance.
Still, ASY ought to deliver all-time record results later this year. And the ratios should be pleasing, too.
At the last count, ASY’s operating margin was a lovely 25% while return on equity was a robust 28%. A chunky £17m net cash position is also in place, and has lent support to the ongoing European expansion. Overseas sales now represent 37% of group revenue.
I must confess, the shares do not look bad value right now. Adjust for the cash pile and the underlying P/E based on my trailing 37p per share earnings guess is 12.
Mind you, the favourable 2018 weather is unlikely to be repeated every year… and I am sure some valuation considerations have to be made for a complicated pension scheme.
Meanwhile, the dividend — which has been stuck at 23.8p per share for four years now — supplies a useful 4.9% income.
I purchased ASY during 2013 at 233p and have not bought or sold since. I would love to buy more during 2019 if the price was right.
Bear in mind that trading ASY shares can be difficult. The 98-year-old chairman and his family own 90% of the business and, like me, do not like to sell.
My Andrews Sykes buy report | All my ASY posts
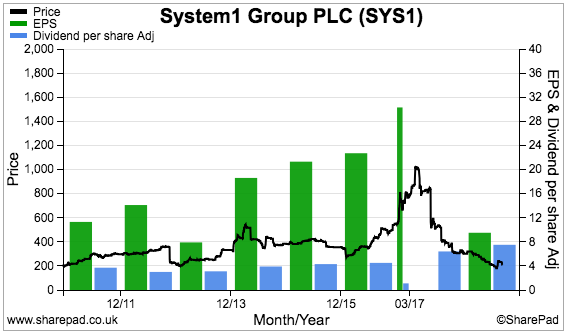
15) System1 (SYS1), mid-price: 215p, market cap: £27m
“Miserable”.
That was the adjective used by SYS1’s chief exec to describe his company’s annual results after profits collapsed by 72%.
A Warren Buffett-backed bid to buy Unilever apparently caused multinational clients to reduce advertising expenditure, which in turn created less demand for SYS1’s market-research services.
Slightly more worrying, management talked of industry rivals “increasingly adopting” the group’s behavioural-science approach.
SYS1 has always prided itself on being a market-research pioneer, and yet the results always seem to refer to redesigned products and clients quibbling about price.
Perhaps SYS1 is no longer that pioneering. A sub-10% operating margin suggests that might now be the case.
Nevertheless, the group has recently launched Ad Ratings as its latest venture to return to growth.
Ad Ratings is a subscription service that allows clients to monitor the advertising effectiveness of rival brands through SYS1’s data and analysis.
To be honest, I am not sure whether Ad Ratings will be truly transformational for the group.
Right now, all we can be sure of is that most of SYS1’s ‘core’ first-half profit was expensed on the launch of the new service.
I increased my SYS1 investment by 201% at 238p during 2018. At the time, I believed the Ad Ratings expenses would not be as high as they have since become.
These days, justifying a purchase requires a belief that Ad Ratings will one day break-even. The cash-adjusted P/E is approximately 9 if you ignore the notable losses from the new service. The dividend yield is 3.5%.
I originally bought at 325p during 2016 and was attracted by the company’s proven history of organic expansion, its evangelical leader/26% shareholder and the very straightforward, cash-rich accounts.
Looking to 2019, I just hope Ad Ratings can take off while the ‘core’ business stabilises after the “miserable” 2018.
(In the meantime, SYS1 is my favourite share to research. I get to read about muppet giant crumpets and watch the colourful Mark Ritson!)
My System1 buy report | All my System1 posts
I decided to sell one share entirely last year
I don’t miss owning the company below. Here are the details:
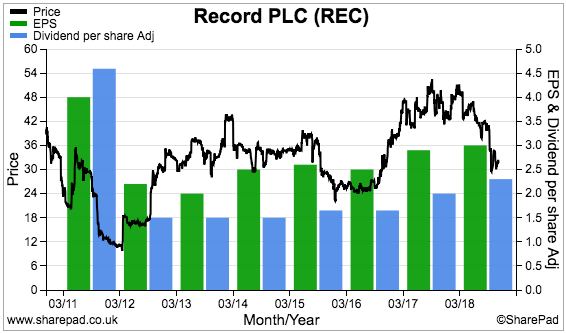
SOLD) Record (REC)
My sole 2018 disposal was REC. I disposed of my entire holding at 41.9p including all costs.
As I mentioned in my April update, I should have sold out of the currency-trading specialist a lot earlier than I did.
I had become frustrated by a lack of new client mandates alongside the extra costs that had crept steadily into the business.
I was also tired of RNSs that regularly mentioned lost customers, lower fee rates, so-so investment returns… and “engagement with prospective clients” that never led anywhere.
Similar to many companies operating within the financial-services sector, REC gave the impression of being run more for the benefit of its (well-paid) staff than for ordinary shareholders.
True, REC exhibited some very attractive financials. The operating margin was consistently in excess of 30%, returns on equity were often close to 50%, while cash flow was majestic and sustained a substantial bank balance without debt.
The board’s aim to pay chunky dividends also appealed.
Nonetheless, attractive books and sizeable dividends are always dependent on the underlying business — and REC’s lower-fee/rising-cost trend did not appear that favourable. In fact, the struggle to win new clients suggested the firm’s services were not actually that good.
(Lost mandates announced during October appear to have borne out my verdict.)
I bought REC shares between 2010 and 2015 at an average of 19.8p, and sold between 2012 and 2018 at an average of 31.4p. I collected dividends of 3.1p per share along the way, making a total gain of 75%.
My Record buy report | All my Record posts
These annual reviews never become any quicker to write
Similar to 2014, 2015, 2016 and 2017, my portfolio membership did not change too dramatically during 2018.
I started last year with 16 shares, of which only one has since been removed entirely.
And to confirm, there were no shares bought and then sold during 2018 that did not make this review.
The plan for 2019? Perhaps I can improve my returns by focusing more on my higher-conviction positions. I do think some of my portfolio companies have drifted away from their original qualities.
I trust you found this Blog post informative — I certainly found it useful to write.
Please click here to examine my portfolio’s 2018 performance in more detail.
Until next time, I wish you happy and profitable investing!
Maynard Paton
PS: You can receive my blog posts through an occasional email newsletter. Click here for details.
Disclosure: Maynard owns shares in Andrews Sykes, Bioventix, Castings, City of London Investment, Daejan, Getech, Mincon, Mountview Estates, Oleeo, S & U, System1, Tasty, FW Thorpe, Tristel and M Winkworth.

whats the total value of your investment portfolio?
Hello Bob
For most people, the value would be quite large.
Maynard
Very thorough and informative, thank you.
I hold ASY thanks to this blog and am reasonably happy with it so far. The 98 year old does give food for thought though.
Well done for Bioventix. Not my type of holding but perhaps it should be.
Thanks FIRE V London. I am sure the 98-year-old will pass his shareholding down to his children, some of whom are also ASY directors. When I attended the AGM a few years ago, I got the impression the children were unlikely to do anything radical.
Maynard
Thanks for posting. I always enjoy your posts as you write in a clear, no-nonsense manner. All the best for 2019.
Out of interest: do you think it is likely that the UK would ever introduce dividend withholding tax ? Just curious.
Thanks Christian.
Not sure about the withholding tax. Not my area of expertise I am afraid!
Maynard
Hello! Can someone please explain to me what does it mean “on a bid-price to bid-price basis”?
Thanks in advance!
Hello Arthur
I can explain.
You sell shares at the bid price and buy shares the offer price. The difference between the two prices is called the spread. For large companies, the spread can be fractions of a penny because the shares are traded in their millions all of the time.
However, my shares are smaller and less ‘liquid’. As such, there can be notable differences between the bid price and the offer price, and which give a wide spread.
For accuracy, I value my portfolio on a bid-price basis — that is, the real-life price I could get for selling my shares.
So… the ‘bid-price to bid-price basis’ confirms I valued my portfolio on a bid-price basis at the end of 2017 and did the same at the end of 2018.
Some people value their portfolios on a mid-price basis. That is, they take the price quoted on Google or wherever, which is generally mid-way between the bid-price and the offer price.
The trouble with the mid-price approach is that it flatters performance (and does not reflect the reality of buying and selling) if you own smaller shares that carry wide spreads.
Maynard