23 August 2018
By Maynard Paton
Update on Mincon (MCON).
Event: Interim results for the six months ending 30 June 2018 published 13 August 2018.
Summary: MCON extended its bumper 2017 progress with some very satisfactory first-half figures. The specialist drill manufacturer claimed greater orders from the mining sector had supported 12% organic sales growth, while my sums suggested a robust 19% operating margin was reached during the second quarter. In addition, current trading appears healthy and a recent acquisition may have performed much better than expected. However, a P/E in excess of 20 probably reflects all of the positives, especially given cash conversion remains below par. I continue to hold.
Price: 155p
Shares in issue: 210,541,102
Market capitalisation: £326m
Click here to read all my MCON posts
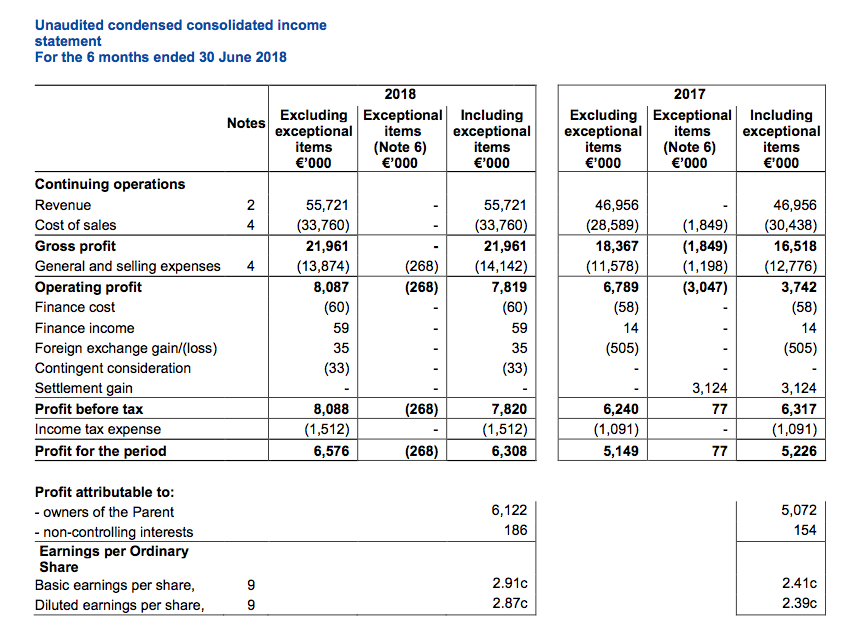
Results:
My thoughts:
* “We are on a path to remove third party sales from our line-up“
The €7.8m purchase of Driconeq — a Swedish drill-pipe specialist — during March helped ensure these interim figures would set new first-half records.
Total sales gained 19%, or €8.8m, of which €8.1m was generated by Driconeq. Meanwhile, operating profit climbed 19%, or €1.3m, of which approximately €0.2m was contributed by Driconeq.
April’s first-quarter update had already signalled MCON’s underlying progress was now being led by orders for its in-house manufactured products.
This first-half statement confirmed the trend, with H1 sales of Mincon equipment up 12% (€4.2m) to €39.4m (a new H1 record), and H1 sales of third-party products down 29% (€3.4m) to €8.3m.
For the first time I can recall, MCON suggested it was deliberately discontinuing sales of certain third-party equipment:
“We are on a path to remove third party sales from our line-up where that makes commercial sense, to either manufacture them in our own plants, or discontinue the sales. The gross margin percentage on manufactured products is higher and is a more significant driver of our earnings.This is particularly true where the engineering value add is significant.”
For some perspective on profitability, the gross margin on third-party sales is approximately 20%, while the gross margin on own-branded products is well above 40%:
| Third party | 2013 | 2014 | 2015 | 2016 | 2017 | H1 2018 |
| Revenue (€k) | 11,645 | 12,728 | 17,480 | 19.821 | 22,393 | 8,315 |
| Cost of sales (€k) | (8,719) | (10,010) | (13,772) | (15,562) | (17,580) | (6,569) |
| Gross profit (€k) | 2,926 | 2,718 | 3,708 | 4,259 | 4,813 | 1,746 |
| Gross margin (%) | 25.1 | 21.4 | 21.2 | 21.5 | 21.5 | 20.1 |
| Own brand | 2013 | 2014 | 2015 | 2016 | 2017 | H1 2018* |
| Revenue (€k) | 40,698 | 41,816 | 52,786 | 56,360 | 74,965 | 39,307 |
| Cost of sales (€k) | (17,902) | (20,982) | (28,217) | (30,058) | (41,940) | (21,147) |
| Gross profit (€k) | 22,796 | 20,834 | 24,569 | 26,302 | 33,025 | 18,169 |
| Gross margin (%) | 49.1 | 43.2 | 40.2 | 40.1 | 38.9 | 46.2 |
(*excludes Driconeq)
As well as the revenue increase, the sales-mix change also prompted a notable profit improvement (see below).
* Underlying Q2 operating margin may have reached 19%
Here are my best guesses of MCON’s quarterly performances (excluding Driconeq):
| Q1 2018 | Q2 2018* | Q3 2018 | Q4 2018 | |
| Revenue (€k) | 22,650 | 24,972 | - | - |
| Operating profit (€k) | 3,080 | 4,777 | - | - |
| Operating margin (€k) | 13.6 | 19.1 | - | - |
(*excludes Driconeq)
| Q1 2017 | Q2 2017 | Q3 2017 | Q4 2017 | |
| Revenue (€k) | 21,368 | 25,588 | 24,875 | 25,527 |
| Operating profit (€k) | 2,457 | 4,332 | 3,483 | 3,768 |
| Operating margin (€k) | 11.5 | 16.9 | 14.0 | 14.8 |
True, second-quarter revenue was slightly below that recorded during the comparable period of 2017.
However, the margin improvement during Q2 was significant — and underlined the greater profitability from replacing third-party products with the group’s own-manufactured equipment.
Indeed, I am hopeful my 19% margin estimate for Q2 means MCON is back on the road towards the 19%-plus full-year margin that first attracted me to the shares back in 2015.
Growing demand for drills and bits from the recovering mining sector allowed MCON to pass on cost increases to its customers:
“While there are pressures on the raw materials side, we are beginning to be able to recoup those input cost-increases from the end customers after four years or more of margin squeeze.”
More significantly, MCON reiterated it was still trying to dig (or drill) a ‘moat’ for longer-term investors (my bold):
“Our goal is not revenue growth for its own sake, but sustainable earnings growth, and niche manufacturing to develop defendable intellectual property that underwrites our margins over time. We work to build long term sustainable, defensible market positions by offering value for money rather than price as our central proposition. We see better engineering as core to our product offering.”
* New acquisition could be performing far ahead of expectations
The aforementioned purchase of Driconeq provided an eye-catching contribution during this first half.
The original acquisition announcement claimed the new subsidiary could create additional annual revenue of €21m.
However, the Swedish outfit produced revenue of €8.1m (assuming my sums are correct) during the first three or so months of MCON’s ownership.
I am not sure what to make of this situation. Either:
i) Driconeq’s revenue is very seasonal, or;
ii) Driconeq is performing far ahead of expectations, or;
iii) my sums are wrong.
Reflecting the “problems that have crept into that group over the last few years”, MCON said Driconeq’s profit margin was a tiny 2.5%.
Wishful thinking perhaps, but given how profitable the wider business has become, I am hopeful Driconeq’s margin could one day advance to, say, a double-digit level.
Note, too, that MCON’s other Nordic operations — which I estimate generate annual sales of less than €5m — reached breakeven during this first half and have since become profitable. So further progress here could also enhance MCON’s overall profitability.
* Mysterious accounting for intangibles and a €9m “inventory swell“
I must confess to being a tad disappointed with MCON’s cash flow.
As I noted within my March full-year review, there are ‘issues’ with MCON’s intangible expenditure and working-capital movements.
The accounting of intangible expenditure certainly remains a mystery.
MCON confirmed expenditure of €711k had been capitalised on the balance sheet:
“We capitalised some €711,000 of expenditure on this development project for our hydraulic hammer systems in the first half and carry the investment in the balance sheet at €2.4 million.”
And yet the cash flow statement continues to ‘hide’ this €711k:
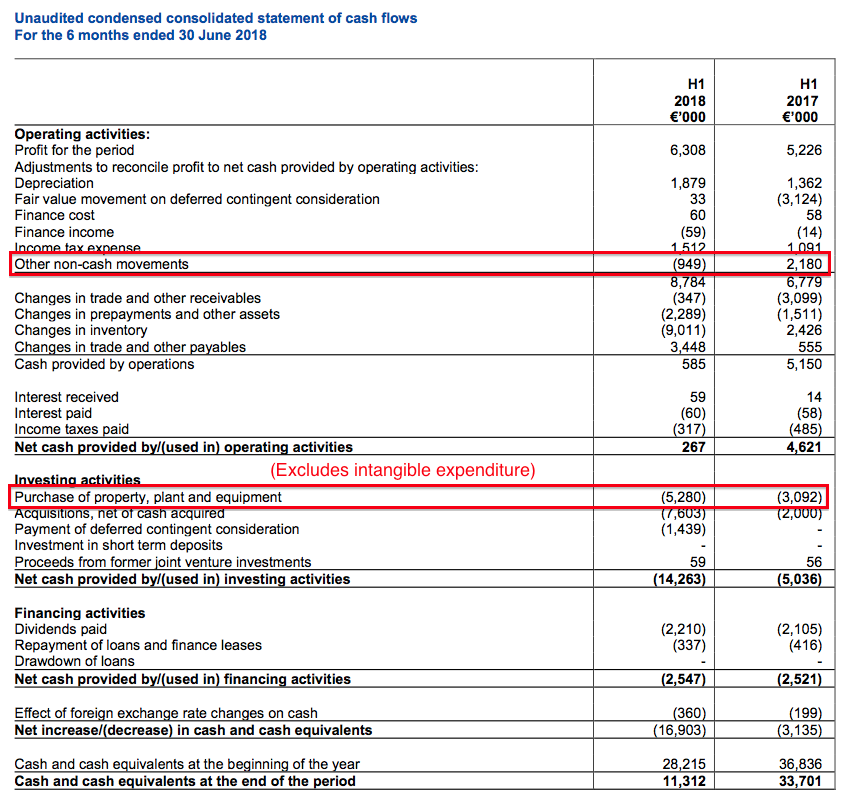
As before, I can only assume the €711k has been lumped within ‘other non-cash movements’ — the entry for which still appears to be a useful cover for disclosure avoidance. (I think clarification from MCON’s finance director is now in order.)
Elsewhere within the cash flow statement, working-capital movements did not look great:
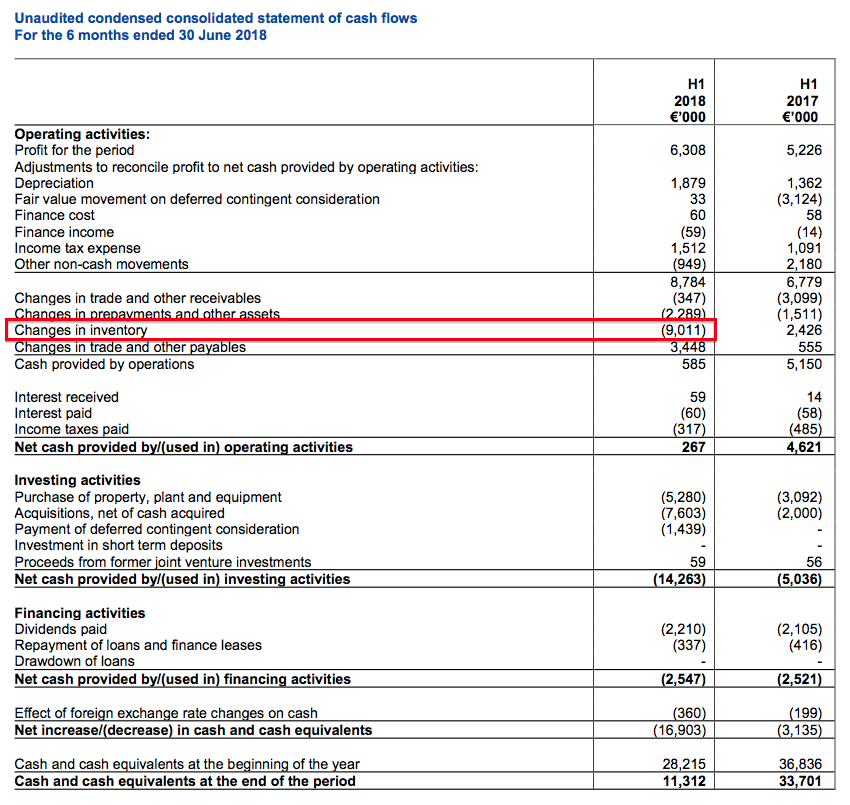
An €8,087k operating profit translated into cash from operations of only €585k following substantial cash payments for additional stock.
MCON explained the “inventory swell”:
“We previously flagged that we intended to invest a further €5 million in raw material inventory as we ramped up manufacturing to meet the expanding order book. We invested in plant, we have stepped up manufacturing volumes against orders, and we have very significant inventory in transit and arriving to support the sales growth we realised last year but which we have not been able to support in H1. We estimate that we are approximately half way through the working capital cycle that has absorbed these funds and we are now getting to the point where the increased inventory is hitting our own shelves in the customer centres.”
“This inventory swell through the working capital cycle should unwind to some degree in the H2 for the Group, though we may maintain the raw material investment to moderate the risk of price increases and basic non-supply due to the sector demands elsewhere. Of the current uplift, €4.6 million came in with Driconeq and we believe is good inventory, €4.5 million is in raw material strongly bought forward to support the increased turnover and to mitigate the supply side price increases, and the rest is in transit or reaching the shelves of the sales offices.”
Sure, investing in additional raw materials — in part to service the ongoing influx of new orders — does not sound too alarming.
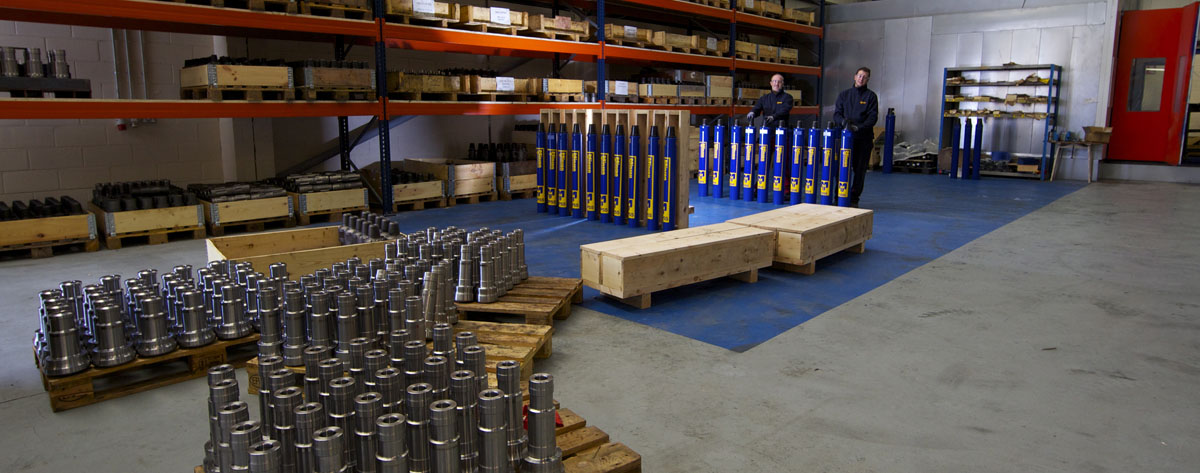
However, MCON’s half-year stock level came to almost €44m, which is huge compared to annual revenue that currently runs at approximately €120m:
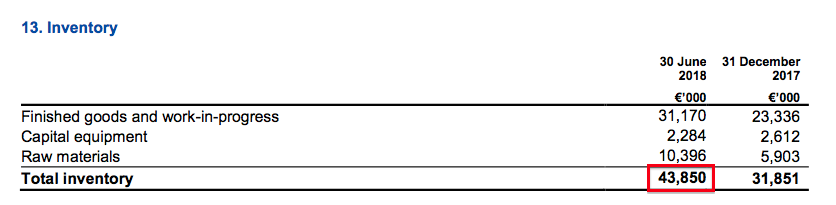
MCON’s 2017 results had displayed some improvements to working-capital management, but I get the impression MCON will always operate with substantial sums tied up in warehouse stock.
(I understand this warehouse stock forms part of MCON’s competitive advantage, whereby the group is able to supply drills and bits at short notice to miners operating in remote locations.)
The family management — which collectively owns a 57%/£185m shareholding — did not seem too concerned about the (lack of) cash generation. The board lifted the interim dividend by 5% to 1.05 euro cents a share.
The stock build-up, the Driconeq purchase, as well as a sizeable €5m capex bill, meant the cash balance dropped a hefty €17m to €11.3m during the six months.
Indeed, the €47m raised at the 2013 flotation has now almost all been spent.
Factor in borrowings of €1.7m and deferred acquisition payments of €6m, and the effective net cash position is now arguably just €3.6m, or approximately 1.6p per share.
Valuation
The management commentary included a number of positive trading snippets (my bold):
“The team is confident across the businesses, the sector appears strong, lead times have increased for capital goods which should mean strength in the sectors that we serve, and orders remain robust in most of our markets.”
There was also talk of these first-half figures being hindered by unfulfilled orders that should clear during the second half:
“The decline in the USA is largely due to not being able to supply against order for the market in H1. That situation has since been recovered by a greatly increased supply from our factories at the end of the half, and we expect an improvement through the rest of the year as the backlog clears.”
Certainly the share price — which has surged 50% so far this year — is expecting stellar near-term progress.
MCON’s trailing €15.3m operating profit converts into earnings of £11.2m, or 5.3p per share, after applying tax at 19% and using a £1:€1.11 exchange rate.
Dividing the 155p share price by my 5.3p EPS guess then gives a multiple of 29x. (Adjusting for the €3.6m effective net cash position does not make any discernible difference).
Is this rich multiple justified?
Well, annualising the bumper Q2 €4.8m operating profit could give earnings of 6.6p per share. Then assuming Driconeq could suddenly deliver an additional €2m annual operating profit, total earnings would then become 7.3p per share to support a 21x multiple.
In light of ratings applied to other ‘growth shares’ at present, I dare say a few more years of decent revenue growth and margin improvement could leave today’s 20-plus P/E looking cheap.
However, I much preferred MCON shares when they were 44p back in 2015, at which point the group was undergoing a rough patch and the P/E was 10-11… and yet the hallmarks of a quality business run by very competent managers were still quite clear.
With the shares currently representing approximately 7% of my portfolio, right now I am happy to simply hold on… and trust the growing demand for the group’s drills and bits does indeed continue for the next few years.
In the meantime, the current €0.021 per share dividend provides me with a modest 1.2% income (before Irish withholding taxes for UK-resident investors).
Maynard Paton
PS: You can now receive my Blog posts through an occasional e-mail newsletter. Click here for details.
Disclosure: Maynard owns shares in Mincon.

Mincon (MCON)
Third-quarter trading update
MCON’s Q3 statement was issued on 26 October. The financial highlights are shown below:
—————————————————————————————————————————–
Key elements (comparison of the first nine months of 2018 to 2017):
* Revenue up 22% for the first nine months
o Mincon product sales increased 37%
· of which Driconeq accounted for c. 26%
· and the residual group growth was c. 11%
o Third party product sales down 26%
Gross margin excluding Driconeq up to 41% from 38.7%
o Gross margin of 38.3% when Driconeq is included
* Operating profit excluding Driconeq at 15.8% up from 14.3%
o 14% when Driconeq is included
* Profit before tax excluding Driconeq at 15.2% up from 13.1%
o 13.3% when Driconeq is included
* EBITDA excluding Driconeq up to 19% from 17.6%
o 17.2% when Driconeq is included
—————————————————————————————————————————–
I must admit to struggling with my sums here. MCON reveals slightly different Q1/Q3 information every year, and I can’t be too sure I have calculated accurate quarterly figures this time around.
Including Driconeq, I reckon Q123 revenue, gross profit and operating profit were €87,633k, €33,914k and €12,269k respectively. From that, I have deduced Q3 revenue, gross profit and operating profit were €31,912k, €11,953k and €4,182k respectively.
The Q3 performance (sales and margin) was slightly below that of Q2, but the same ‘dip’ happened during Q3 of 2017.
My sums indicate Q3 in-house/Driconeq revenue was €27,082k and third-party revenue was €4,830k. Extrapolating back to Q3 2017 gives me €19,160k for in-house and €6,020k for third-party, which look about right — but do not add up to the €24,875k total revenue already in my Q3 2017 spreadsheet cell. And from there, the sums become more confusing when I tryg to gauge exactly how MCON performed without Driconeq and the dwindling third-party sales.
All I can safely say for Q3 was the main business grew sales by the stated 11% and that margins dropped a percentage point or so from the first half.
The rest of the text follows with my comments inserted:
—————————————————————————————————————————–
Mincon product expressed as a percentage of our total sales continues to grow, from 76% to end Q3 last year to 85% for the year to date in 2018, 86% in Q3 alone. We have been driving a strategy where we manufacture and sell our own engineered products to give us superior control on our quality and distribution, and better margin where our engineering delivers advantage to our customers. Exclusive of Driconeq, the change to Mincon manufactured products continues to deliver an improved gross margin, to 41% compared to 38.7% for the comparable group to last year, or 38.3% when Driconeq is included.
—————————————————————————————————————————–
Note that the improved gross margin of 41% is on a nine-month basis. The H1 gross margin excluding Driconeq was 41.8%, so Q3 suffered a lower gross margin. I can’t work out what Q3 2018 revenue was for Driconeq, other in-house products and third-party products with any accuracy.
—————————————————————————————————————————–
Revenue
The Group continues to grow, albeit this has moderated as we reflect comparatives on the higher levels of turnover achieved in the latter part of last year. Of more note is that the capacity investment which we initiated in 2016, and which continues to arrive and be installed, is returning the Group to a dynamic equilibrium, where we can grow and maintain our lead times for delivery at the four and five week level.
We can now begin to redeploy resource to focus again on more of the higher value products, new products where we have been unable to allocate production time, and building out, for example, hammer ranges where we have the engineering work completed but have had no capacity to produce.
We plan to increase profits next year by improving efficiency, reducing waste on freight and other overheads, and in allocating labour to higher value added activities. We should take this opportunity to thank our whole team in the factories and customer service centres for their hard work and commitment over the last two years in creating this step change in our business.
There are two significant changes in our management model for the coming year. The first is in the creation of the “product manager” category to provide focus on each of our main business lines, and the second is in the build out of our engineering team. Working together with the factories , these teams will co-ordinate the service model to our customers, the development of our product ranges, and provide the commercial and engineering direction for the Group in the coming years.
—————————————————————————————————————————–
All that sounds reasonably encouraging. “We plan to increase profits next year” is useful to know, too.
—————————————————————————————————————————–
Driconeq acquisition
Driconeq is a substantial acquisition, and the investment of time and funding required to bring it into the Group in a coherent fashion has been extensive. The acquisition included businesses and factories in Sunne, Sweden, Johannesburg South Africa, and Perth, Australia, with the Australian company having to be taken out of administration. As we previously mentioned, the Australian business required an additional A$1 million to prepay creditors who had entered into an arrangement through the court, which has accommodated the transfer of the business and people into our Australian operations.
In Sunne, similarly, we have combined the drillpipe businesses and transferred our own business and people into Driconeq, all of which has been amicable and in compliance with local regulations. In South Africa the management teams have been working together, though we have no plans to combine them. In Sweden our heat treatment plant in Kristenhamm remains unchanged, as a well-run profitable business serving the group, among others. Overall the performance of the Driconeq Group is improving, and beginning to meet expectations.
We are beginning to see the benefits of the reorganization with an improving operating margin benefitting from the consolidation, and we are optimistic that the performance in 2019 will be in line with the expectations we had on acquisition.
—————————————————————————————————————————–
Hmmm… “Overall the performance of the Driconeq Group is improving, and beginning to meet expectations” sounds as if things weren’t going exactly to plan immediately after the March purchase.
—————————————————————————————————————————–
The hydraulic hammer range
As announced by the Company on 15 October, this project continues on its development path, and while we have been expecting the system to go on a key customer rig during this year, we have had minor delays for fitting, specifically in relation to the threading of the drill string. These are not significant engineering set-backs, rather they are the fitting elements through which we continue to build the IP of the system. We find the problems and solve them, and while doing so, build a more robust system with a higher barrier to entry.
We expect to have the engineering work done on the drill string by the end of the November 2018 and be ready to install the system from then. Achieving high levels of engineering efficiency and quality will always be a priority of Mincon and we remain focused on bringing this system to market once we are satisfied it is ready to launch.
—————————————————————————————————————————–
Not a great setback, and the further work does create a “higher barrier to entry” silver lining.
—————————————————————————————————————————–
Margins
The gross margin of the underlying business continued to improve, to 41% for the year to the end of September, compared to 38.7% last year, and this supported a 1.5% improvement in the operating margin for the Mincon Group (excluding Driconeq) to 15.8%.
Excluding Driconeq, the profit before tax at the end of September came out at 15.2% compared to 13.1% last year, and when including Driconeq, this netted out at 13.3% overall.
—————————————————————————————————————————–
All these figures are for the nine months. Margins excluding Driconeq were down slightly during Q3 when comapred to those recorded during H1.
—————————————————————————————————————————–
Balance sheet
We have directed our cash into acquisitions, inventory and capital expenditure in the last year in particular, to match capacity with the strength in orders, and to gain control of key processes like heat treatment, which allows us to base production in three key factories in Shannon, Perth and Benton Illinois, and allocate it efficiently according to customer needs and manufacturing advantage.
This phase of investment came to an end, as planned, in H1, and while we continue to install contracted capital expenditure, we have substantially finished this build out, and expenditure levels should glide towards the depreciation charge over the next year. The inventory spend has also peaked, and with the normalising of turnover and orders at the current level, we can improve efficiencies across the entire Group. We see the lead time on supply also shrinking so that we do not need to maintain investment in raw materials at the current levels through the next six months.
—————————————————————————————————————————–
Scaling back capex and stock levels is encouraging. MCON has not exhibited the best cash conversion over the years, so any enhancements in this department would be welcome.
—————————————————————————————————————————–
Market comment and position
We have probably reached the dynamic equilibrium we have been seeking through the last eighteen months, where we can supply customers within a more normal four or five weeks lead time, and maintain a reasonable organic growth rate. While we have brought on new capacity, so have competitors and suppliers, so the market is stabilizing at the current higher level. To gain much more from here means taking market share, and that means bringing through the next generation of products, widening the product range, and delivering new fuel efficient engineering to the market.
While we have not set price competition as our market position, we will address challenges as they arise, while continuing to carry out case studies that establish the value of our products to the end customer. The success of this approach can be seen in our improving margins, but we do not take these for granted.
—————————————————————————————————————————–
It appears the rapid mining-recovery-led growth of the last year or so has been and gone and further expansion will be somewhat more modest. I will be quite happy if this Q3 statement’s reference to 11% ‘residual group growth’ turns out to be a good indication of MCON’s near-term prospects. Management talk of not setting price competition as a market position sounds good to me — best always to sell on higher quality, as customers generally work out that buying cheap and lower quality is often a false economy.
Maynard