Last updated: 02 January 2025
By Maynard Paton
Contents
- Latest portfolio holdings
- Latest share trades
- Portfolio performance
- Quarterly portfolio updates
- Individual share returns
Latest portfolio holdings
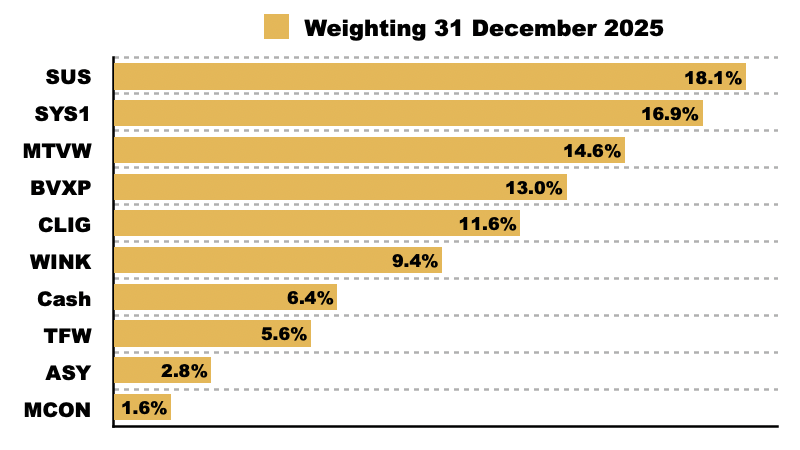
The chart and table below list my portfolio holdings as at 31 December 2025:
| Holding | First bought | Average price paid (p) |
| Andrews Sykes (ASY) | May 2013 | 233 |
| Bioventix (BVXP) | August 2016 | 2,182 |
| City of London Inv (CLIG) | August 2011 | 308 |
| Mincon (MCON) | February 2015 | 45 |
| Mountview Estates (MTVW) | November 2011 | 7,696 |
| S & U (SUS) | January 2017 | 1,776 |
| System1 (SYS1) | March 2016 | 212 |
| FW Thorpe (TFW) | October 2010 | 79 |
| M Winkworth (WINK) | June 2011 | 116 |
Please click on the company name to read an archive of my posts about each company. Please click on the date of my first purchase to read my initial buy report.
(Note: I do not own any further stock-market investments beyond this portfolio)
Latest share trades
The table below lists my share trades conducted between 01 January 2020 and 31 December 2025:
| Trade | Share | Date | Price (p) |
| Top up | S & U (SUS) | Q3 2025 | 1,871 |
| Top up | Bioventix (BVXP) | Q2 2025 | 2,408 |
| Top up | S & U (SUS) | Q2 2025 | 1,464 |
| Top up | Bioventix (BVXP) | Q1 2025 | 2,976 |
| Full sale | Tristel (TSTL) | Q1 2025 | 352 |
| Top up | Mountview Estates (MTVW) | Q4 2024 | 9,015 |
| Top up | City of London Investment (CLIG) | Q2 2024 | 332 |
| Top up | Mountview Estates (MTVW) | Q2 2024 | 9,988 |
| Top up | S & U (SUS) | Q2 2024 | 1,862 |
| Top up | City of London Investment (CLIG) | Q4 2023 | 320 |
| Full sale | Tasty (TAST) | Q3 2023 | 2 |
| Top up | City of London Investment (CLIG) | Q4 2022 | 353 |
| Top up | System1 (SYS1) | Q2 2021 | 242 |
| Top up | M Winkworth (WINK) | Q2 2021 | 178 |
| Top up | S & U (SUS) | Q4 2020 | 1,720 |
| Top up | System1 (SYS1) | Q4 2020 | 173 |
| Full sale | Daejan (DJAN) | Q1 2020 | 7,700 |
| Top up | System1 (SYS1) | Q1 2020 | 251 |
Portfolio performance
The table below summarises my investment performance from 01 January 2015 to 31 December 2025:
Please click on the links inside the table to read more about that year’s performance.
I compare my portfolio against the FTSE 100 total return index as it is the main UK benchmark (more details here).
The following chart and table compare my portfolio against the FTSE 100 total return index since I commenced this blog at the start of 2015:
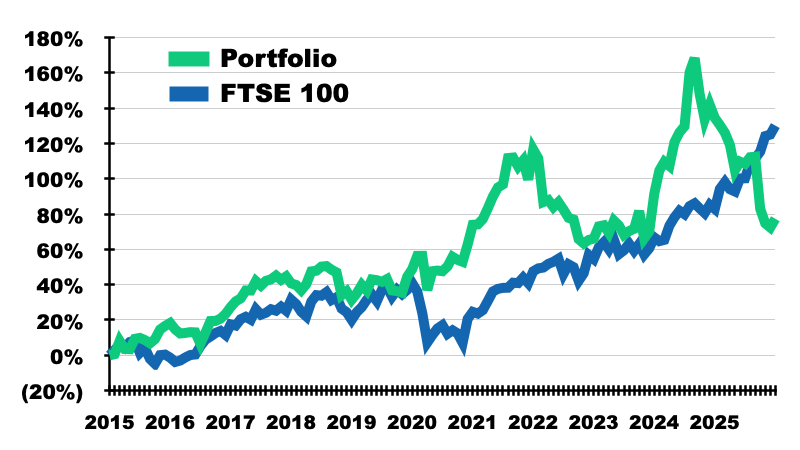
| To 31 December 2025 | My Portfolio | FTSE 100 TRI |
| 1 year | (24.4%) | 25.8% |
| 3 years | 6.8% (2.2%pa) | 48.9% (14.2%pa) |
| 5 years | 2.0% (0.4%pa) | 84.7% (13.1%pa) |
| 10 years | 49.9% (4.1%pa) | 133.1% (8.8%pa) |
| From 31 December 2014 | 77.3% (5.3%pa) | 130.1% (7.9%pa) |
Quarterly portfolio updates
I review my portfolio at the end of every quarter. The links below recap my progress:
- Q4 2025: Down 24.4% For The Year and Year in Review 2025
- Q3 2025: 1 Top-Up
- Q2 2025: 2 Top-Ups And How I (Now) Invest
- Q1 2025: 1 Top-Up, 1 Sell And Finding Ammunition For My Elephant Gun
- Q4 2024: 1 Top-Up And Up 22.4% For The Year and Year in Review 2024
- Q3 2024: No Trades And Running Multi-Baggers To 40% (Or More!) Of Your Portfolio
- Q2 2024: 3 Top-Ups And ‘When It’s Drizzling Gold, Reach For A Bowl’
- Q1 2024: No Trades And My Portfolio’s Best And Worst Corporate Cash Managers
- Q4 2023: 1 Top-Up And Up 15.3% For The Year and Year in Review 2023
- Q3 2023: 1 Sell And Enjoying 100% Returns From Ordinary Dividends
- Q2 2023: No Trades And Are You A Good Investor?
- Q1 2023: No Trades And 10 Lessons From 3 Small-Cap AGMs
- Q4 2022: 1 Top-Up And Down 23.3% For The Year and Year In Review 2022
- Q3 2022: No Trades And Portfolio Winners As GBP Slides Towards USD Parity
- Q2 2022: No Trades And 8 Years Of Special Dividends
- Q1 2022: No Trades And Surging Energy Prices And The Companies Most Vulnerable
- Q4 2021: Up 24.5% For The Year and Year In Review 2021
- Q3 2021: No Trades And Linking Revenue Per Employee To Investment Success
- Q2 2021: 2 Top-Ups And 5 Lessons From Owning 5 Shares For 10 Years
- Q1 2021: No Trades And My ABC Of Investing
- Q4 2020: 2 Top-Ups And Up 16.9% For The Year and Year In Review 2020
- Q3 2020: No Trades And Up To 85% Returns From Boring Old Dividends
- Q2 2020: No Trades And 10 Lessons From A 10-Bagger
- Q1 2020: 1 Sell, 1 Top-Up And An Emergency Portfolio Review
- Q4 2019: 2 Sells And Up 13.1% For The Year and Year In Review 2019
- Q3 2019: 1 Top-Up, 3 AGMs And Obscure But Important Annual Report Small-Print
- Q2 2019: 1 Sell, 3 Top-Ups And Portfolio Analysis The Fundsmith Way
- Q1 2019: 1 Top-Up And Update On Plan For 2019
- Q4 2018: 2 Top-Ups And Down 6.6% For The Year and Year In Review 2018
- Q3 2018: 1 Top-Up And My SharePad Side Income
- Q2 2018: 1 Sell And Some Thoughts On Pension Deficits
- Q1 2018: 1 Top-Up And 3 Blog Enhancements
- Q4 2017: 2 Top-Ups And Up 10.5% For The Year and Year In Review 2017
- Q3 2017: 2 Top-Ups And 1 Top-Slice
- Q2 2017: No Buys Or Sells
- Q1 2017: 1 New Buy And 1 Sell
- Q4 2016: Up 7.6% For The Year and Year In Review 2016
- Q3 2016: 1 Buy, 1 Sell, 1 Top-Up, 1 Top-Slice
- Q2 2016: 3 Top-Ups And 5 AGMs
- Q1 2016: 1 New Buy, 2 Top-Ups And 2 Top-Slices
- Q4 2015: 1 New Buy And Up 18% For The Year and Year In Review 2015
- Q3 2015: 1 New Buy, 1 Top-Up And 3 Top-Slices
- Q2 2015: 1 Top-Up
- Q1 2015: 3 Sells, 2 New Buys And 1 Top-Up
Individual share returns
The table below summarises my individual share returns from 01 January 2004 to 31 December 2025:
| Share | Holding period | Total return (%) |
| Tristel | Dec 2013 - Feb 2025 | 407.8 |
| FW Thorpe | Oct 2010 - | 313.1 |
| London Stock Exchange | Apr 2004 - Nov 2007 | 297.0 |
| Andrews Sykes | May 2013 - | 280.7 |
| Nokia | May 2004 - Jul 2010 | 145.7 |
| M Winkworth | Jun 2011 - | 133.0 |
| Assoc British Ports | Jun 2004 - Jun 2006 | 117.4 |
| Dealogic | Feb 2010 - Oct 2011 | 82.7 |
| City of London Inv | Aug 2011 - | 75.0 |
| Record | Dec 2010 - Apr 2018 | 74.8 |
| Active Risk | May 2013 - Sep 2013 | 68.3 |
| Elec Data Processing | Sep 2012 - Mar 2017 | 60.4 |
| Abbey Protection | Mar 2011 - Jan 2014 | 59.7 |
| Mountview Estates | Nov 2011 - | 53.1 |
| Daejan | Oct 2015 - Mar 2020 | 47.4 |
| French Connection | Jul 2011 - Sep 2016 | 46.4 |
| S & U | Jan 2017 - | 42.4 |
| Burford Capital | Nov 2012 - Feb 2015 | 32.2 |
| Mincon | Feb 2015 - | 29.8 |
| Robert Wiseman Dairies | Jun 2011 - Jan 2012 | 28.2 |
| System1 | Mar 2016 - | 14.2 |
| Bioventix | Aug 2016 - | 11.1 |
| Pennant International | Oct 2013 - Mar 2015 | 10.4 |
| Soco International | Nov 2011 - Oct 2014 | 10.1 |
| Castings | Sep 2015 - Apr 2019 | (1.6) |
| SeaEnergy | Nov 2013 - Mar 2015 | (11.6) |
| 3 Legs Resources | Nov 2011 - May 2014 | (17.0) |
| Instore | Dec 2007 - Oct 2009 | (18.8) |
| Oleeo | Feb 2015 - Dec 2019 | (30.5) |
| Getech | Apr 2013 - Nov 2019 | (46.6) |
| London Capital | Oct 2010 - Mar 2011 | (50.5) |
| Tasty | Dec 2011 - Aug 2023 | (85.0) |
The company names in bold are the shares I held on 31 December 2025. Please click on the links inside the table to read an archive of posts about certain sold companies.
The holding period reflects the month of the first purchase and month of the final sale. Top-ups and top-slices may have occurred during the period.
The total gain/loss has been calculated by dividing the holding’s value plus any sale proceeds plus any dividends collected by the total amount invested.
This portfolio update contains further details.
Maynard Paton
