07 December 2018
By Maynard Paton
Update on Daejan (DJAN).
Event: Interim results for the six months to 30 September 2018 published 28 November 2018.
Summary: The commercial property group once again delivered record first-half revenue and net asset value (NAV) figures — despite the chairman’s persistent economic and political worries. The 203-word statement gave little else away, which has allowed the share price to continue to drift and the discount to NAV widen to 50%. Such a valuation has typically rewarded patient investors of this low-profile share, and I have recently bought more.
Price: £58
Shares in issue: 16,295,357
Market capitalisation: £945m
Click here to read all my DJAN posts.
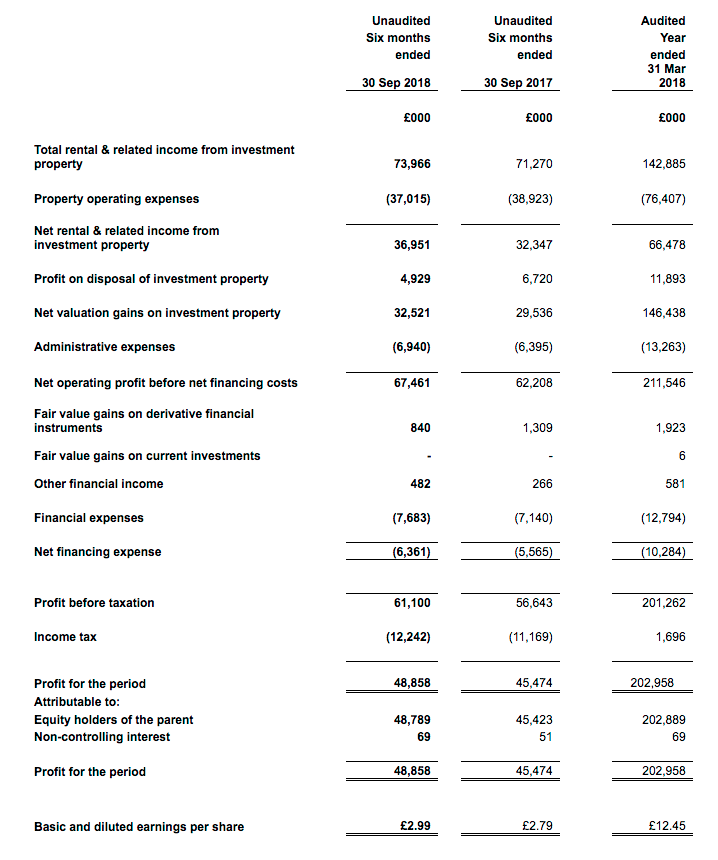
Results:
My thoughts:
* Completed development projects lift rents by 4% despite Brexit worries
These first-half results set new revenue and net asset value (NAV) records for DJAN, and were a little better than I had anticpated.
Total rental and related income gained almost 4%, and I was pleased the group’s larger UK division could improve its rents by close to 5%. The letting of completed development projects explained the greater income.

Chairman Benzion Freshwater once again reckoned Brexit was interfering with DJAN’s progress:
“Brexit continues to provide political and economic uncertainty which has led to reduced forecasts for economic growth. This combination of factors will provide a challenging environment for our UK business. In the USA the economic outlook is more encouraging and should provide a positive environment to grow our business.”
Nonetheless, DJAN still reported UK valuation gains of £33m during the six months, so it is not as if the value of the group’s property estate is dwindling. The gain represented a 2% advance on the £1.8bn UK valuation applied in March.
* Capex of £22m suggests opportunities for property development still exist
Favourable currency movements alongside the £33m valuation gain supported DJAN’s entire property estate increasing by £97m to almost £2.5bn during the six months.
The GBP:USD exchange rate moved from 1.40 to 1.30 between the start of April and the end of September, which helped lift DJAN’s US property valuation from £590m to £637m.
On the flip-side, the currency movement helped US liabilities increase by £31m and total debt increase by £17m. Net borrowings now stand at £274m but remain equivalent to only 11% of the property estate.
The UK valuation gain, the foreign-exchange movement and the earnings from rental income all came to an extra £73m, which extended NAV by 4% to £1,887m or £116 per share.
Elsewhere in the accounts, first-half cash generation remains somewhat unpredictable.
The full numbers were not disclosed within the RNS, but cash flow from operations came to £17m versus £25m for the comparable six months and £13m for the comparable six months before that.
Expenditure on the property estate continues apace, with £22m spent during this first half.
If this £22m is repeated during the second half, DJAN’s full-year capex will be the highest recorded since the £48m spent during 2014. Opportunities for property development therefore clearly exist despite the board’s worries about the economy and politics.
The greater capex kept a lid on the dividend. The first-half payout was maintained at 35p per share for the sixth year running.
Valuation
The £58 share price is equivalent to 50% of the latest £116 per share NAV.
Although the discount appears sizeable, these shares have rarely traded at close to NAV.
The SharePad chart below compares the share price (the black line) with the discount to NAV (the green line):
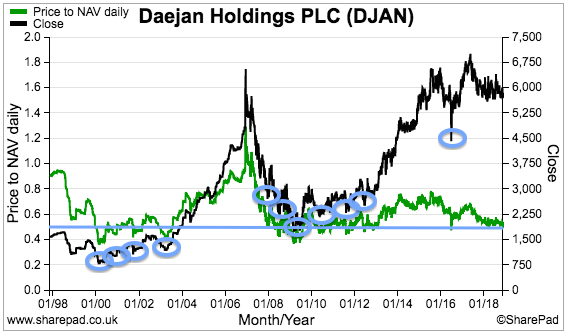
Investing at the current 50% discount — that is, when the green line falls to, or dips beneath, the straight blue line — has generally worked out well for investors. (The blue circles highlight previous buying opportunities at a 50% discount).
Reasons for DJAN’s persistent discount include the board’s 80% family shareholding, the management’s unconventional corporate governance, a total lack of communication with the City, and the complete absence of any takeover possibilities.
I am hopeful that, one day, the discount to book will permanently narrow as the group’s performance and size become too difficult for the wider stock market to ignore.
In the meantime, another way of looking at DJAN’s value is from a return on equity standpoint.
During recent 10-year periods, DJAN has earned at least 7.6% a year from its asset base:
| 10yrs to 2014 | 10yrs to 2015 | 10yrs to 2016 | 10yrs to 2017 | 10yrs to 2018 | |
| Start NAV (£) | 30.96 | 38.94 | 45.74 | 52.88 | 55.40 |
| End NAV (£) | 68.15 | 82.59 | 90.82 | 101.61 | 111.25 |
| Dividends accumulated (£) | 7.28 | 7.55 | 7.83 | 8.11 | 8.41 |
| Total return (£) | 44.47 | 51.20 | 52.91 | 56.84 | 64.26 |
| Total return/Start NAV (CAGR %) | 9.3 | 8.8 | 8.0 | 7.6 | 8.0 |
Assuming DJAN can earn an average of, say, 7.5% a year from its £116 per share asset base, typical annual earnings could be £8.68 per share — represented by a mix of rental profit and valuation gains.
In theory at least, enjoying £8.68 per share a year from a £58 entry price is equivalent to a very worthwhile 15% annual return.
Meanwhile, the trailing 103p per share dividend supports a modest 1.8% income.
This time last year, I wondered whether it was time to buy more DJAN shares.
I had made my initial DJAN purchase during 2015, and by last year NAV had since improved by 21% while the share price had barely moved.
Now NAV has increased by 36% following my original purchase, and the share price has still barely moved.
As such, I persuaded myself to increase my DJAN holding by 10% last month by buying shares at £57 including all costs.
Maynard Paton
PS: You can receive my Blog posts through an occasional e-mail newsletter. Click here for details.
Disclosure: Maynard owns shares in Daejan.

Thank you Maynard, I value your analysis of Daejan and Mountview.
Thanks Richard
Hi Maynard,
I have been reading your blog for some time now and enjoy all your work. My question to you is this: How much do you pay attention to the long term IRR of a stock when deciding, after looking at its fundamentals etc, to invest. If you take Daejan for example, if you had purchased this stock back in 1999 at approx £14.5 and held until today your IRR would be approx 8.36%. Do you weight this up in your overall decision process. I feel that this will continue at this rate into the future, give or take a percentage point. I am hoping to achieve 15% overall in my returns. Not that that has happened as of yet but that is my goal.
Look forward to your response.
Regards
Andrew A
Hi Andrew
Good question. I don’t really pay too much attention to the past IRR. I have not checked, but I guess shares with past IRR’s of 15%-plus may now be highly rated and their future IRRs may not be so great given their (likely) premium valuations. A lot of my best investments have been in shares that (very likely) showed modest past IRRs, but the underlying business improved and so did the share price and therefore the IRR.
I would concentrate more on working out with rough projections what needs to happen to earnings, dividends and the P/E multiple to get a 15% IRR over, say five years, and take things from there. A 15% compound return over 20 years = a 16.3x gain. Not easy to find such big winners, let alone stick with them without profit-taking. Bear in mind the last 20 years have not been great for the wider market. I think I would be happy enough buying DJAN (black line) in 1999 given the FTSE 100 performance (blue line)!
Maynard