21 September 2018
By Maynard Paton
Update on FW Thorpe (TFW).
Event: Preliminary results for the twelve months to 30 June 2018 published 20 September 2018.
Summary: The specialist lighting manufacturer delivered its fifth consecutive year of record results, although describing an underlying 2% profit advance as “excellent” overplayed the performance somewhat. Still, the figures were a touch better than I had expected and showcased all the usual financial attractions — decent margins, vast surplus cash and robust reinvestment returns. Sales of some new high-tech products apparently “rocketed”, too. That said, TFW suffered mixed divisional performances while the share-price rating remains rich. I continue to hold.
Price: 310p
Shares in issue: 115,966,044
Market capitalisation: £359m
Click here to read all my TFW posts.
Results:
My thoughts:
* Fifth consecutive year of record results — just
TFW’s first-half statement had already revealed a 1% profit advance and hinted the full-year outcome may not be that great (“It remains a challenge to maintain last year’s result.”).
So these annual figures were never going to show impressive progress, although the numbers turned out a little better than I had expected.
In the event, TFW managed to eke out its fifth consecutive set of record results — a performance the firm described as “excellent”.
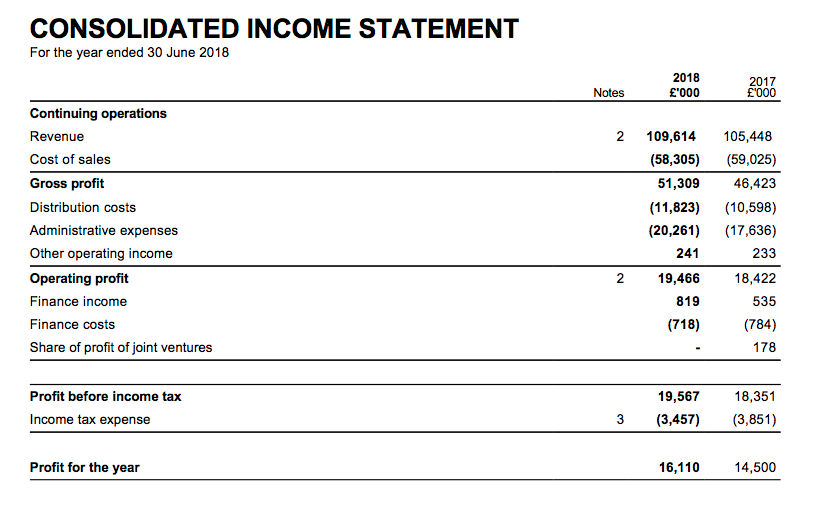
Revenue, profit and the dividend — raised for the 16th consecutive year — all now stand at new highs:
| Year to 30 June | 2014 | 2015 | 2016 | 2017 | 2018 |
| Revenue (£k) | 61,352 | 73,544 | 88,946 | 105,448 | 109,614 |
| Operating profit (£k) | 11,752 | 13,718 | 15,959 | 18,189 | 19,225 |
| Finance income (£k) | 763 | 727 | 75 | (249) | 101 |
| Other items (£k) | (93) | (303) | 235 | 411 | 241 |
| Pre-tax profit (£k) | 12,422 | 14,142 | 16,269 | 18,351 | 19,567 |
| Earnings per share (p) | 8.72 | 9.90 | 11.24 | 12.54 | 13.91 |
| Dividend per share (p) | 3.25 | 3.65 | 4.05 | 4.90 | 5.40 |
| Special dividend per share (p) | 1.50 | - | 2.0 | - | - |
Bolstered by the purchase of Dutch firm Famostar, revenue gained 4% and operating profit climbed 6%. Excluding the acquisition, the underlying revenue and profit advances were limited to less than 2%.
March’s half-year statement referred to certain products facing “pressure on selling prices”, but there was no similar reference within this update. Instead, the subdued performance was blamed largely on political factors:
“There is a general malaise in the UK market caused by a reduction in business confidence to invest in the construction sector and elsewhere as the country awaits Brexit and the return of political stability.”
Almost two-thirds of 2018 revenue was earned within the UK.
However, TFW did add:
“Over the last few years, we have actively divested and re-organised those parts of the Group that have not contributed for many years, either financially or technically, and which we felt had no long-term future within the Group.”
I get the impression the re-organisation of the group’s Compact Lighting subsidiary may have affected the overall top line.
Following years of minimal profits (and losses!), Compact was merged with TFW’s main Thorlux operation at the start of the 2018 financial year.
Compact’s turnover had run at £4m and — looking at the results small-print (see later) — I dare say the re-jig prompted some product lines to be culled.
* Mixed first-half/second-half splits although high-tech sales have “rocketed“
TFW’s first-half/second-half splits revealed some contrasting performances.
True, the Famostar purchase ensured total revenue and profit during H2 gained 4% and 8% respectively:
| H1 2017 | H2 2017 | FY 2017 | H1 2018 | H2 2018 | FY 2018 | ||
| Revenue (£k) | 51,236 | 54,212 | 105,448 | 53,170 | 56,444 | 109,614 | |
| Operating profit (£k) | 7,649 | 10,540 | 18,189 | 7,829 | 11,396 | 19,225 |
However, the group’s largest divisions did not enjoy the best of second halves.
Here is the split for Thorlux, TFW’s largest subsidiary:
| Thorlux | H1 2017 | H2 2017 | FY 2017 | H1 2018 | H2 2018 | FY 2018 | |
| Revenue (£k) | 31,470 | 33,853 | 65,323 | 32,298 | 32,347 | 64,645 | |
| Operating profit (£k) | 5,933 | 8,229 | 14,162 | 5,948 | 7,663 | 13,611 |
Second-half revenue fell 4% while profit fell 7%. Not great, although to be fair, Thorlux did enjoy a sensational 2017 and I did wonder six months ago whether the division’s H2 could repeat the H2 of the preceding year.
Bear in mind, too, that Thorlux’s 2018 numbers include the aforementioned Compact Lighting subsidiary — while the 2017 numbers do not.
Given Thorlux’s annual revenue stayed around the £65m mark, I am not exactly sure what has happened to Compact’s sales — which reached £4m during 2017 according to Companies House.
As I mentioned earlier, I suspect (or hope!) Compact’s turnover has mostly disappeared because the associated products never returned a profit and have been culled.
Anyway, I welcomed TFW’s remarks about Thorlux’s innovation:
“Latest developments, using the SmartScan platform, provide users with a building’s occupancy statistics by area and even provide data that analyses people movement, helping to improve a business’s efficiency, for example in a warehouse picking application to optimise product locations.
Our emergency lights now provide exact test records, even indicating the day and date when tests were completed and producing their own downloadable test certificates. Certain emergency lights are now capable of providing statistical data regarding their local environment, such as humidity, air temperature and CO2 concentration levels.”
TFW added (my bold):
“No wonder sales of these high-technology systems rocketed this year with new customers found and others switching to this new technology.”
* Small-print suggests new Famostar subsidiary set to report decent growth
The Lightronics division suffered a mixed H2:
Lightronics| H1 2017 | H2 2017 | FY 2017 | H1 2018 | H2 2018 | FY 2018 |
| |
| Revenue (£k) | 9,713 | 9,530 | 19,243 | 10,210 | 10,650 | 20,860 | |
| Operating profit (£k) | 1,104 | 1,268 | 2,372 | 1,102 | 948 | 2,050 |
Second-half revenue gained 12% while profit dived 25%. For the full year, revenue climbed 8% and profit fell 14%.
No clear detail was provided about the Dutch subsidiary. Certainly the performance did not really reflect the following management comment:
“General market conditions in the Netherlands seem good.”
Lightronics was purchased during 2015, and I note its operating margin has dropped from 15% that year to 14%, 12% and now to 10% for 2018. So what appeared initially to be a super acquisition has since moderated somewhat.
The H2 performance of TFW’s ‘Other’ companies was bolstered by the purchase of Famostar:
| Other | H1 2017 | H2 2017 | FY 2017 | H1 2018 | H2 2018 | FY 2018 | |
| Revenue (£k) | 10,053 | 10,829 | 20,882 | 10,662 | 13,447 | 24,109 | |
| Operating profit (£k) | 620 | 1,543 | 2,163 | 782 | 2,625 | 3,407 |
The results small-print said Famostar’s 2017 revenue and profit were €7.7m and €1.3m respectively, which translate to £6.8m and £1.15m at £:€1.13.
In comparison, I calculate Famostar generated sales and profit of £3.8m and £718k respectively during its first six months under TFW ownership.
As such, this new subsidiary appears set to report decent growth during the current year. Underlining the near-term potential, TFW said Famostar had joined the group in “top gear”.
* Cash conversion, proceeds from loans, operating margin and return on equity
TFW’s accounts remain in good shape.
Importantly, accounting profit continues to be converted into healthy cash flow:
| Year to 30 June | 2014 | 2015 | 2016 | 2017 | 2018 |
| Operating profit (£k) | 11,752 | 13,718 | 15,959 | 18,189 | 19,225 |
| Depreciation and amortisation (£k) | 2,708 | 2,772 | 3,800 | 3,999 | 4,595 |
| Cash capital expenditure (£k) | (3,560) | (4,892) | (4,307) | (7,286) | (7,819) |
| Working-capital movement (£k) | (3,101) | (3,151) | (909) | 1 | (241) |
| Net cash and investments (£k) | 37,378 | 31,941 | 36,942 | 45,678 | 48,167 |
Although total capital expenditure once again exceeded the deprecation and amortisation charged against earnings, past differences have generally been due to property purchases. Management confirmed that was again the case for 2018.
Furthermore, last year’s working-capital movement was minimal — as you would expect given the flat-ish profit performance.
One cash flow item I did not quite understand was ‘Proceeds from loans’:
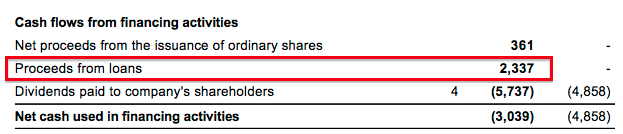
You see, the latest balance sheet does not show any liabilities for loans:
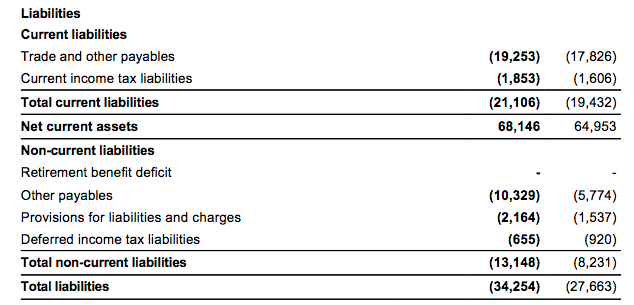
The whereabouts of these ‘loans’ is something to revisit when the full annual report is published.
Free cash flow came in at £12.9m, of which £6.3m was spent buying Famostar and £5.7m was distributed as dividends. A variety of miscellaneous income sources helped year-end cash improve by £2m to almost £44m.
Including TFW’s mix of investment property, loan notes and equity holdings, I calculate total cash and investments came to £56m.
Less the £10m earmarked for earn-outs relating to the Lightronics and Famostar purchases, net cash and investments were £46m or 40p per share.
I remain encouraged by TFW’s operating margin and equity returns:
| Year to 30 June | 2014 | 2015 | 2016 | 2017 | 2018 |
| Operating margin (%) | 19.2 | 18.7 | 17.9 | 17.2 | 17.5 |
| Return on average equity* (%) | 29.9 | 27.6 | 26.2 | 27.2 | 26.5 |
(*Adjusted for cash, various investments and Lightronics/Famostar earn-outs)
The 17% group margin hides the fact the main Thorlux division converts a decent 21% of revenue into profit.
Meanwhile, my return on average equity ratio — which ignores the group’s cash and investment hoard and adds back the Lightronics/Famostar earn-outs — remains very respectable.
Indeed, during the last five years, TFW has lifted its earnings by 5.8p per share after retaining earnings of 31.6p per share. The incremental return on those retained earnings comes to an appealing 18% (5.8p/31.6p).
Valuation
Using the 2018 operating profit of £19.5m and applying tax at the 18% seen in this annual statement, earnings come to almost £16.0m or 13.8p per share.
Then adjusting the present £359m market cap (at 310p) for the group’s net cash, investments and earn-outs, I arrive at an enterprise value (EV) of £313m or 270p per share.
Dividing the 270p per share EV figure by my 13.8p earnings guess gives a trailing P/E of nearly 20.
Meanwhile, the 10% dividend hike currently supports a tiny 1.7% dividend yield.
Certainly the present valuation appears rich for a business that has just squeezed out an underlying 2% profit advance.
But the following management quote suggests the business may have just ‘paused for breath’ rather than completely ‘run out of steam’ (my bold):
“There seems no end to our ideas and innovation, and I am really looking forward to the launch of a completely new range of luminaires this autumn… We have applied for several patents to protect our ideas. It is an exciting, albeit challenging, time to be running a group of lighting companies. If we can bring these new products to market quickly, I am confident it will give us a much needed boost to UK orders.”
Mind you, TFW did caution (my bold):
“Whilst we have strengthened the position of the Group by restructuring loss making operations, diversifying the business through acquisitions and investing in product innovation, this year’s excellent performance will be difficult to replicate as we contend with ongoing economic uncertainty, government instability and exchange rate volatility.”
The “difficult to replicate” phrase was also used last year, and I suppose another standstill performance should be expected for 2019.
For now, I can only cross my fingers that earnings can one day resume the bumper growth experienced between 2013 and 2017… before the share price starts to de-rate to a more modest P/E.
Still, I would not be unhappy if TFW’s near-term expansion rested upon further acquisitions.
The group has plenty of money on hand to find targets similar to Lightronics and Famostar, both of which offered reassuring, 70-year histories, reasonable price tags and specialist products (underlined by their revenue-per-employee ratios surpassing a sizeable €250k).
So far at least, TFW’s two Dutch deals have performed quite well.
Maynard Paton
PS: You can now receive my Blog posts through an occasional e-mail newsletter. Click here for details.
Disclosure: Maynard owns shares in FW Thorpe.

As always an excellent analysis of the TFW results, thanks Maynard
David
Thanks David.
FW Thorpe (TFW)
Publication of 2018 annual report
Lots to go through here.
1) Thorlux
The collapse of Carillion appears to have dented Thorlux’s progress:
Management said sales of SmartScan had ‘rocketed’ in the results RNS, but this report says sales were £14m — and last year’s report said sales were £7m. So sales did indeed rocket. This SmartScan system currently represents 13% of total revenue, and I hope this new system can help push group sales further.
2) TRT
TRT was spun out of Thorlux a few years ago because of its growing success. However, current talk within the division is of price competition and a lack of tunnel work:
I dare say the “Price changes” risk (see below) relates to TRT.
3) Lightronics
I noted in the Blog post above that growth at the Lightronics division had appeared to have moderated. The need to cross-sell Thorlux products “to see growth this year” underlines the division’s more modest prospects:
Famostar, the latest Dutch acquisition, was “discovered” by management at Lightronics and not management at TFW:
4) Portland
An interesting snippet:
For 2017, Companies House shows sales of £3.5m and a near £1m profit — so a 29% operating margin. Nice.
5) Risks
Three risks were increased during the year:
“Price changes” probably relates to TRT (see above).
I bet the other two risks are related.
6) Corporate governance
Similar to Bioventix and Tristel of late, TFW has adopted a corporate governance code. The adoption follows a new rule set by the stock exchange):
TFW is partially compliant on two code principles:
The performance of TFW over time does not suggest there is anything too untoward with the current board set-up.
7) Employees
TFW’s 2018 employee ratios could not match those of 2017:
Revenue per employee dropped from the record £165k of 2017 to £152k for 2018 — as 81 new staff joined while revenue gained only £4m. Employee costs as a percentage of revenue — at 27.6% — could not match the sub-27% for 2017 and 2016. However, up until 2016, the figure had generally been 28%-plus. Average employee cost is now £42k, down £2k from 2017.
8) Director pay
Hmmm…chunky 10%-plus pay rises all round for the board:
Perhaps the extra pay was to compensate for taking on the executive responsibilities of Andrew Thorpe, who became a non-exec at the start of the year.
Bonuses look generous, too, given my estimate of underlying profit gaining only 2%. All told, pay looks reasonable for a business of this size, but I will not be impressed if pay/bonuses continue to inflate when the underlying business is just inching ahead.
9) Accounting changes
Nothing expected here:
10) Intangible assets
Excluding acquisitions, development costs are TFW’s largest intangible expenditure:
I am pleased the associated amortisation is close to the actual cash expenditure.
I note the write-offs, too. These are not insignificant and appear to be written off straight to the income statement.
Fishing rights must be a unique intangible asset among quoted companies.
11) Investment property
TFW’s investment property earns £131k rent from a £2,271k original cost — so a fair 5.8% yield:
12) Freeholds
Not as relevant as it once was when TFW’s market cap was much smaller, but TFW freeholds remain in the books either at cost or a revaluation performed (probably) 30 or more years ago:
13) Available-for-sale assets
TFW continues to dabble with certain UK shares:
The portfolio enjoyed a 5% return last year.
14) Trade receivables
Year-end trade receivables as a proportion of revenue increased from 16.3% to 19.8% during 2018:
Looking back, 2017 appears to have been very favourable and 2018 returned to normality for this ratio. Between 2010 and 2016, year-end trade receivables as a proportion of revenue were 20% or more six years out of seven. So, TFW’s customers continue to pay in line with historical norms.
15) Trade and other payables
I mentioned in the Blog post above about “proceeds from loans” of £2,336k being received — and not understanding its whereabouts on the balance sheet.
The explanation is here:
The loan seems to be money borrowed from a Dutch firm. I can only assume this money has something to do with Lightronics, Famostar or both. Anyway, it is lumped together with potential earn-out payments relating to the Dutch acquisitions and is already incorporated into my valuation sums within the Blog post above.
16) Pension scheme
No major issues here:
The returns from assets of almost £40m plus contributions of £633k should easily be able to pay annual benefits of £1.4m or so. (Read Some Thoughts On Pension Deficits for more information).
I am not surprised that only a modest increase to TFW’s scheme contribution is required:
17) Loans and receivables
TFW has various IOUs outstanding:
A new loan was issued to the owner of former subsidiary Mackwell, while a loan appears to have been called in at former subsidiary Sugg. Throw in the Dutch loans and the total comes to £6m still to be paid back.
Maynard
FW Thorpe (TFW)
AGM statement
I am catching up with this statement that was issued on 22 November.
Oh dear — an AGM profit warning. Here is the full text:
———————————————————————————————————————-
“Last financial year we achieved another set of record results but my September statement referred to the challenges in maintaining these for the current financial year. Orders for our main business, Thorlux Lighting, were slow in the first quarter but have started to recover in October and November. Whilst other parts of the Group continue to perform well, we presently expect the interim results for the Group to be lower than the same period last year, with operating profit around ten percent lower.
At this time, it is difficult to accurately predict second half performance, but we are unlikely to close the gap and the full year results are likely to be lower than last year. We have already taken mitigating steps with the closure of our Portsmouth manufacturing facility and other headcount reductions and we will see these cost benefits in the second half of the financial year.
As cautioned during my recent Annual Report statement, the UK lighting industry, as a whole, is experiencing a downturn resulting in challenging trading conditions. We will continue to drive the business for the long-term in spite of the current political, economic, and market headwinds, by continuing to invest in product development and considering acquisition opportunities where appropriate”.
———————————————————————————————————————-
Perhaps not a complete surprise given the mixed trading reviewed in the Blog post above. In particular, slow trading at Thorlux during the first quarter followed the weaker second half I mentioned in my results review.
My study of the annual report in the Comment above suggested the demise of Carillion and the knock-on effect within the construction sector had affected Thorlux. I do not get the impression TFW’s woes are due to losing ground to the competition.
Assuming full-year operating profit falls 10% as per TFW’s projection for the current first half, then my earnings guess drops from 13.8p to 12.4p per share. A share price of 260p therefore equates to P/E of 18 adjusted for the 40p per share of cash and various investments. My multiple is not cheap for a share that is undergoing an earnings wobble.
Maynard