28 March 2018
By Maynard Paton
Update on S & U (SUS).
Event: Preliminary results and presentation for the year to 31 January 2018 published 27 March 2018
Summary: These results from the car-loan specialist once again provided an investment dilemma. True, shareholders received yet another respectable progress report from the accomplished executive team. However, the finer details showed potential bad debts soaring 59% — which was double the growth rate of revenue and customer advances. The chairman is set to make some ‘sensible gear changes’ to keep a lid on potential bad debts, but until the changes become evident, the share-price multiple could be stuck at 13. I continue to hold.
Price: 2,300p
Shares in issue: 11,990,159
Market capitalisation: £276m
Click here to read all my SUS posts
Results:
My thoughts:
* Advantage SUS! Celebrating 18 consecutive years of car-loan profit growth
September’s interim statement followed by trading statements during December and February had already suggested these full-year results would be very respectable.
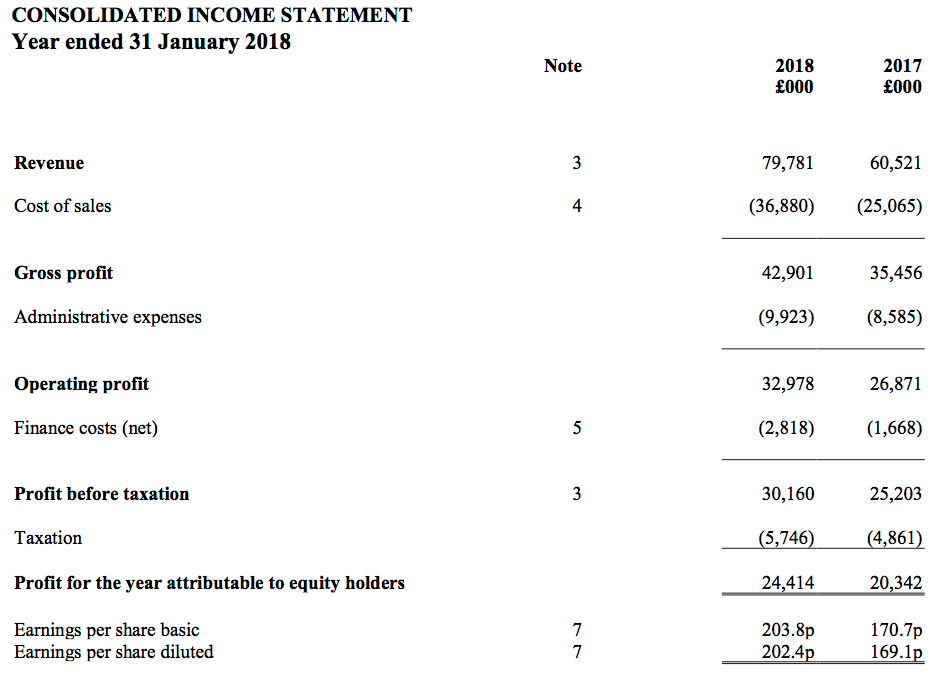
The headline figures showed revenue up 32%, operating profit up 23% and the dividend up 15%, and every measure set a new all-time high. The numbers also marked the 18th consecutive year of growth for SUS’s Advantage Motor Finance division.
(Following SUS’s disposal of its doorstep lending subsidiary during 2015, the group’s operations now are almost entirely related to Advantage):
| Year to 31 January | 2014* | 2015* | 2016* | 2017** | 2018** |
| Revenue (£k) | 26,147 | 36,102 | 45,182 | 60,521 | 79,781 |
| Operating profit (£k) | 12,655 | 18,922 | 23,643 | 26,871 | 32,978 |
| Other items (£k) | - | - | - | - | - |
| Finance cost (£k) | (1,186) | (2,207) | (3,243) | (1,668) | (2,818) |
| Pre-tax profit (£k) | 11,469 | 16,715 | 20,400 | 25,203 | 30,160 |
| Earnings (£k) | 8,897 | 13,271 | 16,320 | 20,342 | 24,414 |
| Earnings per share (p) | - | - | - | 170.7 | 203.8 |
| Dividend paid (£k) | 2,600 | 3,500 | 4,700 | 9,548 | 11,377 |
| Dividend per share (p) | - | - | - | 91.0 | 105.0 |
(*Advantage Finance, **Group)
The 2018 performance was underpinned by Advantage receiving some 860,000 loan applications (up 15% on 2017), and agreeing to approximately 24,500.
The number of active customer loans advanced by around 11,000 to 54,000, while the year-end value of outstanding customer loans climbed 30% to £251m.
* Impairments set to be controlled by ‘sensible gear changes, steering tweaks and an easing of the accelerator’
Greater revenue, greater profit and greater customer loans were also accompanied by greater a bad-debt provision. Sadly the finer impairment details remain unfavourable.
Here is a crucial accounting note:
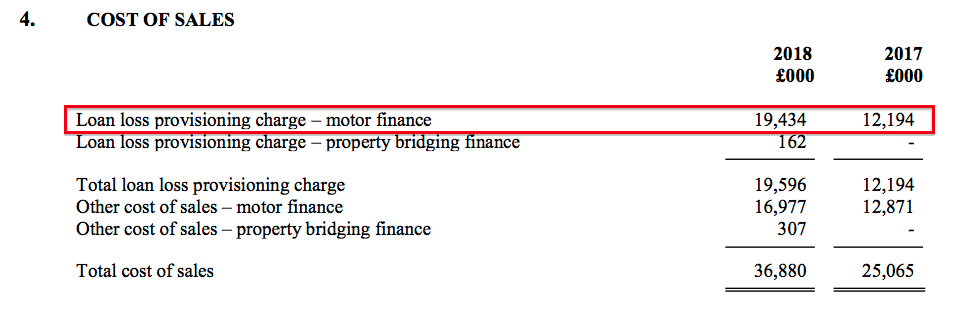
The ‘loan loss provisioning charge – motor finance’ jumped 59% for the full year — much more than the aforementioned 32% revenue gain and 30% customer-loan increase.
For the previous 2017 year, the impairment charge surged 60% versus a 34% revenue gain and 33% customer-loan increase.
This table compares the 2018 impairment ratios to those of the previous four years:
| Year to 31 January | 2014 | 2015 | 2016 | 2017 | 2018 |
| Motor | |||||
| Loan provision (£k) | 5,087 | 5,863 | 7,611 | 12,194 | 19,434 |
| Revenue (£k) | 26,147 | 36,102 | 45,182 | 60,521 | 78,882 |
| Average net customer receivables (£k) | 62,734 | 89,678 | 125,764 | 169,335 | 222,372 |
| Loan provision/Revenue (%) | 19.5 | 16.2 | 16.8 | 20.1 | 24.6 |
| Loan provision/Average net customer receivables (%) | 8.1 | 6.5 | 6.1 | 7.2 | 8.7 |
The ratios are the highest since 2013.
As before, SUS’s veteran management did not appear too concerned about the movements. Executive chairman Anthony Coombs said (my bold):
“For some customers who have sought to maintain living standards by taking new lines of credit, this has reduced capacity and been reflected in a rise in impairment to £19.4m this year. At 24.6% of revenue this is still relatively low versus the average for the previous 10 years of 27.2%.
Further, 18 successive years of profit growth and operational refinement have given Advantage the experience and wisdom to make timely and targeted adjustments to its already sophisticated and sensitive under-writing model.
In motoring terms, the shape of the road and the nature of the terrain has made for sensible gear changes, steering tweaks and an easing of the accelerator…
Early signs of the under-writing changes already made are having a beneficial effect upon both new customer quality and early repayment performance, which we anticipate will lead to a reduction in impairment to revenue in due course.”
I can only hope Mr Coombs’ descriptive analogies can indeed lead to the impairment-to-revenue ratio reducing.
This chart from the results presentation puts the current impairment-to-revenue ratio (the red line) into perspective:
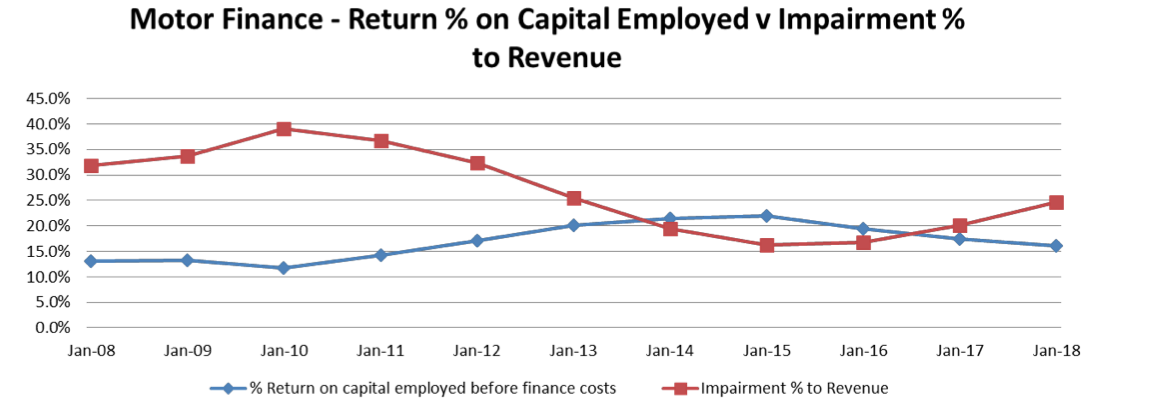
Perhaps 2015 and 2016 should be seen as exceptionally favourable years, rather than 2018 being seen as rather unfavourable.
* Presentation slide shows further evidence of the adverse impairment trend
The first-half/second-half split showed impairments running at a greater rate during H2 than H1:
| H1 2017 | H2 2017 | FY 2017 | H1 2018 | H2 2018 | FY 2018 | ||
| Group | |||||||
| Revenue (£k) | 28,283 | 32,238 | 60,521 | 37,556 | 42,225 | 79,781 | |
| Operating profit (£k) | 12,579 | 14,292 | 26,871 | 15,427 | 17,551 | 32,978 | |
| Motor | |||||||
| Revenue (£k) | 28,283 | 32,238 | 60,521 | 37,556 | 41.326 | 78,882 | |
| Loan provision (£k) | 4,959 | 7,235 | 12,194 | 8,591 | 10,843 | 19,434 | |
| Average net customer receivables (£k) | 159,528 | 183,722 | 169.335 | 210,168 | 239,011 | 222,372 | |
| Loan provision/Revenue (%) | 17.5 | 22.4 | 20.1 | 22.9 | 26.2 | 24.6 | |
| Loan provision/Average net customer receivables (%) | 6.2 | 7.9 | 7.2 | 8.2 | 9.1 | 8.7 |
Although the ratios for H2 do remain below the levels seen before 2014, the calculations are further evidence of write-offs continuing to travel the wrong way.
SUS’s presentation slides also confirmed the lower-quality loan book.
This slide indicates the proportion of up-to-date loans decreasing from 87% to 83%:
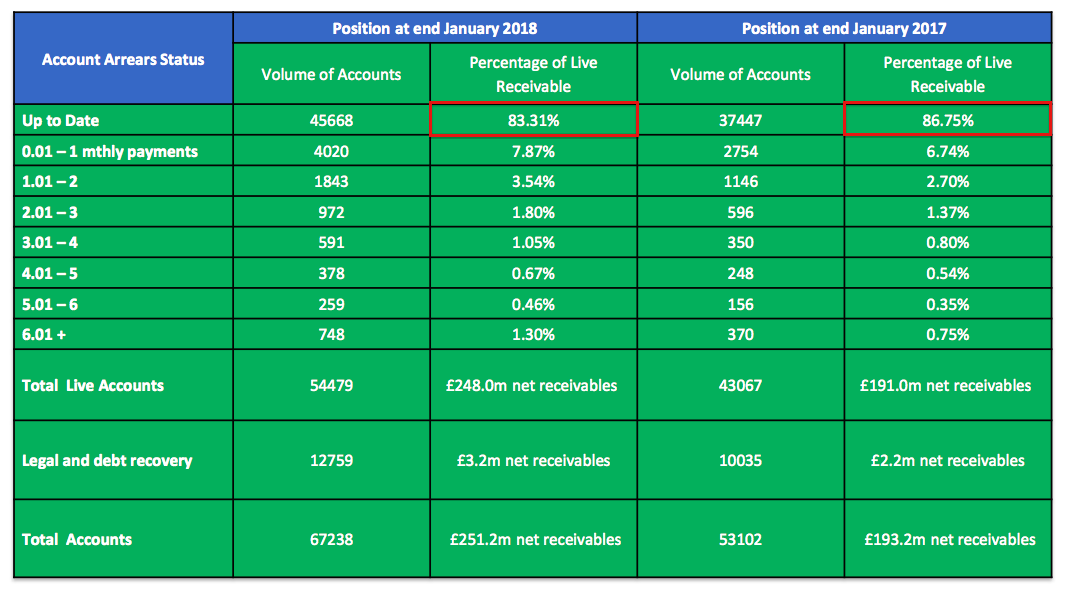
The proportion was 91% at January 2016.
* The margin has to be high and the debt has to considerable to generate a respectable return on equity
The upshot of the growing impairments was the operating margin coming in at 41% — versus 44% for 2017 and 47% for 2016.
While SUS’s operating margin remains extremely healthy compared to that seen at most businesses, a high level of profit is required to generate an acceptable return on the equity that supports the business.
I calculate SUS earned a respectable 17% (£24m) return on the average £146m of equity the group employed throughout the year. The return compares to approximately 15% produced during the prior two years.
However, the 17% return was assisted by significant debt — net borrowings increased from £49m to £105m during the period — and adjusting my sums for the loans and associated interest reduces the return to a modest 12%. That number compares to approximately 13% produced during the prior two years.
That earlier slide from the presentation is informative:
The blue line tracks the return on capital figure for the Advantage division, and the slideshow small-print admits the lower ROCE reflects “loss of insurance income since July 2015 and [a] high deal acquisition cost”.
Each new deal agreement cost SUS £692 during 2018 — up 8%. Five years ago the cost was £581.
Anyway, I presume the difference between the 15% shown in the slide and my 12% guess is due to me using the overall group numbers, which include extra central costs (such as director wages) and a fledgling property-loan operation.
Elsewhere in the accounts, SUS’s cash flow continues to be relatively straightforward.
Earnings of £24m and extra debt of £56m went towards injecting a net £68m into new customer loans, allowed £11m to be paid as dividends, and left £1m to be spent on everything else.
At least the rate on SUS’s debts appears to have been chipped lower again. I reckon SUS paid 3.5% on its borrowings during 2018, versus 3.9% and 4.2% for 2017 and 2016 respectively.
Valuation
SUS has consistently generated annual revenue at approximately 35% of its net customer loans. I therefore hope the £251m currently outstanding from the firm’s car-loan customers can convert into near-term revenue of £89m.
Applying a 26.2% loan-loss provision as seen during the second half, and assuming other cost of sales and admin expenses represent 21.5% and 12.1% of revenue respectively, I arrive at a possible operating profit of £36m.
Taxed at the 19% standard UK rate, potential operating earnings could therefore be £29m or 242p per share.
Adding net debt of £105m to the £276m market cap (at 2,300p per share) gives an enterprise value (EV) of £381m, or 3,176p per share.
The P/E based on my EV and earnings guess is therefore 3,176p/242p = 13.
That rating looks very reasonable given SUS’s recent growth rate. Mind you, the rising impairment levels are difficult to ignore. I suspect the wider market may have trouble applying a higher multiple to SUS’s earnings until the bad-loan provisions start to moderate.
In the meantime, all shareholders can do is trust the seasoned Mr Coombs has everything under control — and enjoy a 4.6% income from the 105p per share dividend.
For what it is worth, Mr Coombs remains bullish (my bold):
“Whatever the wider political or economic headwinds, the markets in which we operate remain strong. Recent data from the Finance and Leasing Association showed used car sales increased by 6% in number and 12% in value in 2017 whilst the UK property market remains robust. This combination of healthy market conditions, a strong demand for our products and our focus on quality, lead us to look ahead with real confidence.
I commend these results to our shareholders.”
Maynard Paton
PS: You can now receive my Blog posts through an occasional e-mail newsletter. Click here for details.
Disclosure: Maynard owns shares in S & U.

S & U (SUS)
Publication of 2018 annual report
A few points of interest:
1) Additional snippets on the used-car market:
The volume size of SUS’s market is 700,000 vehicles per annum:
With 24,500 loans issued last year, SUS’s market share could be seen as 3.5%.
The 2017 used-car market did not quite match the figures of 2016. The estimated number of used cars sold decreased by 90,000 to 8.11 million, of which 1.1 million (versus 1.2 million for 2016) were bought using finance. The size of the used-car market remains approximately £12 billion.
2) The aggregation of marginal gains
I quite like this quote from the man in charge of Advantange Finance, SUS’s largest division:
3) New third pillar of Advantage’s success
SUS has previously presented three pillars to Advantage’s success:
1) A buoyant used-car market
2) A commitment to excellence
3) A ‘steady, sustainable growth’ business philosophy
The third pillar has been revised to “a proven ability to adapt to a changing economy and labour market“:
The old third pillar has now become the “over-arching factor in the success of the business“:
4) Operational tweaks could improve margins and return on capital
The following remarks underlined the comments within the initial results RNS that under-writing refinements could reduce the risk of bad loans:
5) Complaints
An interesting note:
It appears most customer complaints related to the quality of the car than the T&Cs of the loan. That said, 100-plus complaints that actually make it to the Ombudsman does seem high. It would be useful to discover the types of complaint that are decided against SUS.
6) Shadow share options
It appears the boss of Advantage has been dangled a lucrative ‘shadow share-option’ carrot to defer his retirement for a few years:
Two batches of 12,000 shares at the recent £23 price = £552k. I would say this scheme will be worth if it Advantage continues to progress as it has during the last few years. The obvious question now is who is in line to replace the current Advantage boss when he does retire.
7) Profit target not met but some bonuses were paid anyway
The execs just missed their profit target:
The Coombs brothers did not collect a bonus. But the table below shows the other execs did…
8) Director pay
I still feel having 3 directors on £300k-plus looks a tad excessive for the size of this business:
JG Thompson, who is the boss at Advantage Finance, saw his annual pay gain 11%. He remains the highest paid director — a fair reflection of his status in the group in my view.
Note the bonuses paid in the table, despite the profit-target miss. Given the very small target shortfall and the general performance of the group, it would be churlish to complain.
Some pay rises are due for 2019, too:
10) IFRS9
The effect of a new accounting standard needs to be considered:
The note suggests a “small reduction in the carrying value of receivables” of between 1% and 2%. That does not sound too ominous, given net receivables stand currently at £262m and the initial effect will be a £3m to £5m charge. What is not clear, though, is the ongoing effect of IFRS9 on the loan-loss provision passing through income statement.
IFRS9 will have no bearing on cash flow, so what counts ultimately is still SUS’s customers actually paying back what they owe. But the accounting re-jig (which looks unfavourable) may concern some investors when the next numbers appear.
11) Loan loss provision
This is probably the most important note in the accounts:
The note compares the loan-loss provision charge (essentially bad debts) within the income statement to the amounts actually written off (as well as against an adjustment for the discount rate applied to estimated future loan losses):
The difference between the loan-loss provision charge (£19,434k) and the combination of the write-off (£3,298k) and the discount unwind (£2,428k) is £13,708k — more than double the £6,475k of 2017, which was itself more than double the £2,926k for 2016.
Write-offs for 2017 at £3,298k compare to about £3,000k for 2017 and £2,000k recorded annually between 2012 and 2016. And yet the loss-loan charge for 2018 is up to £19,434k from £12,194k for 2017 and between £5,000k and £8,000k for between 2010 to 2016.
I could be wrong, but I still hold the view that there is some conservative reserving going on here — and I trust the increase to the loan-loss charge is not going to herald huge future write-offs.
At present the full loan-loss reserve stands at a sizeable £44,462k, which essentially reflects the cumulative amount already charged against past earnings for bad debts that have yet to occur.
11) Interest rates
Once again the business charges its customers 31% a year, and pays its lenders 4%:
Maynard
S & U (SUS)
AGM Trading Update
The statement issued on Friday (18 May) did not read too badly.
Applications for loans at the main Advantage motor-finance division now run at c960k a year, versus the 860k applications received during the 12 months to January 2018.
Successful applications continue to represent about 3% of all applications.
Net motor-finance receivables have advanced by £7m to £258m since the January year-end. Customer numbers have advanced by 2,000 to 56,000.
For the group, impairments currently run at 25.8% of revenue — versus 22.9% during H1 and 25.7% during H2. So there has been a modest increase to write-offs versus H2, but not as dramatic as the increase from H2 to H1.
I am hopeful the impairment percentage can reverse at some point. SUS said:
“New customer quality and early repayment performance continues to improve and we anticipate this will lead to a reduction in impairment to revenue in due course.”
Here is the full text:
——————————————————————————————————————
S&U, the motor finance and bridging lender, issues a trading update for the period 1 February 2018 to 17 May 2018, prior to its AGM being held today.
Trading at Advantage Finance, S&U’s motor finance business, remains strong following previous record expansion of both customers and receivables. We continue to focus on debt quality which will underpin the consistency and sustainability of anticipated future profits. New loan transactions during the period were at similar levels to last year’s record performance.
Loan applications have reached record levels of over 80,000 per month, of which c.25% are accepted and c.10% of acceptances are transacted. The successful introduction of Advantage’s paperless Dealflo system has been well received by customers, improves service and allows a greater focus on quality whilst maintaining comparable volumes year-on-year. Advantage’s net receivables book has grown to £258m, which comprises over 56,000 customers, an increase of 21% on last year.
Although rolling 12 months impairment to revenue has increased slightly to 25.8% versus 24.6% at year-end, this is still comfortably within the average for the previous ten years of 26.4%. New customer quality and early repayment performance continues to improve and we anticipate this will lead to a reduction in impairment to revenue in due course. April’s monthly collections increased by 22% to £11.4m compared to the same month last year.
Our bridging finance pilot, Aspen Bridging, continues to confirm our confidence in its launch. Aspen’s net receivables book has increased to £14m from £11m at year-end, with early repayments on track. Aspen’s current profitability and growing reputation amongst its broker partners bodes well for a successful future. We look forward to updating the market with a full report on future plans for Aspen in H2 2018.
Demand for the Group’s products and the quality of our businesses is reflected in a further £8.5m investment in the first quarter, taking Group borrowing to £113.5m. An additional £20m of banking facilities arranged in the period brought total committed facilities to £135m and provides headroom for further expansion.
Commenting on S&U’s trading and outlook, Anthony Coombs, S&U Chairman, said:
“Despite a slowing UK economy, the value used car and residential markets in which we operate remain strong and resilient. Our continuing focus on customer selection and excellent service gives us great confidence for sustainable future growth.”
——————————————————————————————————————
Using net receivables of £258m instead of £251m for my Valuation sums within the Blog post above, I arrive at earnings of 248p per share.
Then using net debt of £113.5m (as per this latest trading statement) instead of £105m, I arrive at an enterprise value (EV) of £437m, or 3,647p per share with the share price at £27.
The P/E based on my EV and earnings guesses is therefore 3,647p/248p = 14.7.
Maynard
PS: Here is a useful video with the SUS boss discussing the 2018 results.
S & U (SUS)
Trading Update
Not too much has changed since May’s update. During the intervening 2.5 months, customer numbers have advanced by c2,100 while next receivables (the amount customers owe) has climbed by £5m to £263m.
Note that completed transactions now account for 9% of 25% of all applications = 2.25%. May’s statement indicated 10% of 25% = 2.5%, while this time last year the application-to-acceptance ratio was 10% of 31% = 3.1%. So SUS appears to becoming pickier with its prospective clients.
I quite like this line:
“On debt quality, although impairment continues to run at higher levels than last year, recent underwriting refinements have led to early indications of an improvement in both new customer quality and early repayment performance.”
I am hopeful that write-offs can reduce. The loan loss provision was 26% of revenue during last year’s H2, and I will be keen to discover what the latest percentage is within the forthcoming H1 results.
Here is the full text:
—————————————————————————————————————
S&U plc, the motor finance and property bridging specialist, today issues a trading update for the period from its AGM statement of the 18 May to the 31 July 2018. It will announce half year results for the period ended 31 July 2018 on the 25 September 2018.
Trading
Against a background of a strong UK labour market albeit in a slowing economy, Advantage Finance, our motor finance subsidiary, continues to trade well with profits again at record levels. Whilst the new car market may have slowed, recent Finance and Leasing Association data shows the used car finance market we serve has been growing by 12% year on year. This is reflected in the recent average of over 80,000 monthly finance applications received by Advantage Finance.
However, following recent rates of expansion, a prudent focus on quality has seen acceptance levels tighten to 25% of applications (H1 2017: 31%), of which completed transactions comprise 9% (H1 2017: 8%).
This selectivity is consistent with both Advantages’ emphasis on customer affordability and with our long-term strategy of sustainable growth. Customer numbers now stand at a record 58,100, 18% up on last year, and net receivables have now reached £263.0 million, up 15% on last year (H1 2017: £228.6million).
On debt quality, although impairment continues to run at higher levels than last year, recent underwriting refinements have led to early indications of an improvement in both new customer quality and early repayment performance. Overall monthly collections in H1 2018 are 20% up on H1 2017 and are now approaching £12million per month.
Aspen Finance, our property bridging business, continues to build both its market reputation and profitability. It recently won New Product of the Year at the Bridging and Commercial industry awards. Debt quality, as reflected in its repayment performance, is good. Its loan book now exceeds £16million from £11million at year end.
Commenting on the Group’s trading and outlook, Anthony Coombs, S&U chairman, said:
“Advantage Finance maintains its remarkably reliable record of continued profitable growth over the past nineteen years in a variety of macro-economic conditions. Improvement in product, customer service and in underwriting strengthens their ability to build on this in years to come.
Aspen Bridging, our new bridging lender, has made a promising debut and is now profitable.
Both businesses give me every confidence that S&U will continue to deliver consistent improvements in shareholder value.”
—————————————————————————————————————
Using net receivables of £263m instead of £251m for my Valuation sums within the Blog post above, I arrive at earnings of 253p per share.
Using net debt of £113.5m (as per May’s trading statement), I arrive at an enterprise value (EV) of £413m, or 3,447p per share with the share price at £25.
The P/E based on my EV and earnings guesses is therefore 3,447p/253p = 13.9.
Maynard