01 January 2019
By Maynard Paton
Happy 2019! I hope you coped well with last year’s rough market and that you continue to find my Blog useful.
The major development for me during 2018 was starting to write articles for SharePad. No longer can I call myself a full-time investor who has no other income than capital gains and dividends!
Nevertheless, I do continue to depend upon my dividends — so I am still a full-time-ish investor.
For the time being at least, I do not have to think too much about capital gains… which is just as well given the recent market downturn.
Since I joined SharePad, traffic to this website has grown significantly. The best measure of interaction — my newsletter mailing list — has advanced by 62% since September. (At least something increased last year!)
My contact form has been busy, too. I thought you might like to know about the following recent requests:
- Participate in a ShareSoc Masterclass (done)
- Give a talk to an investment group (accepted)
- Participate in some investment podcasts (not sure)
- Help establish other investing websites (not sure, probably unlikely)
- Write an investment book (very unlikely)
- The usual guest Blog-post enquiries (ignored)
The irony with the increasing Blog interest is that my investing performance of late has been far from spectacular.
Following a bumper 2014 and a bumper 2015, I under-performed the market during both 2016 and 2017. For 2018, I have out-performed… but only by losing less money than the index.
My returns have therefore been somewhat variable, and admittedly disappointing during the last few years.
But at least you know how my portfolio has performed. Not every investment writer/blogger/tweeter reveals their progress!
Anyway, let’s catch up with the latest quarter and then my 2018 performance.
I bought more Daejan and Mountview during Q4
You may already know from my Blog that I publish a portfolio review after every quarter (Q1, Q2 and Q3).
I will now recap my October/November/December activity.
I made two top-ups during Q4.
I increased my Daejan holding by 10% at £57 including all costs. The commercial property group revealed its net asset value (NAV) had climbed to £116 per share, and yet the share price has continued to drift and allowed the discount to NAV to widen to 50%. Such a valuation has typically rewarded patient investors of this low-profile share.
I increased my Mountview Estates holding by 20% at £98 including all costs. The regulated-tenancy landlord recently declared an NAV of £92 per share, although my sums suggest the firm’s assets may be worth more than £200 per share. Furthermore, a yield of 4% seemed attractive based on historical valuations.
As usual, I have kept an eye on all of my existing holdings — trying to spot buying opportunities just in case.
The Q4 developments are summarised below:
- Acceptable news from Mountview Estates and Tristel;
- Mixed developments at Castings, City of London Investment, S & U and System1;
- Just-about-acceptable-in-the-dire-circumstances progress at Tasty, and;
- Nothing from Andrews Sykes and M Winkworth.
I have written a full review of all the shares I held during 2018 — simply click here for the complete run-down.
Now to my 2018 performance
I always like to study my portfolio’s performance at the start of every year.
You see, I am keen to discover where all my gains (and losses!) occurred during the previous twelve months. I also want to check whether my portfolio decisions have become consistently good, bad or indifferent.
Here are my performance ground-rules:
- My portfolio weightings and returns are calculated using quoted bid prices from ADVFN;
- All dealing costs, withholding taxes, broker-management charges and paid dividends are included;
- My benchmark is the FTSE 100 total return index (that is, the FTSE 100 index with dividends reinvested, as recorded by SharePad).
(Note: I compare my portfolio against the FTSE 100 total return index as this index is the main UK benchmark and I would invest in the FTSE 100 were I to give up stock-picking and become a passive investor. The FTSE 100 total return index does not include any costs.)
The chart below compares my portfolio’s weekly 2018 progress (in green) to that of the FTSE 100 total return index (in blue):
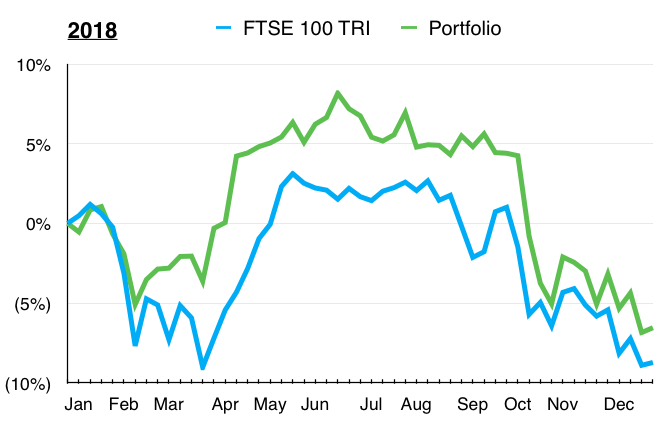
I finished down 6.6% versus down 8.7% for my benchmark.
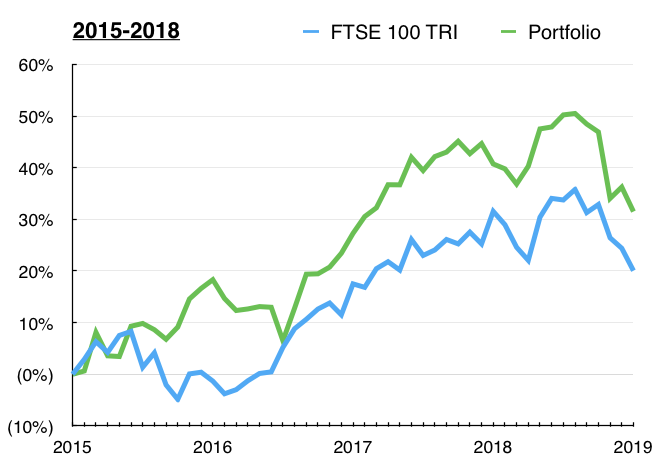
The next chart compares my portfolio’s monthly progress to that of the FTSE 100 total return index. The chart commences at 2015, which coincides with me quitting the 9-to-5 to become a full-time-ish investor:
My portfolio’s annual returns since 2012 are summarised below:
| Year | My Portfolio | FTSE 100 TRI |
| 2012 | 46.1% | 10.0% |
| 2013 | 29.1% | 18.7% |
| 2014 | 16.0% | 0.7% |
| 2015 | 18.3% | (1.3%) |
| 2016 | 7.6% | 19.1% |
| 2017 | 10.5% | 11.9% |
| 2018 | (6.6%) | (8.7%) |
| Compound return | 187.7% | 57.8% |
You can see my yearly performances have reduced over time. I have learnt:
- not having a regular salary to easily average down, and;
- thinking too much about withdrawing capital for living expenses
…have curbed my gains.
At least I avoided a hat-trick of annual under-performances. As you will see, a handful of decent winners could not offset a number of losers.
How my portfolio changed during 2018
Just to confirm, during 2018:
- I did not buy any new holdings;
- I topped up four holdings (Daejan (Q4), Mountview Estates (Q4), System1 (Q3) and Tasty (Q1));
- I sold one holding entirely (Record (Q2));
- I did not top-slice any holdings, and;
- I left eleven holdings untouched (Andrews Sykes, Bioventix, Castings, City of London Investment, Getech, Mincon, M Winkworth, Oleeo, S & U, FW Thorpe and Tristel).
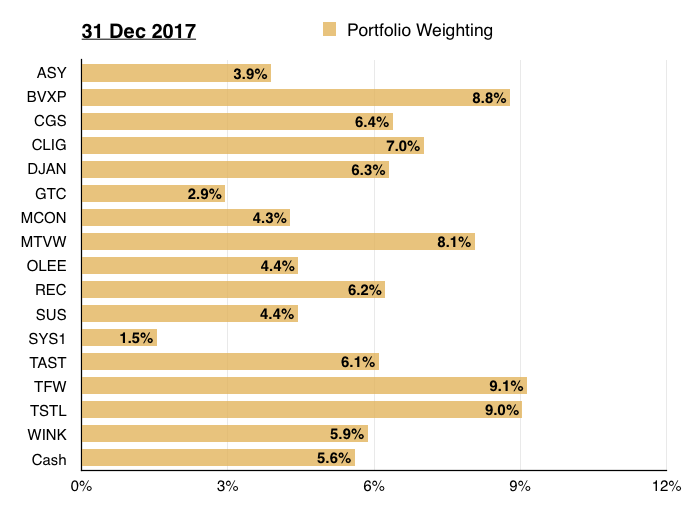
This next chart shows my portfolio’s holdings and their weightings at the end of 2017…
…while this chart shows my portfolio’s holdings and their weightings at the end of 2018:
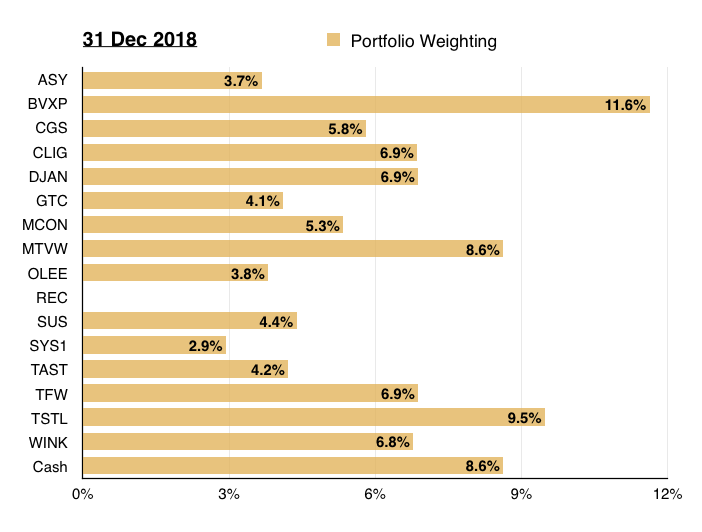
Only a couple of notable weighting movements occurred during the year. The differences are show below:
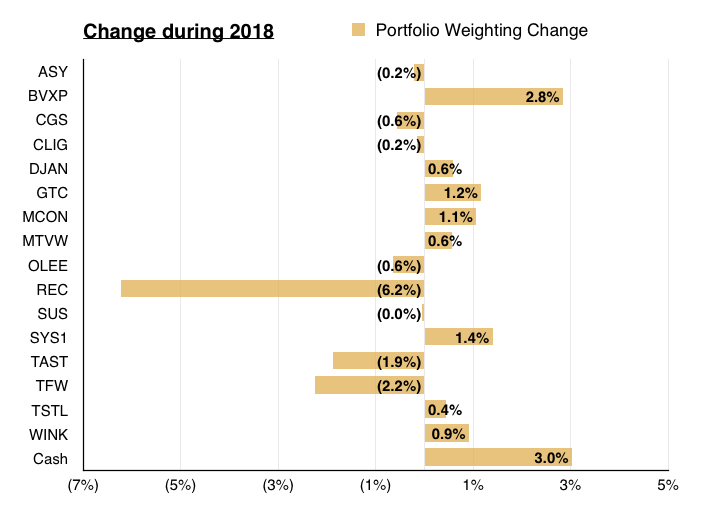
My cash weighting advanced because I sold Record (REC) and did not reinvest all of the proceeds.
Meanwhile, Bioventix (BVXP) increased significantly because the position was relatively large at the start of the year and the share price did well compared to all of my other shares.
Further analysis of my portfolio
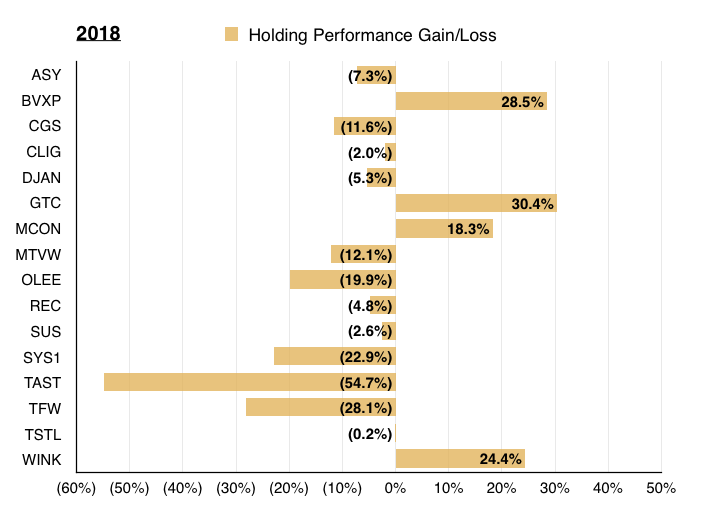
This next chart shows the total return (that is, the capital gain/loss plus dividends received) each holding produced for me during the year:
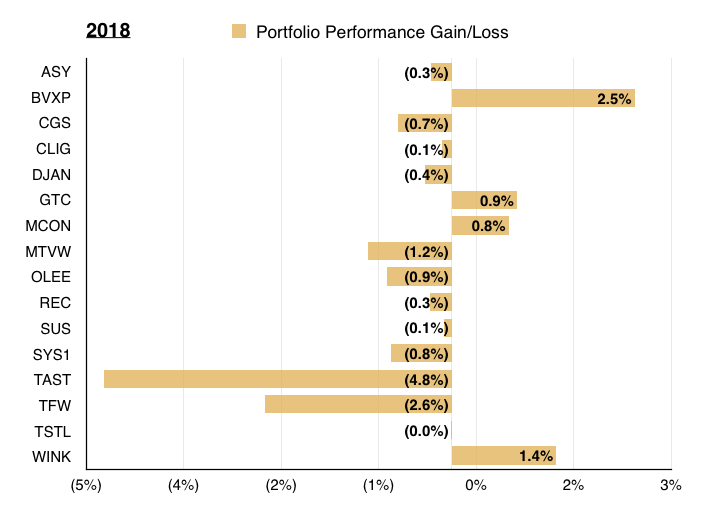
And this chart shows each holding’s contribution towards my overall 6.6% loss:
I hope all of my charts make sense!
Thoughts on my 2018 performance
Only 4 winners from 16 holdings — matching the wider market sell-off
Last year’s rough market ended my remarkably consistent run of winners versus losers.
For 2018, I managed only 4 gainers from 16 holdings.
In contrast. I enjoyed 12 winners from 17 during 2014, 13 from 18 during 2015, 12 from 17 during 2016 and 13 from 17 during 2017.
At least my 2018 winner-loser ratio matched that of the wider market.
SharePad indicates 1,516, or 73%, of the 2,067 London shares quoted for the entire year declined in value.
I am happy that my four winners all boasted significant 18%-plus returns.
10 of my 16 holdings beat my benchmark
I am pleased most of my holdings — 10 of 16 — beat my FTSE 100 benchmark.
Out-performing the market always feels more convincing to me when most of my shares do relatively well.
On the other hand, out-performing the market due to one or two big winners never feels truly sustainable (at least to me).
Avoiding losses was difficult unless I sold heavily during the summer
My portfolio would have still lost money if I had sold Tasty — my biggest loser — at the start of the year.
However, if I had the foresight to sell FW Thorpe — my second biggest loser — as well, I would have scraped an 0.8% portfolio gain.
Apart perhaps from Tasty, none of my holdings became complete disasters during 2018. As such, I find it hard to believe the majority of my losses could have been easily avoided.
Looking back, the only way I could have enjoyed a useful portfolio profit last year was to have sold heavily during the summer bull phase.
11 of my 16 holdings generated total portfolio returns of between -1% and +1%
Not exactly thrilling I know, but this collection of smaller performances produced an aggregate 2% loss — a respectable result given the wider market sell-off.
The ups and downs of 2018 have not really altered the concentration of my portfolio
My top five holdings represent 43% of my portfolio (2017: 42%) while my bottom five represent 19% (2017: 17%).
Some other stats you may find interesting
- Portfolio turnover: I can never remember how to calculate this ratio properly. But for what it is worth, during 2018 I: i) sold shares equivalent to 5.9%, and; ii) bought shares equivalent to 6.7% of my portfolio’s year-start value.
- Dividends collected: Company payouts represented a useful 3.27% of my portfolio’s year-start value. That income included a special dividend from Bioventix and a return of capital from M Winkworth.
- Trading costs: Dealing commissions, stamp duty and account-management fees represented an aggregate 0.07% of my portfolio’s year-start value.
I am 91.4% invested in shares going into 2019
So here we go into 2019, with my current investments confirmed below:
| Holding | Weighting 31 Dec 2018 (%) |
| Andrews Sykes | 3.7 |
| Bioventix | 11.6 |
| Castings | 5.8 |
| City of London Inv | 6.9 |
| Daejan | 6.9 |
| Getech | 4.1 |
| Mincon | 5.3 |
| Mountview Estates | 8.6 |
| Oleeo | 3.8 |
| S & U | 4.4 |
| System1 | 2.9 |
| Tasty | 4.2 |
| FW Thorpe | 6.9 |
| Tristel | 9.5 |
| M Winkworth | 6.8 |
| Cash | 8.6 |
| TOTAL | 100.0 |
As usual, I have no idea what the market will do in the next twelve months. All I can say is that the FTSE 100 index and FTSE 100 total return index start 2019 at 6,728 and 5,950 respectively.
Finally, what are my plans for the year ahead? I have five ambitions:
- To enjoy a market-beating — and positive — performance: Having now written a summary of all of my shares, I could be better off concentrating more on my higher-conviction positions.
- To evaluate at least 20 new companies: My SharePad writing schedule ought to provide me with a good flow of fresh investment ideas.
- To learn more about the cost of staff options: I performed a study on pension deficits last year and I plan to write a similar analysis about share options.
- To see two of my 2018 losers — System1 and Tasty — recover some lost ground: Mind you, I hoped for exactly the same recovery this time last year!
- To enhance this Blog further: I plan to i) publish follow-on articles to How Shares Helped Me Quit The Day Job; ii) showcase more charts/features from SharePad, and; iii) perhaps introduce a proper discussion forum.
Until next time, I wish you happy and profitable investing!
Maynard Paton
PS: You can receive my blog posts through an occasional email newsletter. Click here for details.
Disclosure: Maynard owns shares in Andrews Sykes, Bioventix, Castings, City of London Investment, Daejan, Getech, Mincon, Mountview Estates, Oleeo, Tasty, FW Thorpe, S&U, System1, Tristel and M Winkworth.

Maynard,
That’s an excellent analysis, must have taken a fair amount of time and effort, thanks as always for sharing, its very useful indeed, not least because I too hold some of the companies you do including of course that dreadful performer Tasty!
Best of luck for 2019 and lets hope the market picks itself up soon
Best regards
David
Thanks David
hi Maynard
I’ve just discovered your blog and thoroughly enjoying reading your posts.
Looking at your portfolio weightings I see that your largest holding BVXP represents 11.6% of your total portfolio.
Do you have a maximum weighting % in mind for an individual holding which would trigger some top slicing to reduce risk / exposure?
Snazzy
Hello Snazzy
Thanks for finding my Blog and making the Comment. I don’t really have a set maximum. In the distant past, my largest position represented 40%. In recent years, I trimmed back a position when it reached 18%. I think if a position reached 15% I may ponder about trimming, but the decision depends on whether the share in question still offers value etc. With minimum weightings, I do like my shares to represent at least 3% of my portfolio. I have never really liked fiddling around with deliberately small positions.
Maynard