01 January 2023
By Maynard Paton
Happy New Year!
I trust you enjoyed the festive break and are now ready to battle the market for another twelve months!
This 4,680-word post provides a ‘year in review’ of my current holdings. I recap how each business performed during 2022 as well as provide a few remarks about valuation.
These reviews are very useful to write, not least because they help ensure I am still invested for the right reasons. Any upsets I will suffer during 2023 will most likely be caused by the shares I already own rather than any new shares I will buy.
I undertook the same annual review at the start of 2015, 2016, 2017, 2018, 2019, 2020, 2021 and 2022.
My portfolio lost 23.3% during 2022. This other post explains that performance in more detail and clarifies how my portfolio begins 2023.
I have covered each of my holdings below in order of size within my portfolio. I have accompanied each write-up with a SharePad chart to show how each company has progressed over the longer term.
Of course my calculations, logic, assumptions and charts may have little bearing on the future… so please do your own research and derive your own conclusions!
Contents
- Bioventix
- Tristel
- System1
- Mountview Estates
- City of London Investment
- FW Thorpe
- S & U
- M Winkworth
- Mincon
- Andrews Sykes
- Tasty
- Summary
Disclosure: Maynard owns shares in Andrews Sykes, Bioventix, City of London Investment, Mincon, Mountview Estates, S & U, System1, Tasty, FW Thorpe, Tristel and M Winkworth. This blog post contains SharePad affiliate links.
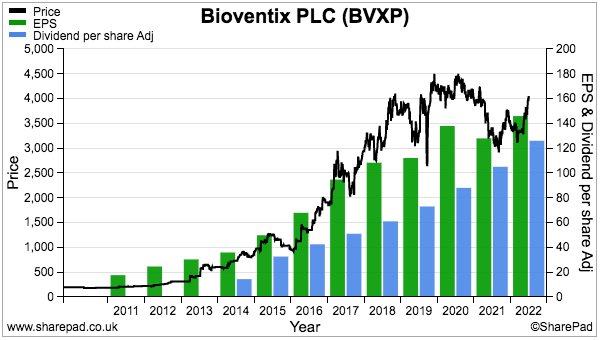
1) Bioventix (BVXP)
- Bid-price: £39
- Market cap: £203m
- Portfolio weighting: 12.0%
BVXP started 2022 as my seventh largest holding and finished 2022 as my largest holding. The promotion followed an 18% share-price gain during a year when all of my other shares lost value.
Interims published during March were not spectacular, with revenue down 8% and adjusted profit down 9% due to ongoing pandemic disruption. But a 21% dividend lift alongside promising pipeline remarks suggested the antibody specialist had not yet gone ex-growth.
A trading update during September — BVXP’s first unscheduled RNS for five years! — revealed a higher-than-expected H2 profit after pandemic disruption subsided and USD-denominated income translated into greater GBP.
The FY 2022 statement disclosed encouraging sales progress from best-seller vitamin D (+13%), future big-seller troponin (+81%) and long-time seller biotin (+67%).
The FY results also reiterated the wonderful economics of collecting royalties and licence fees from successful antibodies. The H2 margin reached an astonishing 82%, with costs kept low because BVXP requires only 16 employees and a small laboratory to operate.
The cash continues to roll in and fund BVXP’s liking for special dividends — the seventh consecutive annual special payout was declared last year. The total ordinary/special dividend was lifted 6% and presently supports a 3.9% income.

The special payouts emphasise how BVXP has expanded without significant reinvestment. During the last five years, BVXP has increased earnings by £2.8m despite retaining only £1.7m.
BVXP should offer some predictability in today’s uncertain markets. Its diagnostic antibodies are employed within clinical blood tests and, once in general use, tend not to suffer much interference or competition. The last results helpfully indicated 8-10% underlying annual growth for the “immediate future“.
But creating successful antibodies does take years and the latest pipeline grid showed in-house R&D directed towards only dementia diagnosis and pollution testing. Sales from pipeline products are expected from 2026 at the earliest, while income from newish antibody troponin will cease during 2032 despite 13 years of development.
I bought BVXP during 2016 at £11 and I have never top sliced. I patiently await a suitable top-up opportunity.
My BVXP buy report | All my BVXP posts
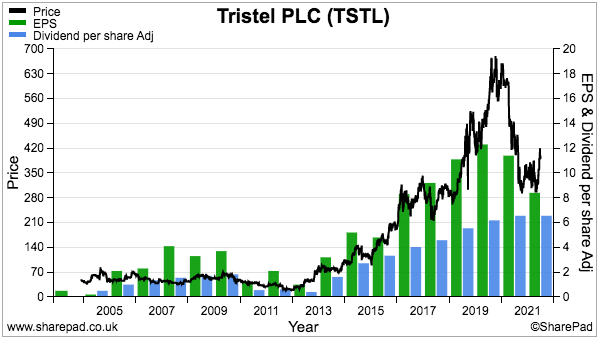
2) Tristel (TSTL)
- Bid-price: 380p
- Market cap: £179m
- Portfolio weighting: 11.9%
Could 2023 be the year TSTL finally receives approval to sell a high-level hospital disinfectant in the United States?
Let’s hope so. After all, work on the FDA regulatory process started during 2014 and various setbacks impeded a formal submission until June 2022. A final regulatory verdict is expected this summer.
Management said last year it had “high hopes that America will be a significant revenue and profit contributor” within the next five years, which felt very bullish given the FDA’s decision was at the time still twelve months away.
But December’s AGM disclosed sales of lower-level disinfectants had now commenced in the States, while TSTL’s US partner claims to be “the recognised world leader” within the ultrasound-gel market — and presumably would not get involved with TSTL unless FDA approval was very likely.
The US opportunity could be significant; a TSTL competitor estimates the total US market for disinfecting ultrasound probes alone is worth $180m, versus TSTL’s global sales of £31m.

Early US success would certainly help shareholders forget an underwhelming 2022.
Progress was stifled by the pandemic, which led to hospitals postponing procedures and reducing orders for disinfectants.
February’s interims were also complicated by a mix of Brexit stockpiling and the discontinuation of ‘legacy’ products, while October’s annual figures were complicated even further by TSTL restating the earlier ‘discontinued’ classification.
Nevertheless, the £9m net cash position funded a welcome 3p per share special dividend while the 18% adjusted operating margin (during a difficult year) suggested the products still harbour a competitive edge. Various patents are due to expire soon, but the inventor of TSTL’s chemistry has assured me the group’s ‘secret’ ingredients and manufacturing methods will keep rivals at bay.
Guidance of 10-15% per annum sales growth — excluding any US contribution — implies demand will recover strongly following the pandemic. Very rough sums suggest FY 2025 earnings may reach 14p per share if TSTL’s revenue expectations are met, which leaves a lofty 27x P/E and no room for an FDA rejection.
I bought TSTL at a 46p average during 2013 and 2014, and I sold 75% of my shares throughout 2014, 2015, 2016 and 2017 at 79p, 100p, 123p and 289p.
My TSTL buy report | All my TSTL posts
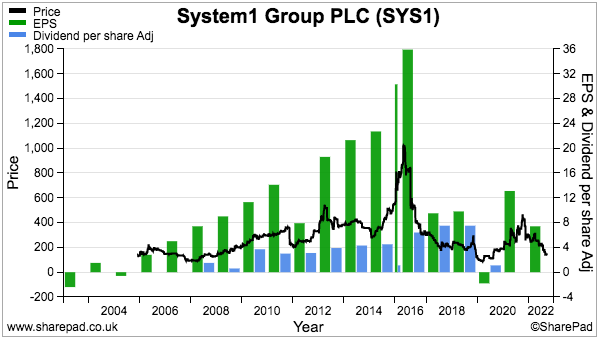
3) System1 (SYS1)
- Bid-price: 130p
- Market cap: £16m
- Portfolio weighting: 11.5%
This time last year I wrote:
“An outside risk is SYS1’s founder/executive president/23% shareholder using his creative/marketing skills to exaggerate his company’s potential. My investment will suffer badly if that is the case.”
My SYS1 investment did suffer badly during 2022 and I do now wonder whether management did indeed exaggerate the company’s potential.
If you recall, the FY 2021 results were overshadowed by the board’s public ambition of attaining a £1 BILLION valuation… but the FY 2022 results unfortunately did not repeat that target. When quizzed at the AGM, management stated: “The ambition is as strong and as big as it has always been. But at the same time, let’s keep it real. Realism and belief“
The ‘realism’ followed February’s profit warning that disclosed a £1m profit shortfall caused by weak demand for bespoke consultancy. Once SYS1’s core business, consultancy income now appears to be floundering as the advert-testing specialist transitions to selling data services.
The inherent promise of data services remains intact: ‘disruptive’ pricing should lead to more customers, revenue should become more predictable and economies of scale should eventually lead to decent financials. Sales partnerships with ITV and LinkedIn plus a raft of household-name clients do suggest the data services are actually very good.
Trouble is, my understanding from the AGM is the data division is some way from profitability while the old-style consultancy work had been the big money-spinner — but now seems likely to wither away.
November’s interims encouragingly showed data sales up 38% to represent 59% of total revenue. But the lack of consultancy work led to a small reported loss and a sizeable £2.6m cash outflow. Various woes will now “erode profitability” during 2023.
Unhappy shareholders commendably prompted SYS1 to undertake a strategic review last year, although the main outcome — to focus on digital adverts and the United States — feels odd when recent success has involved partnering ITV to test UK television ads. The AGM attracted significant protest votes and the review’s conclusion might prompt greater protests this year.
I bought SYS1 at 325p during 2016, at 238p during 2018, at 183p during 2020 and at 242p during 2021, and have never top-sliced. I am unlikely to buy or sell during 2023, but remain hopeful the transition to data services will one day pay off.
My SYS1 buy report | All my SYS1 posts
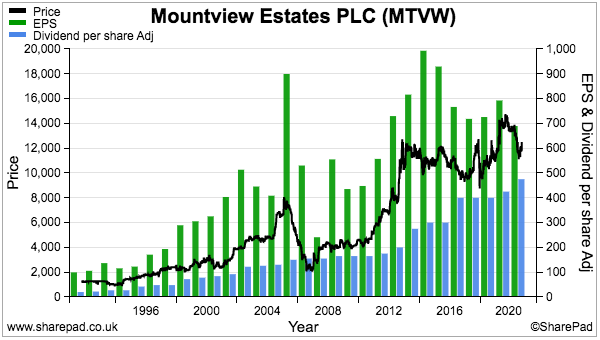
4) Mountview Estates (MTVW)
- Bid-price: £115
- Market cap: £448m
- Portfolio weighting: 10.3%
A useful 250p per share special dividend announced within November’s interims — which followed a 275p per share special payout during the prior year — emphasised management’s confidence despite references to the “economic storms that lie ahead“.
Annual results in June had already showed the regulated-tenancy landlord preparing for a challenging housing market.
Expenditure on new properties fell to a 13-year low while net debt reduced to its smallest level for more than 20 years. The figures also revealed a definite ‘seller’s market’; average sales prices reached a record £347k and the realised premium to the 2014 Allsop valuation advanced to a fresh 66% high.
But November’s interims did signal MTVW resuming significant purchases; the £27m spent during the first half exceeded the amounts spent during each of FYs 2020, 2021 and 2022. Perhaps housing bargains are now appearing, although management described the transactions as only “good purchasing opportunities“.

MTVW’s properties are all carried at cost and I estimate the £102 per share net asset value (NAV) could eventually realise approximately £200 per share versus a mid-price of £120. Exactly what the group’s balance sheet is worth today remains guesswork as management refuses to undertake a repeat of the 2014 independent valuation.
I trust MTVW’s reliable financial history will be extended during 2023. Since the current chief exec took charge during 1990, NAV has rallied 14-fold (+9% per annum average) while the dividend has jumped 41-fold (+12% per annum average). Net debt remains modest at just 7% of the trading-property estate.
No doubt shareholder squabbles will extend into 2023, too. The minority faction of the founding Sinclair family (ownership 24%) disagrees strongly with the majority faction (ownership 50%) about the latter’s board stewardship, governance and pay. Protest votes at the AGM continue to creep higher, while the chief exec is 75 years old and has no obvious Sinclair family successor.
I first bought MTVW during 2011 at £42. I then topped-up at £98 during 2018 and 2019, and have never sold. The best upside potential seems to occur when the shares trade at (or even below) NAV. Include the special payout and the trailing yield is a worthwhile 6%.
My MTVW buy report | All my MTVW posts
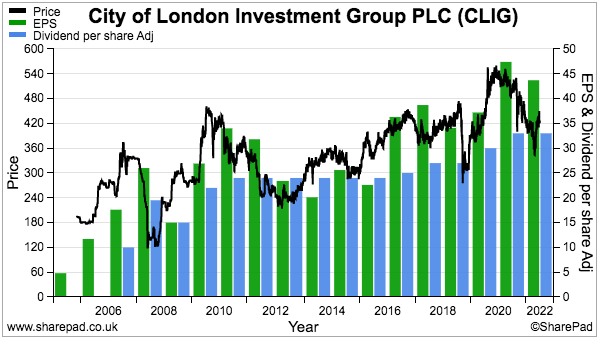
5) City of London Investment (CLIG)
- Bid-price: 420p
- Market cap: £213m
- Portfolio weighting: 9.8%
CLIG was my sole purchase during 2022. I increased my holding by 50% at 353p during October following full-year results that confirmed an unchanged 33p per share annual dividend. The payout supported a 9% yield at my purchase price.
I had invested previously at a 281p average between 2011 and 2013, although I did sell 42% of those shares during 2015 at 335p. My latest investment takes my average overall buy price to 299p.
Last year was not the easiest for this fund manager. True, February’s six-month figures revealed a welcome 13.5p per share special dividend after H1 profit surged 38% following the merger with Karpus Investment Management during 2020.
But the interims also showed funds under management (FuM) stagnant at $11b, before September’s finals confirmed FuM had dived 17% to $9.2b and an October update admitted FuM had dropped a further 8% to $8.5b. That lower level of client money led me to estimate possible earnings of 36p per share versus the adjusted earnings of 48p per share reported for 2021.
Despite the rough markets, CLIG’s clients still seem keen to invest. The group has announced net inflows of new customer money during each of the last four quarters — the longest run of inflows since CLIG commenced quarterly updates during FY 2018. I’d like to think CLIG’s ‘value’ investment approach of buying investment trusts at wide discounts may finally be having its day in the sun.
CLIG’s accounts remain some of the best in my portfolio; margins last year were a terrific 46% while super cash conversion has over time bolstered net cash and investments to £30m. A tantalising thought is how the financials could look if CLIG ever won large new mandates and enjoyed greater economies of scale.
Discussion during this year’s AGM revealed Karpus founder and 36% shareholder George Karpus intends to step down from his role as non-exec later this year.
Mr Karpus also complimented my blog, saying I was “spot on about a couple of things“. Mr Karpus did not specify what those things were, but the gist of my comments concerned low FuM growth and a lack of marketing.
My CLIG buy report | All my CLIG posts
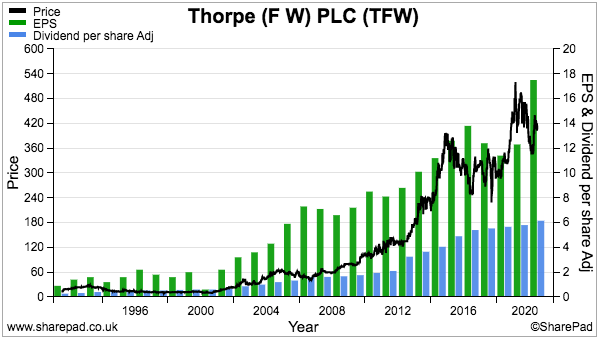
6) FW Thorpe (TFW)
- Bid-price: 400p
- Market cap: £469m
- Portfolio weighting: 8.7%
It’s an ill wind.
While 2022 witnessed many companies warn about surging energy costs, TFW looks set to become a beneficiary. The group has developed energy-efficient lighting for years and October’s annual statement remarkably claimed orders would remain “resilient [even] if a recession becomes inevitable“. Payback periods for some customers have apparently reduced by two-thirds within the last twelve months.
But TFW has not been entirely immune to wider industrial difficulties. Supply issues limited component availability and suppressed the group’s first-half performance, leaving sales excluding acquisitions to gain only 4%.
Mind you, the interims also revealed profit up 10% and the order book at the main Thorlux subsidiary up 25%. A 2.27p per share special dividend — the seventh extra payout since 1999 — was a welcome surprise given hefty payments for new acquisitions (Zemper and Ratio, £25m) and hefty payments to complete old acquisitions (Lightronics and Famostar, £15m).

Acquisitions since 2016 have transformed TFW from a predominantly UK business to a pan-European operator. The September purchase of SchahlLED, a German lighting installer, appears particularly logical given the new subsidiary had been TFW’s largest customer.
Note that TFW remains cash positive despite the acquisition activity. Year-end cash was £41m with debt at just £2m and future earn-outs at £17m. SchahlLED has since absorbed a further £13m. October’s annual figures also showed a bumper second half with group margins at a healthy 20%.
The founding Thorpe family retains a 45%-plus shareholding and underlines why the dividend has been lifted every year since 2002 and not been cut since at least 1991. The somewhat insular boardroom has been staffed for years by family members and long-time employees, but the recent appointment of a Dutch investor as the group’s first independent non-exec signals a welcome broadening of management expertise.
Customers scrambling for energy-efficient lighting plus significant ESG attractions for City investors no doubt explain the c25x rating. I first bought during 2010 at 69p and bought more during 2011 at 80p and during 2012 at 89p. I sold 25% at 234p during 2016 on (unfounded) valuation worries.
My TFW buy report | All my TFW posts
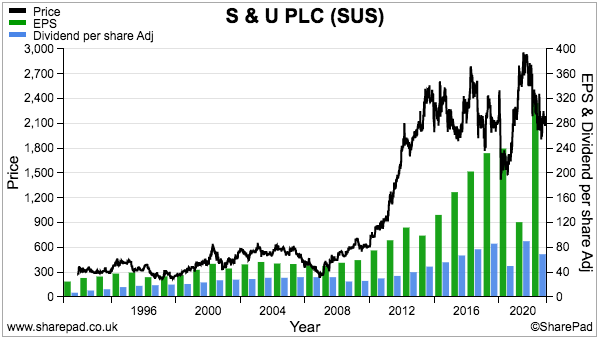
7) S & U (SUS)
- Bid-price: £21
- Market cap: £252m
- Portfolio weighting: 8.4%
Newsflow from this motor-finance lender was somewhat defiant throughout 2022.
Annual results during March prompted management to suggest SUS was “primed for a new era of profitable growth” after a “lower than normal” bad-debt provision underpinned fresh records for profit, net asset value (NAV) and dividends.
August’s trading statement then confirmed “growth currently exceeds budget” alongside comments of the performance being “inadequately reflected in stock-market commentary and valuations“.
Mind you, SUS’s main business — providing used-car finance to borrowers with imperfect credit histories — may not seem the most promising activity heading into a recession. The smaller bridging-loan division for property developers may struggle with a difficult housing market, too.
But the group’s veteran family board is worth backing. The executives enjoy 40-year tenures and have successfully navigated previous downturns by keeping loan quality high and borrowings under control. The board’s 42%-plus shareholding helps explain why the dividend is up 50-fold since 1987 and was cut only once (due to the pandemic) during that time.

September’s interims set fresh H1 records albeit bolstered by lower bad debts that stemmed from management’s ‘over-provisioning’ during the pandemic.
December’s update then said loan collections were “excellent” and bad debts were “below budget“, with the chairman claiming the current economic pessimism may have been “overdone“.
Because SUS’s earnings are influenced by yearly provision fluctuations, NAV maybe the more reliable yardstick for valuation purposes. At the last count, a £404m loan book less debt of £180m gave an NAV of approximately £18.45 per share — which is not far below the £21 share price.
Past ROCE has never been spectacular at approximately 15%, which has meant the market cap has rarely traded at a premium multiple. Similar to MTVW, the best upside potential seems to occur when the shares trade at (or even below) NAV.
I first bought SUS during 2017 at £21 and bought more during 2019 at £19 and again during 2020 at £17. I have never top-sliced. I am hopeful 2023 sees good progress combining with pessimistic markets to create an outstanding buying opportunity. The yield for the year ahead is 6%.
My SUS buy report | All my SUS posts
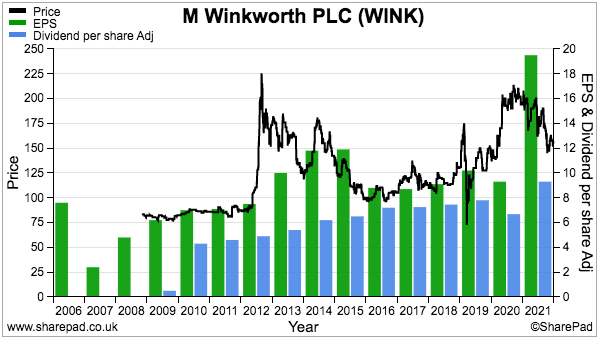
8) M Winkworth (WINK)
- Bid-price: 150p
- Market cap: £19m
- Portfolio weighting: 8.2%
This time last year the debate about WINK concerned how the estate-agency franchisor would follow an exceptional 2021 without the assistance of “pandemic-induced buyers” and stamp-duty holidays.
The debate today concerns how WINK will progress in light of higher mortgage costs and the prospect of a property-market downturn.
WINK’s 2022 updates were very acceptable in the circumstances.
January’s update acknowledged 2021’s profit would be ahead of expectations and pleasingly revealed a special 3.8p per share payout.
Annual figures released during March then confirmed profit had surged 113% after both sales and lettings attained record commissions. The statement encouragingly claimed market activity continued to be “brisk“.
September’s first-half figures commendably matched the preceding second half while an October update reiterated an earlier £2.1m profit forecast after claiming WINK had “not as yet witnessed a negative impact from the mini-budget“.
A November update then indicated profit running ahead of that £2.1m forecast, but notably included talk of new buying registrations falling “significantly” and a “weaker property market in 2023“.
My hope for the tricky year ahead is WINK’s self-employed franchisees can extend the London market-share gains they won during the Brexit-hampered years of 2016-2020. The first-half presentation showed WINK boasting 77% more properties sold-subject-to-contract than rival Foxtons within its particular “office geography“.
WINK’s financials remain in good order with a robust 25% margin, £4m net cash and next-to-no tangible assets to worry about. The resilient ordinary quarterly dividends were lifted 23% during 2022, while WINK’s pair of controlled branches plus its commercial-property agency displayed good promise.
WINK’s seasoned family management retains a 47% shareholding and last year the low-profile executives commendably appeared on their first retail-investor webinars.
My initial WINK buy occurred at 90p during 2011 and I sold 70% of my holding during 2013 and 2014 at 173p. I rebuilt my stake at an average 116p during 2016 and 2017, with a 178p top-up made during 2021.
The rather illiquid shares presently yield more than 6% and could well offer a buying opportunity during 2023.
My WINK buy report | All my WINK posts
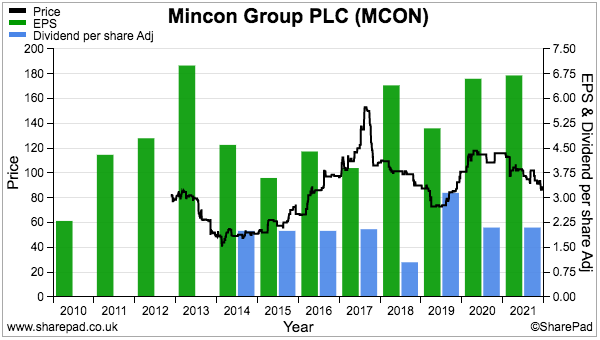
9) Mincon (MCON)
- Bid-price: 85p
- Market cap: £181m
- Portfolio weighting: 3.4%
Could 2023 witness a turning point for MCON? September’s announcement of the first commercial contract for the group’s Greenhammer system was described by management as a “milestone” that offers “transformational potential for Mincon and the hard-rock surface mining industry“.
First mentioned to shareholders way back in 2016, Greenhammer offers miners faster drilling, reduced rig requirements and “tremendous” fuel savings… and the opportunity for extra sales is, at least according to MCON, “huge“.
Perhaps Greenhammer could one day become transformational to MCON’s finances. Unfortunately during recent years, the drill manufacturer’s aim to offer “industry-leading quality” has not really translated into super accounts.
I invested at 45p during 2015 when healthy 19% margins implied a robust competitive advantage. But MCON’s 2021 figures showed only 12.5% of revenue converting into profit while August’s interims owned up to a disappointing 10%.
True, various logistical headaches and rising material costs have affected recent progress. But MCON’s margin has been lower than 15% for several years now, and overwhelming evidence of ‘moat’-type economics from the tip-top engineering remains hard to find.
Indeed, MCON’s strategy to service customers direct and supply a wider drill range has created far-from-ideal financials. The plan has involved numerous acquisitions, notable capex and enormous working-capital demands, which combined have absorbed significant levels of cash. The group’s €49m flotation war chest from 2013 has since shrunk to net debt of €12m.
The strategy has nevertheless allowed MCON to diversify into the construction sector, which has grown from zero to 37% of group revenue within six years, and expanded by an impressive 55% during the first half of 2022. Mining sales gained 18%, too, as higher costs are gradually being passed on to customers.
Underpinning my faith is the founder family management that owns 57% of the business. Tellingly, the family did not sell any shares at the 2013 float and has not sold any since. I have not sold any since my purchase, and perhaps just need extra patience for the moat-type financials to emerge.
Unless Greenhammer really takes off, this year may struggle to see a compelling buying opportunity with the shares at 15 times my last earnings guess.
My MCON buy report | All my MCON posts
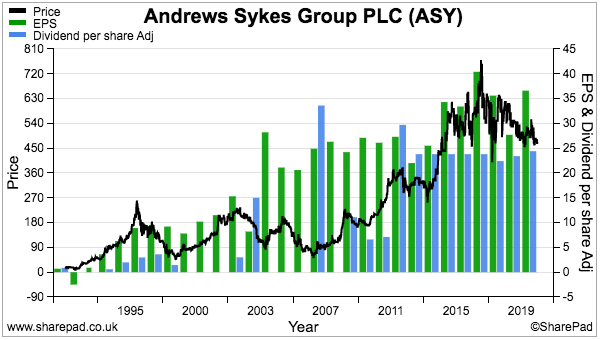
10) Andrews Sykes (ASY)
- Bid-price: 450p
- Market cap: £190m
- Portfolio weighting: 2.8%
Last year marked a milestone for my ASY holding. I purchased the shares at an average 233p during 2013 and subsequent ordinary and special dividends have since reached 271p — therefore recovering my entire investment through payouts alone!
The dividend proved reliable last year. May’s preliminary statement showed the annual payout lifted a penny after profit rebounded an encouraging 35% following the pandemic.
But the dividend highlight was the special payment declared within September’s interims — a useful 16.6p per share that complemented a previous special from 2020. The two specials were both declared when net cash had reached approximately £30m, and further extra payments may perhaps now be distributed whenever the cash position exceeds that level.

Yearly progress at this equipment-hire specialist is influenced by extreme weather, such as cold snaps, heatwaves and extensive rain, which create sudden demand for the group’s heaters, air conditioners and water pumps.
Last year’s scorching summer ought to have created a sales bonanza, although shareholders will not discover the exact financial outcome of the heatwave until the results this May. The directors have modestly claimed they are “optimistic” about the 2022 performance, which is handy as September’s interims were not spectacular with profit up just 6%.
My hefty dividends reflect the group’s 90% family owners and their liking for income. ASY has in fact distributed approximately 85% of its reported earnings after I became a shareholder.
Some see the 90% ownership as a persistent negative to ASY. The shares suffer a wide spread and possess greater ‘fiefdom’ risk, because the salaried executives could always focus on pleasing the 90% owners to the detriment of the other 10%.
The 10% free float and sensitivity to the weather may be why the company has rarely traded at a premium rating. The 465p mid-price currently looks rated at 13x earnings and yields nearly 5%.
Mind you, the economics of hire equipment can be very attractive. ASY’s UK hire margin last year was a super 34% while the cost of rental stock can be recouped from just one year’s hire fees.
European expansion offers longer-term potential, although such progress has been slow going. And last year’s French restructure emphasised not every overseas market will be successful.
My ASY buy report | All my ASY posts
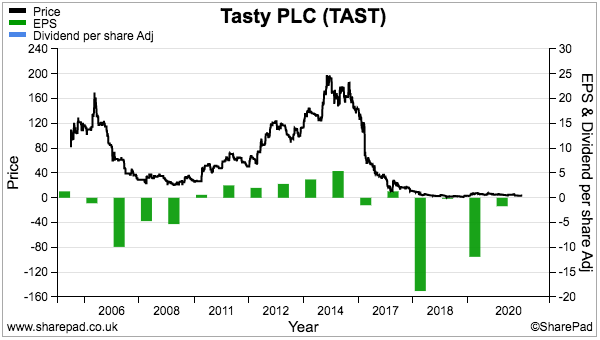
11) Tasty (TAST)
- Bid-price: 3.5p
- Market cap: £5m
- Portfolio weighting: 1.1%
I had thought 2022 would be the year when TAST finally started a recovery following years of setbacks.
My hopes were lifted in March when the hapless restaurant operator announced a “measured expansion plan for a pipeline of five to six new units this year“. Opening five or six new sites appeared extremely bullish given TAST had reported losses since 2018 and its entire estate totalled only 54 outlets.
Annual results issued the same month provided further optimism. Highlights included a bumper second half, appointing an experienced new executive, repaying an emergency loan and no longer mentioning a CVA. A £7m net cash position also seemed reassuring given the wider economic situation.
But the results included downsides. Pandemic rent reductions appeared temporary, generous depreciation policies were flattering reported profit while rising staff costs would be “impossible to completely absorb“.

Economic reality hit TAST by September’s H1 statement. The group all but abandoned the expansion plan as it braced itself for “an even more challenging economic environment“. Doubts about H2 profits were thrown in for good measure.
TAST proves that significant family shareholdings do not always lead to great investments. The Kaye family owns at least 30% and had built and sold successful restaurant chains before, but this time could not cope with greater competition, higher staff costs and the resultant margin squeeze.
The Kayes have all now departed TAST’s board, although whether the strategy sans-Kayes will succeed remains debatable. The pandemic could have been the chief exec’s opportunity to completely revamp the business into a fitter, stronger operation. But I fear the same old menu dominated by pizzas, pastas and burgers may not enjoy the resilience needed for a downturn.
I first bought TAST at 50p in 2011 and again at 98p in 2014. I sold 15% during 2016 at 179p — and of course regret not selling the rest with the mid-price now at 4p. Instead I bought more at 45p during 2017 and even more during 2018 at 15p. I now need a 10-fold recovery just to breakeven.
I continue to hold because the £5m market cap could be remarkably cheap… assuming any sort of sustainable profit can be generated from trailing sales of £45m.
My TAST buy report | All my TAST posts
Summary
Last year I kept with the same 11 shares and my holdings mostly exhibit the traits outlined in How I Invest:
- Capable, owner-aligned management;
- Decent accounts;
- Respectable track records, and;
- Reasonable prospects.
I admit TAST no longer meets that criteria (if it ever did), but TAST’s shares have long since passed their sell-by date and a 1% position won’t do much harm even if the worst does happen.
The plan for 2023? I am hopeful my portfolio can recover as a mix of savvy management and conservative balance sheets help my shares navigate a difficult economy. My portfolio has a 12% cash position to deploy, and the leading top-up candidates are ASY, CLIG, MTVW, SUS and WINK. My SharePad articles could of course identify some suitable alternatives.
I trust you found this annual review informative. I certainly found it useful to write.
Please click here to examine my portfolio’s 2022 performance in more detail.
Until next time, I wish you safe and healthy investing!
Maynard Paton

Hello Maynard,
I follow you and read all your posts as I am a shareholder myself of CLIG and WINK.
I find your blog very useful and hope you will continue.
Happy new year.
Hi Eric
Thanks for the message and I am glad you like the blog, which will continue!
Maynard