19 June 2022
By Maynard Paton
Results summary for City of London Investment (CLIG):
- The Karpus merger ensured impressive headline progress, but this H1 performance was almost identical to the preceding H2 as funds under management (FuM) remained at $11b.
- Wishful thinking perhaps, but two consecutive quarters of net FuM inflows following consistent FuM outflows may signal clients re-appraising CLIG’s ‘value’ approach.
- Rough market conditions during the subsequent H2 will test CLIG’s investments, with FuM dropping 13% to below $10b not indicating obvious outperformance.
- A wonderful 49% margin and net cash of £25m funding a welcome £7m special dividend suggest the accounts can survive any further market weakness.
- Although the possible P/E is 11 and the yield tops 7%, the shares have been rated modestly for years as major new clients remain extremely elusive. I continue to hold.
Contents
- News links, share data and disclosure
- Why I own CLIG
- Results summary
- Revenue, profit and dividend
- Funds under management: inflows and outflows
- Funds under management: capacity limitations
- Funds under management: investment performance
- Funds under management: fee rates
- Management
- Exchange-rate/post-tax profit matrix
- Financials
- Valuation
News links, share data and disclosure
News: Interim results for the six months to 31 December 2021 published 18 February 2022 and Q3 2022 trading update and board restructure published 26 April 2022
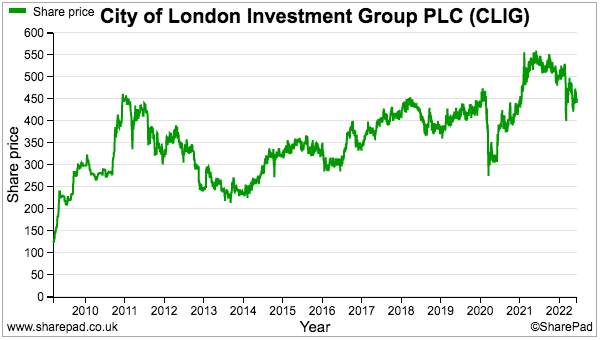
Share price: 450p
Share count: 50,679,095
Market capitalisation: £228m
Disclosure: Maynard owns shares in City of London Investment. This blog post contains SharePad affiliate links.
Why I own CLIG
- Fund manager that employs a lower-risk strategy of buying investment trusts at wide discounts through a “team approach to investing” (point 6b).
- Accounts showcase wonderful 49% margins, hefty net cash and ability to distribute majority of earnings via dividends.
- P/E of 11 and yield of 7% offer meaningful re-rating potential should sizeable new mandates ever bolster funds under management.
Further reading: My CLIG Buy report | All my CLIG posts | CLIG website
Results summary
Revenue, profit and dividend
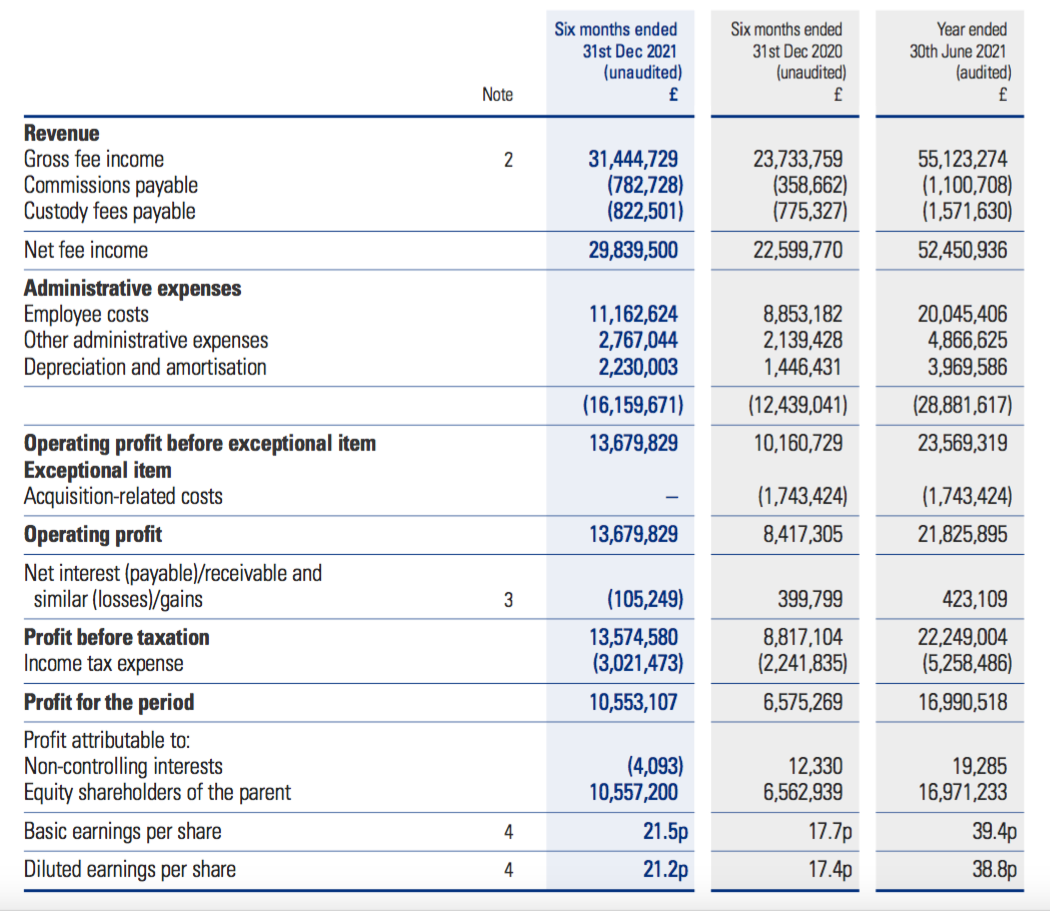
- The £102m merger with Karpus Management mid-way through H1 2021 ensured this H1 2022 statement would show significant financial progress.
- Including Karpus, total net fee income increased 32% to £29.8m:
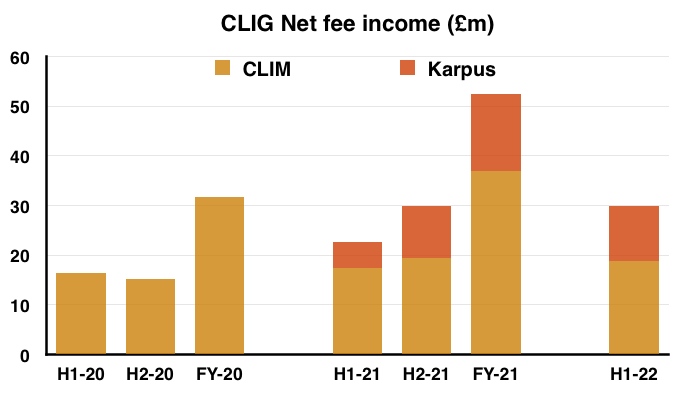
- Excluding Karpus, net fee income for the existing City of London Management (CLIM) division gained 8% to £18.9m.
- Pro-rata Karpus net fee income climbed 6% to £10.9m.
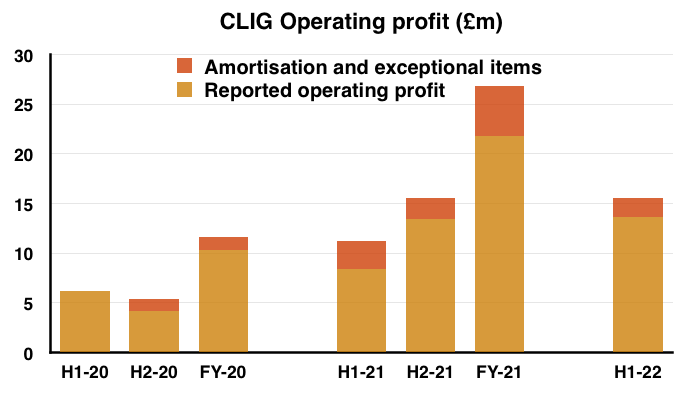
- Charges associated with the Karpus merger influenced profit comparisons, and consisted of:
- Exceptional merger expenses of £1.7m incurred during the comparable H1 2021, and;
- Amortisation of acquired intangibles, which came to £1.1m during the comparable H1 and £1.9m during this H1.
- Adjusting for the Karpus exceptionals and amortisation, H1 operating profit surged 38% and matched the £15.6m cited within the Q2 update:
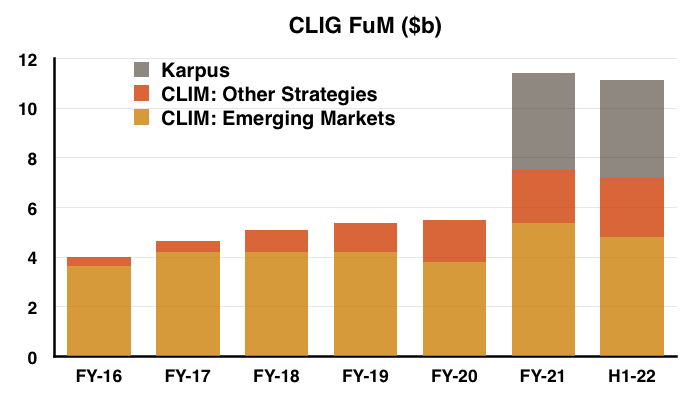
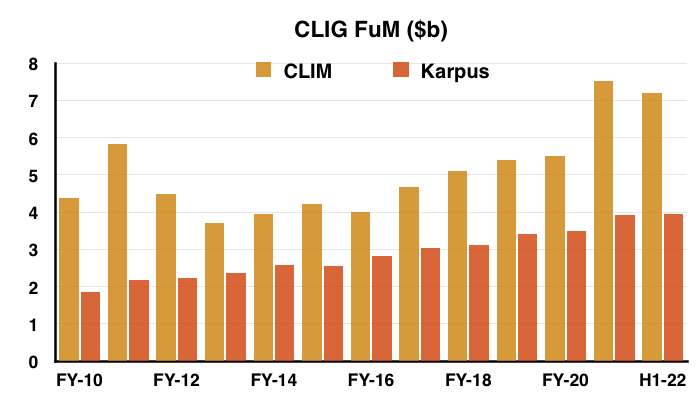
- The greater fees and profit for this H1 were due to higher funds under management (FuM) since Q1 2021.
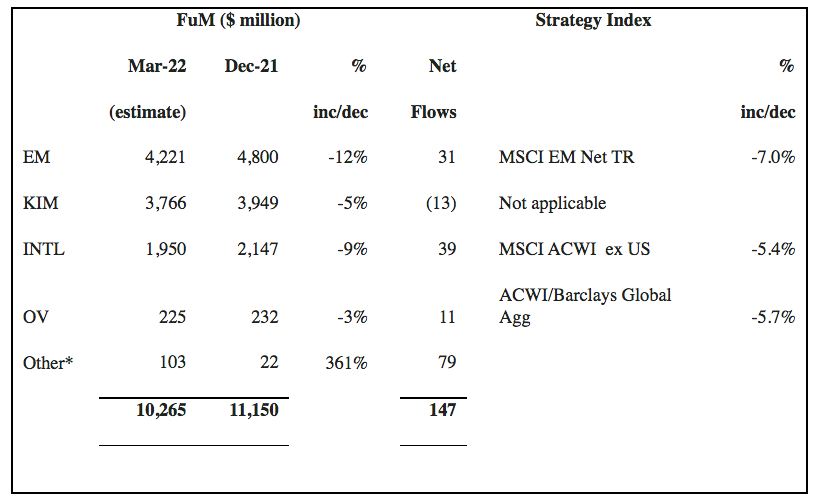
- FuM for Q1 2021 was $5.9b at CLIM and $3.6b at Karpus, since when FuM at CLIM has rallied to $7.2b while FuM at Karpus has increased to $3.9b:
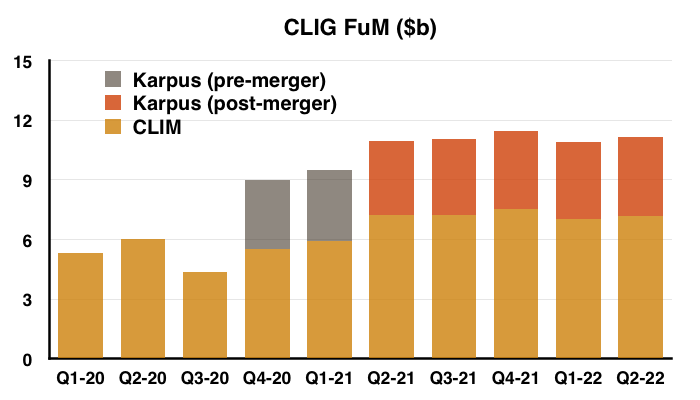
- Note that FuM has bobbed around the $11b mark since Q2 2021, and fee income and profit for this H1 performance were in fact almost identical those of the preceding H2.
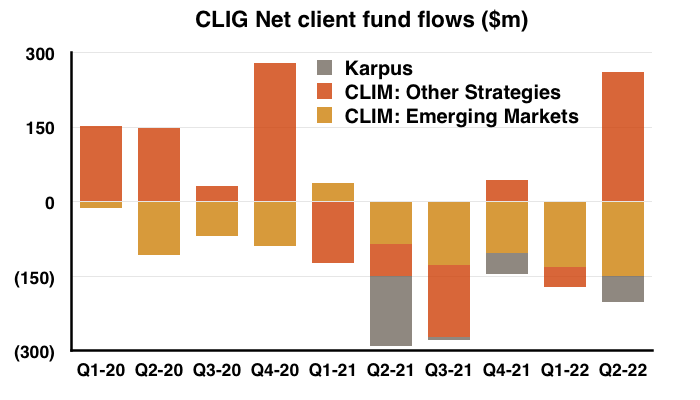
- A potentially significant development for FuM occurred during Q2 2022 — CLIG enjoyed a net inflow of client money after five quarters of outflows (see Funds under management: inflows and outflows).
- The Q3 2022 statement then repeated the trick with another inflow of client money (see Valuation).
- Wishful thinking perhaps, but maybe clients have started to re-appraise CLIG’s ‘value’ style of investing following the recent rotation out of ‘growth’ shares.
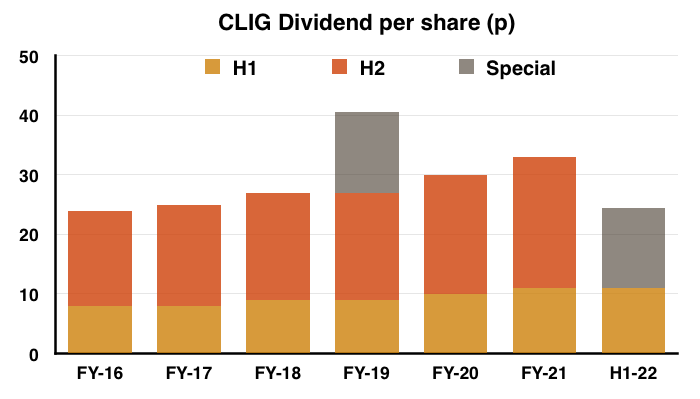
- The interim dividend was left unchanged following talk of an “uncertain background“:
“Inflationary pressures and a near-term tapering of quantitative easing signal a clear tightening bias from Central Banks and, mindful that economic activity remains “COVID-constrained” in many countries, the outlook for global equities is far from assured in 2022.
Against this uncertain background, your Board has declared an unchanged interim dividend of 11p per share, a level which leaves a small degree of “headroom” within the stated dividend cover policy of 1.2/1 over a rolling five-year period.“
- But the background was not too uncertain to prevent a welcome special dividend:
“At the same time, the Board is conscious that any accumulation of capital over and above that which is needed for capital investment, regulatory requirements and a prudential cash buffer should be returned to shareholders.
Accordingly, the Board has also declared a special dividend of 13.5p per share, making this the second such special distribution in the last three years.“
Funds under management: inflows and outflows
- CLIM’s FuM can be divided into two main categories:
- Emerging Markets (EM), and;
- Other Strategies, which cover:
- Developed (or “International“) markets;
- “Opportunistic Value”;
- “Frontier” markets, and;
- REITs.
- Both categories apply CLIG’s long-standing value approach of buying investment trusts at wide discounts and occasionally taking an activist stance.
- Karpus meanwhile manages a mix of US equities, including investment trusts, and fixed-income securities.
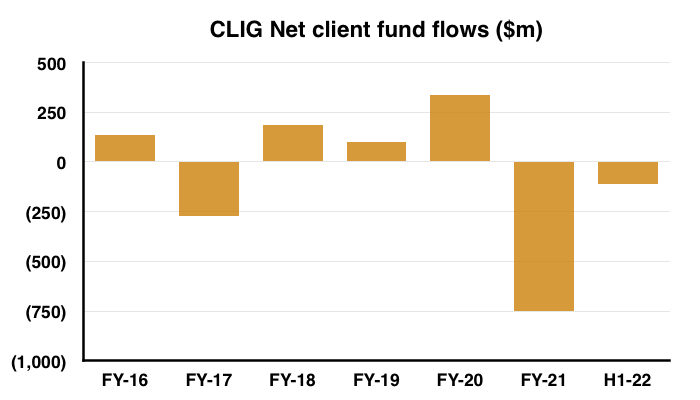
- For years CLIG has struggled to attract significant sums of new client money.
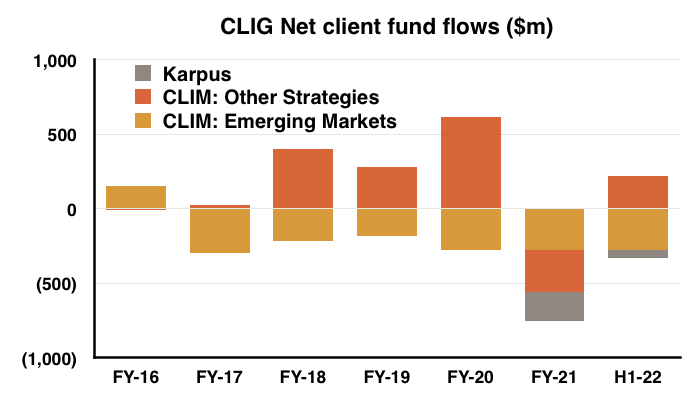
- The (thin) red bars on the chart below put the client money inflows and outflows into perspective:
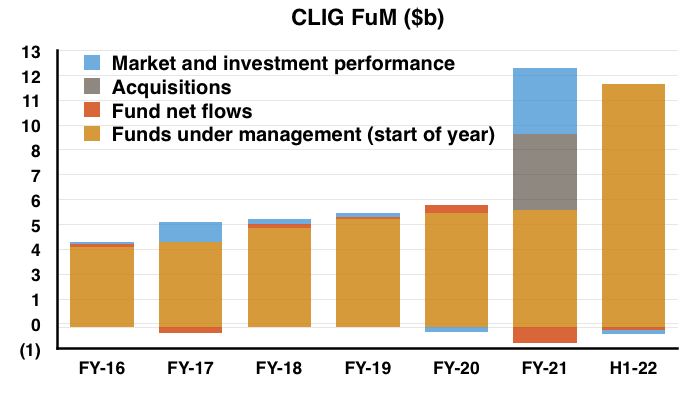
- The preceding FY 2021 in fact witnessed client net withdrawals of $752m, which almost entirely offset the aggregate net client inflows of $758m enjoyed between FYs 2016 and 2020:
- The withdrawals continued during this H1:
- CLIG’s Q1 update claimed that quarter’s outflows were “primarily due to ongoing client rebalancing in the emerging markets strategies after strong gains last year.”
- This H1 statement also claimed “year-end tax planning” had led to the Karpus outflows.
- CLIM’s original EM division has consistently suffered net outflows since FY 2017… including nine of the last ten quarters:
- Karpus has witnessed net client withdrawals of $244m since the merger and has not yet enjoyed a quarter showing a net inflow.
- CLIG said marketing progress was hampered by clients preferring to meet online:
“Both CLIM and KIM remain constrained by clients and prospects limiting their access via in-person marketing; we believe in-person marketing and client discussions are a strength of both operating subsidiaries, as investment management remains a relationship-driven business.
With this said, we are prepared moving forward with the ability to provide in-person or virtual meetings with clients, consultants and prospective clients depending on their preference“
- At least the International strategy has (finally) attracted new money after re-opening:
“Re-opening our INTL [International] strategy to new investors contributed significantly to net inflows after being closed to new investors for the year to December 2020 following a period of strong growth.
- The re-opening bolstered the Q2 2022 performance and produced CLIG’s best inflow for 18 months.
- Mind you, closing a strategy to new investors is never ideal for a fund-management business.
- CLIG encouragingly anticipates further inflows:
“Currently, we are projecting this positive trend of net inflows to continue through the remainder of the financial year.“
- International FuM now tops $2b versus less than $0.5b during FY 2018, and currently represents the vast majority of CLIM’s Other Strategies FuM:
- CLIG’s largest client appears content. Its gross fees advanced 19% on the comparable H1 and were unchanged versus the subsequent H2 at almost £3m:
“Included in gross fee income are fees of £2,966,412 (year to 30th June 2021 – £5,470,051; six months to 31st December 2020 – £2,488,298) which arose from fee income from the Group’s largest customer. No other single customer contributed 10 per cent or more to the Group’s revenue in any of the reporting periods.“
Funds under management: capacity limitations
- An inherent problem for CLIG remains the “capacity limitations” within the EM strategy. CLIG said:
“Whilst our unique focus on closed-end funds (CEFs) has enabled us to deliver relative outperformance against a relevant benchmark to our clients over multiple investment cycles, capacity limitations in the [EM] CEF universe of available securities have constrained growth.“
- A “capacity limitation” occurs when a fund becomes too large to outperform because of the restricted size of its target universe of stocks.
- CLIG has previously implied the EM strategy suffers a capacity limitation of between $5b and $6b.
- Half-year EM FuM at $4.8b represented 43% of total group FuM.
- Although 43% is the lowest proportion of EM FuM in CLIG’s history, the percentage remains significant and the associated capacity limitations will therefore dampen overall FuM growth.
- The main hope for extra FuM is the aforementioned International strategy, which has yet to become subject of any capacity concerns.
- The International strategy has been a slow burner, having started more than ten years ago:
“As many of our shareholders will recognise, this “overnight success” has taken over a decade to achieve and was only possible as a result of the relentless efforts of the INTL [International] team. Reaching this milestone is a reflection of the hard work by many of our colleagues along with the patience of shareholders.“
- I trust attracting another $2b for the International strategy will not take another ten years.
- CLIG admitted some clients have switched from EM to International:
“A handful of CLIM clients in the past six months transferred their account balance from the Emerging Market (EM) strategy to the INTL [International] strategy”
- CLIG’s Opportunistic Value, REIT and Frontier FuM remains small at $254m.
- CLIG still believes new client money of $385m can be obtained by June 2022:
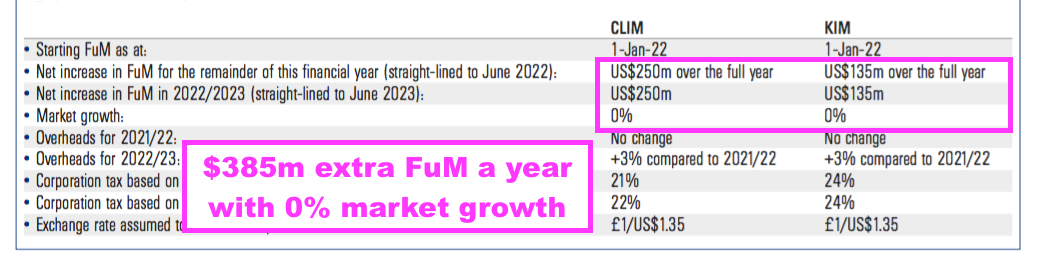
- CLIG also claimed another $385m could be obtained by June 2023.
- For perspective, the preceding H2 and this H1 experienced an aggregate outflow of $492m.
- An extra $385m is equivalent to only 3.5% of half-year FuM of $11.2b.
- Expecting new client money of a net $135m a year for Karpus feels ambitious, given the division has yet to attract net inflows since the merger.
- For a longer-term perspective, total FuM at CLIM and Karpus has grown from $6.2b to $11.2b since 2010 — equivalent to an average annual growth rate of 5.2%:
Funds under management: investment performance
- CLIG struggling to attract sizeable new money continues to feel odd given the claimed investment performances.
- CLIG said relative returns during this H1 were “strong“:
“Relative investment performance at both CLIM and KIM was strong during the six months ending 31st December 2021 and for calendar year 2021. All strategies with impactful FuM at both CLIM and KIM outperformed their respective benchmarks in calendar year 2021. These strong returns should buoy marketing efforts in 2022.”
- But CLIG did admit EM shares had trailed US shares:
“On the downside, the underperformance of EM equities over the past six months compared to other asset classes did weigh on the ability for CLIM’s FuM to grow during what otherwise was a strong equity rally,in particular in US equities.“
- Although the 2021 annual report displays five-year outperformances against various benchmarks…
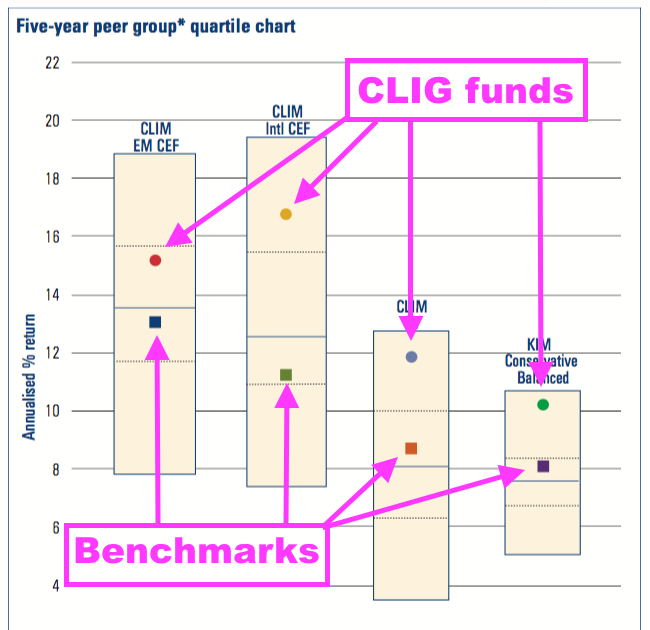
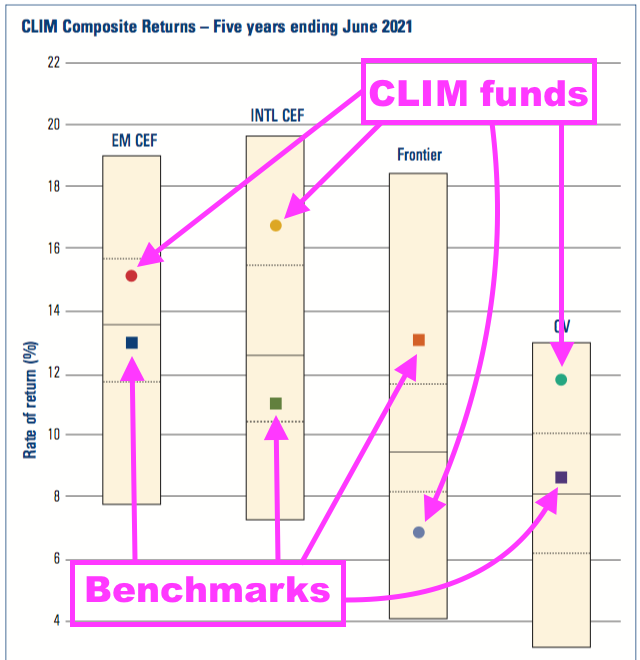
- …why aren’t more clients attracted to such progress?
- A major drawback is CLIM’s funds under-performing the wider global market.
- Prospective clients have no doubt compared CLIM’s funds to the MSCI World index rather than CLIM’s particular benchmarks.
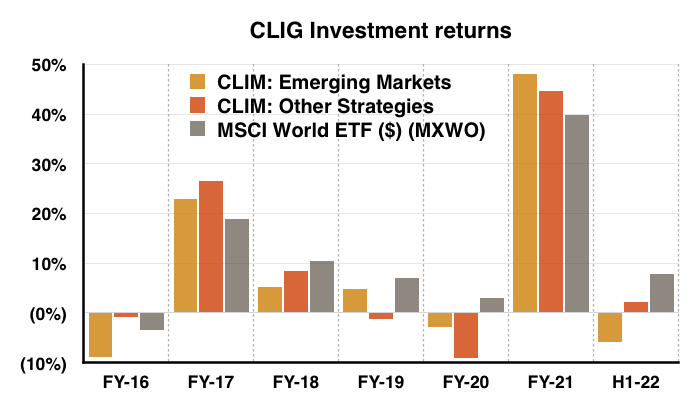
- The Invesco MSCI World ETF (MXWO) for example has gained 118% during the last five-and-a-half years (in USD), versus my estimated 84% investment return for CLIM’s EM approach and my estimated 82% for CLIM’s Other Strategies:
- CLIG hinted within the preceding FY 2021 statement that its ‘value’ style could outperform the MSCI World during the next five years:
“With the trailing P/E of the global index approaching 25x, expectations for the next five-year period should be moderated.“
- This year’s rough market will put CLIG’s investing to the test, although the early data is not promising.
- During CLIG’s Q3 2022 (January to March 2022), the MSCI World dropped 4% while my estimates indicate CLIG’s strategies returned a negative 9% or so (see Valuation).
- During CLIG’s Q4 2022 (April 2022 to date), the MSCI World has dropped 17%.
- A Q4 update during July will reveal how CLIG fared as the MSCI World fell 17%… and whether CLIG’s value style can in fact prosper during downturns.
Funds under management: fee rates
- CLIG said group fee rates had stayed at 74 basis points:
“Pleasingly, the blended net fee margin across both operating subsidiaries remained steady at an average rate of 74 bps“
- The trend for fee rates at CLIM is down:
| Year to 30 June | 2016 | 2017 | 2018 | 2019 | 2020 |
| CLIM net fee rate (bps) | 86 | 84 | 80 | 76 | 75 |
- Following FY 2020, CLIM fees rates were then reduced to:
- CLIG claims the fee-rate decline since 2016 has been due to the growing proportion of Other Strategy FuM, which levies lower charges.
- CLIG has never disclosed the exact fee rates charged on its EM and Other Strategy funds.
- My past algebra has indicated EM fees are applied at 90 basis points and Other Strategy fees are applied at 30 basis points to arrive somewhere close to the overall fee rates CLIG has declared:
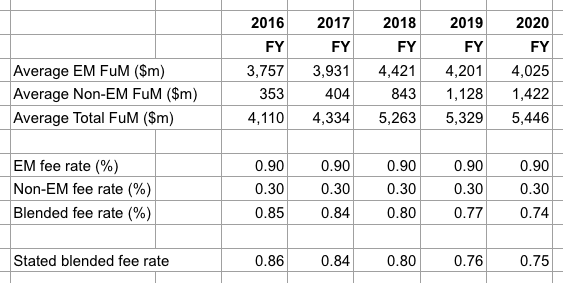
- CLIG disclosing the different fees charged by its strategies would remove any suspicion of clients chipping away at fees throughout all of CLIM’s funds.
- The fee rate at Karpus has dropped, too.
- The merger document (point 5) claimed Karpus enjoyed a “fairly stable” net fee rate of 80 basis points.
- But the FY 2021 results said Karpus fees were 77 basis points, and this H1 statement revealed Karpus fees at a net 76 basis points.
- The declining fee trends at CLIM and Karpus may well reflect clients mulling the 20 (or less) basis points charged for holding an MSCI World ETF.

Management
- Within my FY 2021 review I wrote:
“A boardroom of eleven directors, which CLIG says is “arguably… excessive”, does not seem ideal for decisive decision making and could explain why the business has been less dynamic than the likes of Liontrust Asset Management“
- An update following this H1 statement unveiled a board restructure, with three executives stepping down to become part of an executive committee.
- I welcome the new streamlined board and its “clearer accountability“:
“The Restructure is therefore expected to improve the efficiency of the Group’s corporate governance by creating a separate forum for executive leadership whilst providing for clearer accountability of the Group Executive Committee to the CLIG Board, and the CLIG Board to shareholders.“
- The management update also confirmed CLIG founder Barry Olliff will retire from his non-exec duties at the end of July. Mr Olliff was originally expected to step down at the 2021 AGM last October.
- The restructure and Mr Olliff’s departure will leave the board consisting of:
- The chief exec, and;
- Six non-execs, including Karpus founder George Karpus.
- The new-look board ensures CLIG meets various corporate-governance requirements (point 3a).
- But the re-jig may provide George Karpus with a greater say in boardroom discussions.
- Mr Karpus retired to become a CLIG non-exec soon after the Karpus merger and retains a significant 36%/£83m CLIG shareholding.

- Whether Mr Karpus is satisfied with CLIG’s all-round progress since the merger is not clear.
- After all:
- Fee rates still seem on a downward trend;
- Attracting significant new money still appears difficult, and;
- Investment returns still struggle to match the MSCI World index.
- A ShareSoc write-up confirmed US-resident Mr Karpus attended the 2021 AGM, and I hope both he and I can make the 2022 meeting.
- Meaningful developments at CLIG may well rest upon Mr Karpus, and whether he wishes the value of his £83m shareholding to advance (or not).
- Before the merger, Karpus FuM per employee was 27% greater and Karpus revenue per employee was 31% greater than the respective levels at CLIM (point 9).
- Perhaps Mr Karpus can somehow encourage CLIM’s employees to be as productive as those working at Karpus.
“My father taught me work ethic and to never quit. My mother taught me how to save and manage a budget. Together, they never made $20,000 in any year.“
- CLIG’s chief financial officer does not sit on the main board, which is not ideal for a business with operating profit running at a significant £30m a year.
- Maybe the lack of a board-level CFO is why the 2021 annual report disclosed an FRC accounting enquiry (point 5b).
- However, the CFO did unearth multiple dividend infringements that his board-level predecessors failed to notice (point 5c).
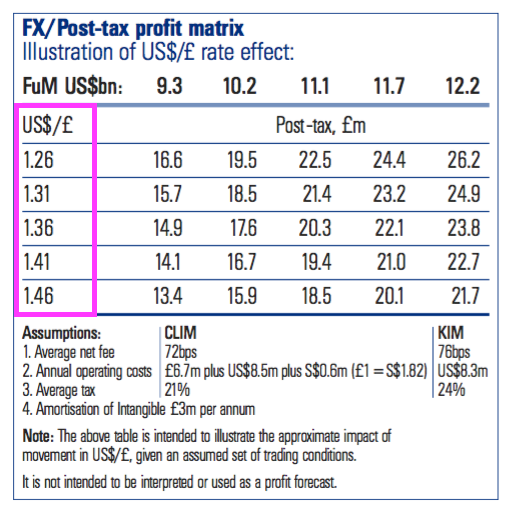
Exchange-rate/post-tax profit matrix
- CLIG’s exchange-rate/post-tax profit matrix has been revised and continues to confuse:
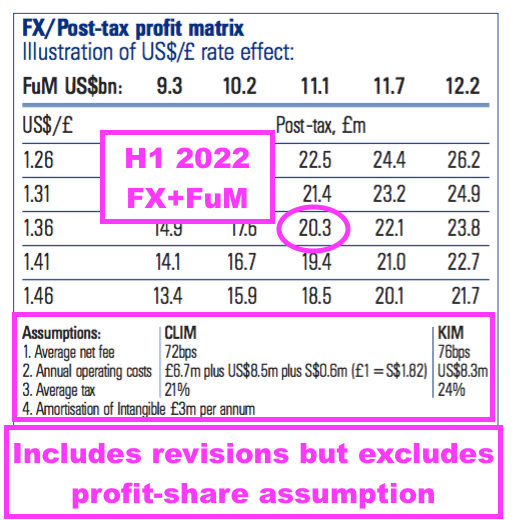
- Revisions to the matrix for this H1 include:
- CLIM costs increasing from ‘£6.3m plus $8m’ to ‘£6.7m plus $8.5m’;
- CLIM fee rates reducing from 73 basis points to 72 basis points;
- Karpus fee rates reducing from 77 basis points to 76 basis points, and;
- ‘Amortisation of intangible’ reducing from £3.3m to £3m.
- For this H1, the illustrative post-tax profit from the matrix appears to correlate with underlying earnings.
- CLIG said the GBP:USD averaged 1.36 during this H1, which gives earnings of £20.3m within the matrix for the current $11.1b FuM.
- CLIG declared underlying H1 earnings to be £12m, which doubled gives £24m:
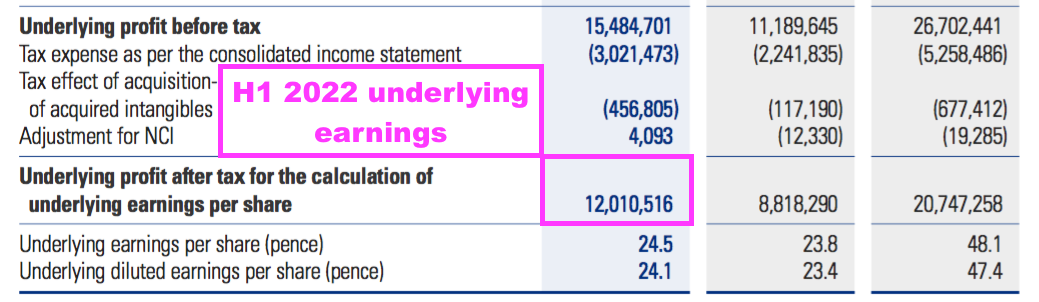
- The difference of almost £4m is (I think) explained by the amortisation of acquired intangibles, which is running at an annualised £3.8m and which (I presume) is included in the illustrative matrix.
- Exactly how the illustrative matrix figures are derived remain confusing.
- Previous matrices have noted the 30% profit share for the CLIM division:
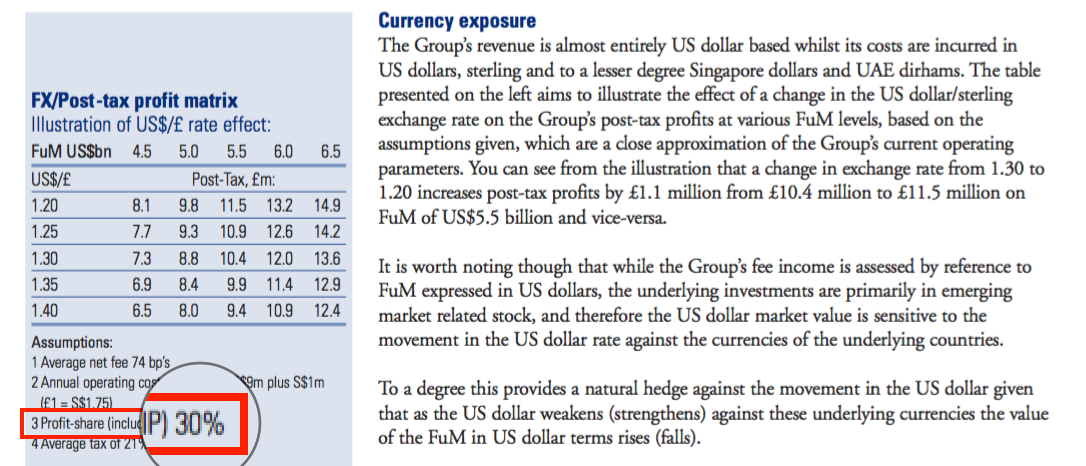
- But following the Karpus merger, the profit-share note has been removed and accurately correlating the matrix assumptions to the end post-tax figures has become impossible (at least for me!)
- Mind you, CLIG has always said the exchange-rate/post-tax profit matrix is “not intended to be interpreted or used as a profit forecast.“
- The preceding FY 2021 presentation indicated a 22% profit share, which suggested CLIM’s 30% profit share did not extend to Karpus employees:
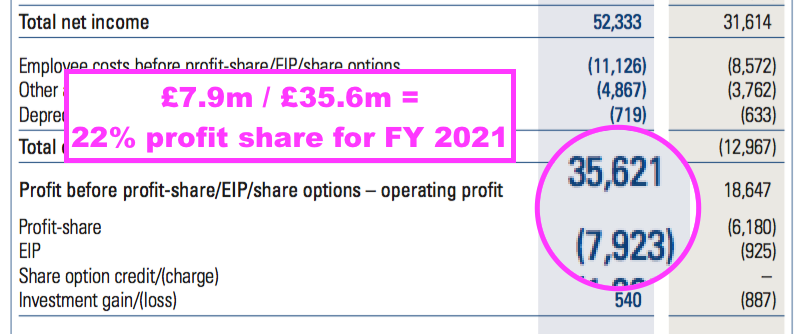
- However, the absence of a similar presentation table for this H1 — not a great sign in itself! — means the scope of the profit share remains somewhat uncertain.
- The profit share is important because earnings could be dampened if its scope expands to include Karpus employees.
- The 2021 annual report (point 6b) reveals this remuneration small-print:
“As a committee, we will be allocating time throughout the period to ensure a comprehensive assessment as well as considering differences in compensation practices between CLIM and KIM“
- That text may well be code for increasing the pay of Karpus employees.
- The 2021 annual report shows the sole Karpus executive being paid much less than the three CLIM executives…
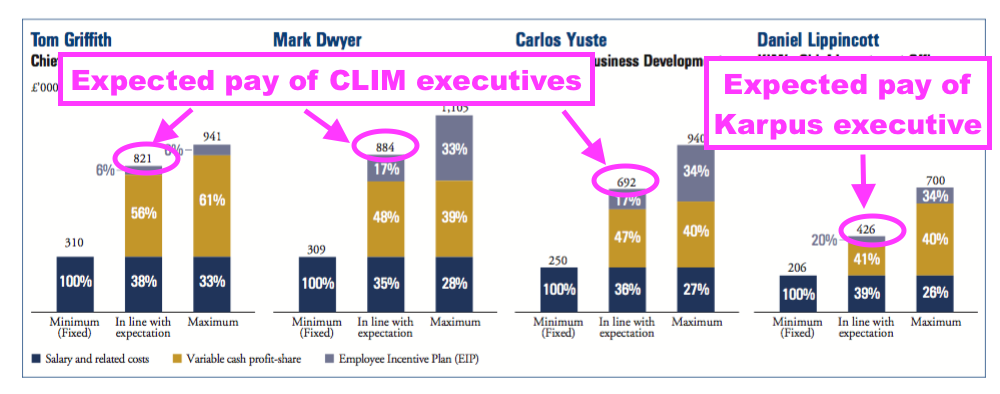
- …which may be rectified by the pay assessment.
- I do wonder whether the profit-share scheme explains CLIM’s lack of new client money.
- The scheme allows employees to collect a bonus even if new mandates are not won and/or earnings go nowhere.
- Between FYs 2017 and 2021, wages and salaries totalled £34m — but were almost doubled by aggregate profit-sharing payments of £29m.
Financials
- Paying more money to Karpus staff may one day trim CLIG’s very impressive operating margin.
- Excluding the amortisation charge associated with the Karpus merger, CLIG during this H1 converted gross fee income of £31.4m into an operating profit of £15.6m — giving a wonderful 49% margin.
- The wonderful margin is supported by Karpus.
- Before the merger, the original CLIM division reported an operating margin of approximately 35%.
- But the 2021 annual report small-print implied Karpus enjoys an incredible 65% operating margin (point 9b):
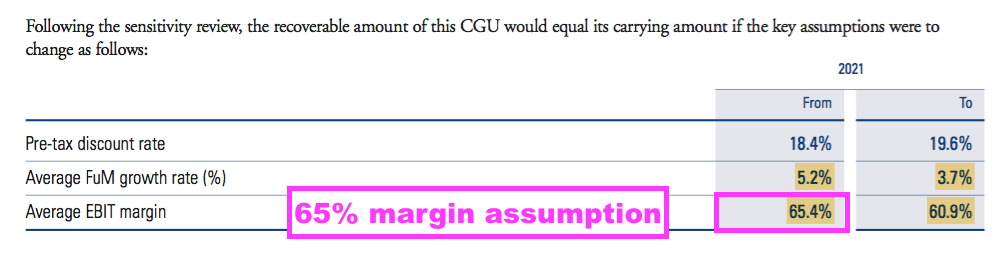
- Could George Karpus have some ideas for helping CLIM’s margin reach 65%?
- The largest balance-sheet item after the Karpus intangibles remains cash at a useful £24.5m. The books remain free of conventional bank debt.
- The aforementioned special dividend was paid during March and cost £6.6m.
- CLIG said:
“The Board is conscious that any accumulation of capital over and above that which is needed for capital investment, regulatory requirements and a prudential cash buffer should be returned to shareholders. Accordingly, the Board has also declared a special dividend of 13.5p per share, making this the second such special distribution in the last three years“
- These H1 figures therefore imply CLIG requires £17.9m (£24.5m less £6.6m) for “capital investment, regulatory requirements and a prudential cash buffer”.
- CLIG’s previous special dividend was declared during March 2019 when cash was £18.7m and the cost was £3.4m, which suggested the cash buffer then was £15.3m.
- Cash conversion for this H1 was very good. Adjusted earnings of £12.0m actually translated into net cash after tax, capex and lease payments of £12.5m.
- Following dividends of £9.5m, seed investments of £1.9m and £2.4m spent on shares for the Employee Benefit Trust (EBT), cash finished the half £1.1m lower.
- The EBT expense reflects the true cash cost of CLIG’s staff share schemes and is worth monitoring:
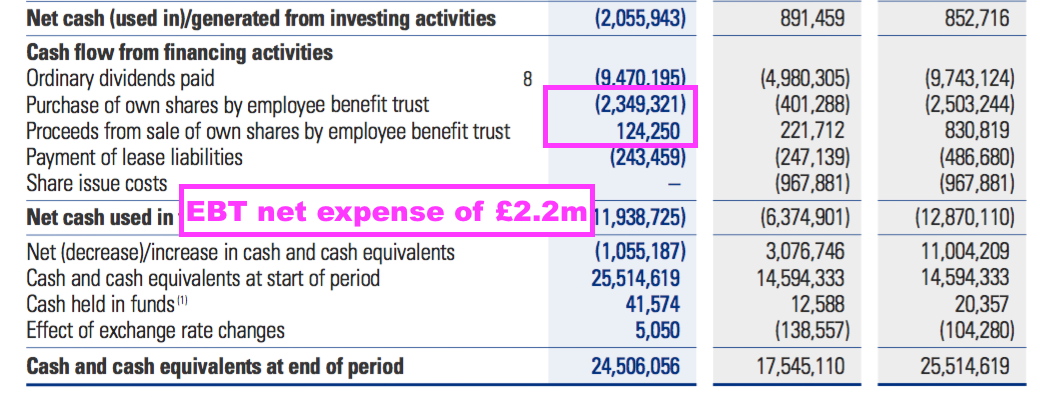
- Between FYs 2017 and 2021 the EBT spent £7.0m buying shares to satisfy option exercises, and in turn received £3.5m from those option exercises.
- But this H1 witnessed the EBT spend a net £2.2m on shares — much higher than the net £1.7m for FYs 2020 and 2021 and the sub-£1m for the years before.
- The EBT purchases during this H1 were not bargains (in hindsight). The buy prices were 475p, 515p and 525p.
- The associated £467k accounting charge for the EBT during this H1 was much less than the net £2.2m cash expense.
- Past years have shown the EBT cash expense broadly covered by the accounting charge, but hefty EBT buying and the quirks of IFRS 2 could mean the cash expense deviates notably from what’s applied within the income statement.
- CLIG’s accounts remain free of defined-benefit pension obligations.
Valuation
- The Q3 2022 (January-March) update published during April was mixed:
- Clients injected a net $147m to mark a second consecutive quarter of net FuM inflows. The last time CLIG enjoyed consecutive quarters of net inflows occurred between January and June 2020.
- FuM declining $885m including inflows of $147m implies a $1,032m negative investment movement.
- Down $1,032m on $11.2b is a 9.3% drop for the quarter. The MSCI World ETF meanwhile fell 4.2%.
- CLIG’s website shows FuM falling from $10.3b to $9.7b during April and May:
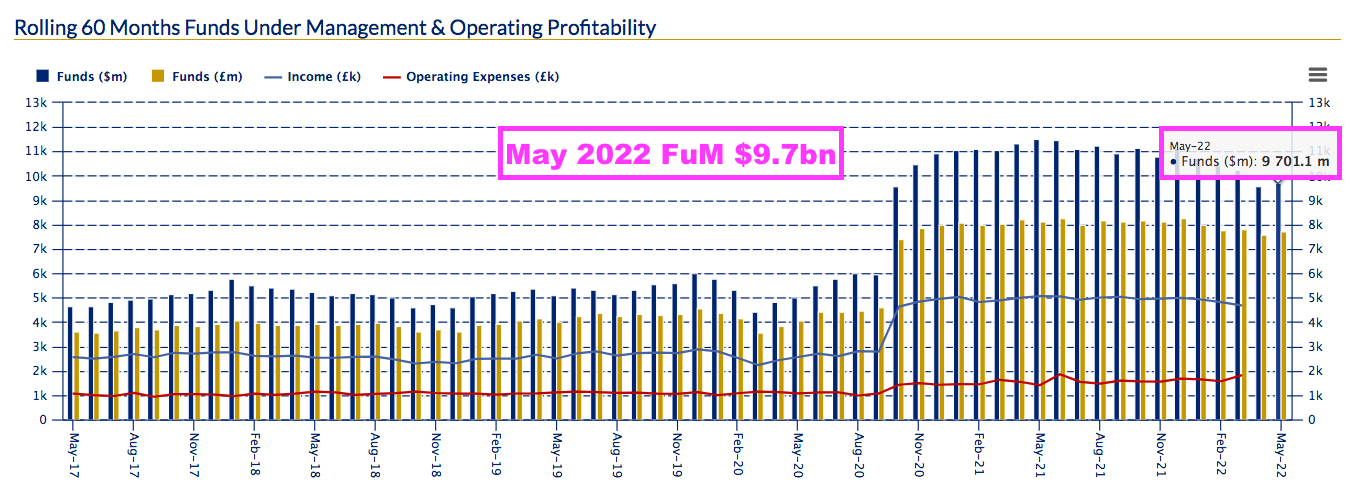
- FuM at $9.7b is 13% lower than seen at the end of this H1, and is a fraction higher than the $9.5b FuM seen during October 2020 when the Karpus merger completed.
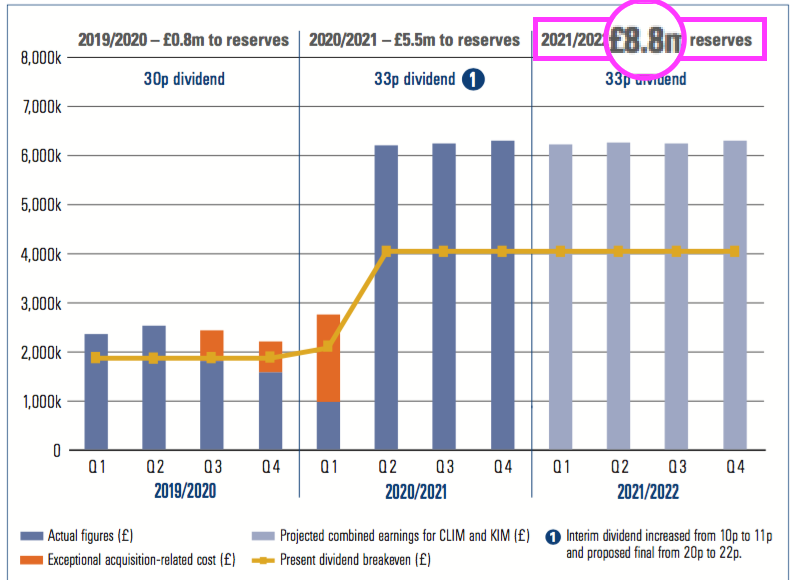
- CLIG’s dividend-cover chart has been revised. The previous version predicted earnings of £8.8m would be retained for FY 2022:
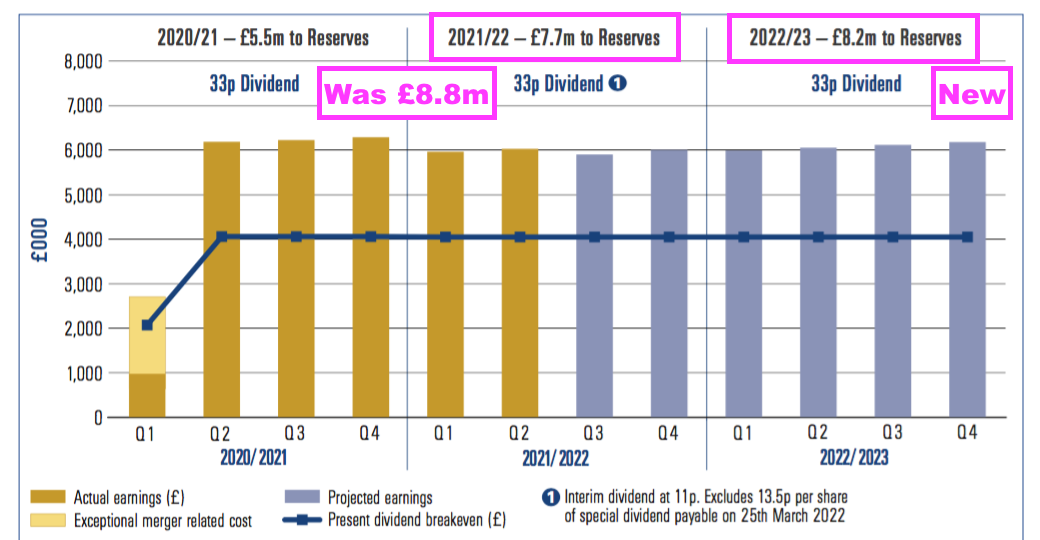
- But the latest version predicts £7.7m:
- £8.8m is equivalent to 17p per share and, when added to the 33p per share dividend, had implied FY 2022 earnings of 50p per share.
- The revised £7.7m is equivalent to 15p per share and, when added to the 33p per share dividend, now implies FY 2022 earnings of 48p per share.
- The new £8.2m retained-earnings projection for FY 2023 implies earnings of 49p per share.
- Doubling up this H1 performance gives underlying earnings of £24.0m or approximately 47p per share.
- The sums are all pointing to earnings around the 48p per share mark — but the sums are all based on FuM being maintained at $11b.
- FuM at the end of May was $9.7b, and subsequent market wobbles may have trimmed FuM lower.
- But the GBP:USD may come to the rescue. The projections above are based on £1 buying $1.35, while £1 presently buys $1.20.
- CLIG’s exchange-rate/post-tax earnings matrix sadly does not extend to £1:$1.20:
- I estimate from the matrix that FuM of $9.7b at £1:$1.20 would give earnings of almost £21m after adding back amortisation of £3m.
- Earnings of £21m equates to 41p per share and would cover the trailing 33p per share dividend 1.25 times and meet CLIG’s 1.2x target for rolling five-year periods.
- CLIG did say the final dividend could be lifted:
“The option of increasing the final dividend at year end, dependent upon market conditions, remains open.“
- However, FuM sliding to $9.7b may well keep the final payout at 22p per share.
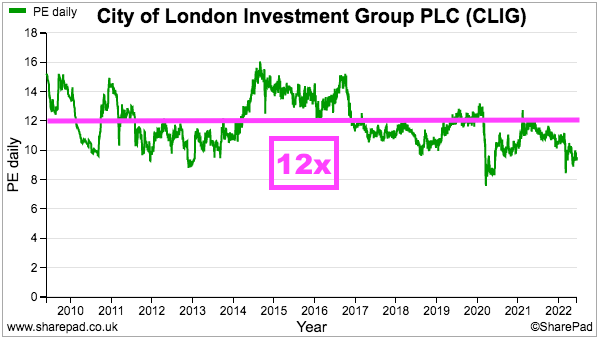
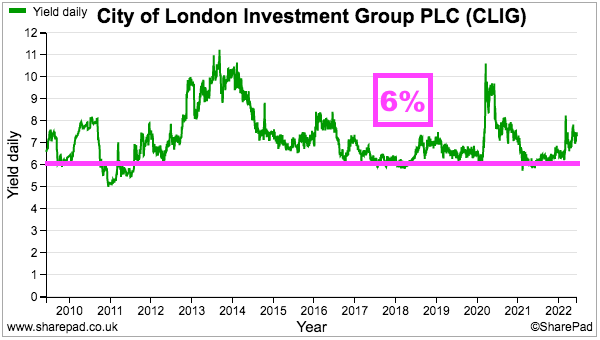
- My 41p earnings guess and the trailing 33p per dividend put the 450p shares on a multiple of 11x and yield of 7.3%.
- CLIG’s rating does not look expensive, but the trailing P/E has frequently been less than 12 and trailing yield has almost always offered more than 6%:
- Additional perspective on future returns is provided by CLIG’s KPI.
- CLIG is one of the very few quoted companies with a (commendably public!) share-price ambition:
“We retain the share price KPI to show the total return of CLIG over a market cycle. The goal of this KPI is for the total return (share price plus dividends) to compound annually in a range of 7.5% to 12.5% over a five-year period.
- The share-price KPI was introduced within the results for FY 2019, the year-end share price for which was 406p.
- A five-year CAGR at the KPI’s minimum 7.5% requires a 177p per share return from that 406p by 30 June 2024.
- The share price has since improved 46p to 450p while dividends have come to 105.5p per share. Just another 25.5p is therefore required by 30 June 2024 to meet the minimum five-year KPI.
- From the recent 450p, CLIG sustaining a 33p per share dividend would mean the share price has to advance by only 31p by June 2027 to meet the minimum five-year KPI.
- CLIG noted during this H1:
“This KPI is meant to stretch the management team, without incentivising managers to take undue levels of risk.“
- Assuming no deep bear market, a 31p share-price gain and a steady dividend during the next five years does not seem that stretching for management to achieve.
Maynard Paton

City of London Investment (CLIG)
Trading Update for the year to 30 June 2022 published 19 July 2022
A mixed update. New client money continues to trickle in but total funds under management (FuM) have been thumped by poor investment returns during what has been a very weak market. Here is most of the text interspersed with my comments:
——————————————————————————————————————
City of London (LSE: CLIG), a leading specialist asset management group offering a range of institutional and retail products investing primarily in closed-end funds (“CEFs”), provides a pre-close trading update for its financial year ended 30 June 2022. The numbers that follow are unaudited.
On a consolidated basis, Funds under Management (FuM) were US$9.2 billion (£7.6 billion) at 30 June 2022. This compares with US$11.4 billion (£8.3 billion) at the Group’s year end on 30 June 2021. A breakdown by strategy follows:
Investment performance was behind relevant benchmarks for the bulk of CLIM’s assets due to a combination of country allocation in the Emerging Market strategy and NAV performance at the underlying closed-end funds in the International and Opportunistic Value strategies. KIM’s equity and fixed-income strategies outperformed their market indices over the period, while US equity lagged its benchmark.
Net investment flows were US$102 million for the Group over the period, with CLIM posting net gains, while KIM saw net outflows as clients reduced exposure to markets due to ongoing volatility in the second half of the year. After a pause in 2020 a renewed marketing emphasis over the period, combined with the excellent long term track record was rewarded for the International CEF Strategy.
With regard to business development, the Group continues to develop an active pipeline across all of its major CEF offerings.
——————————————————————————————————————
The main positive from this Q4 statement was the $102m of new client money for the full year — meaning $68m on inflows were enjoyed during Q4. In fact Qs 2 (+$59m), 3 (+$147m) and 4 (+$68m) all enjoyed inflows of net client money and is the longest run of positive inflows since the 9 months to September 2019.
The International strategy was the star attraction for new money, capturing $453m during the full year and $183m for Q4. Q4 was yet another quarter for money to leave Karpus ($44m); since the 2020 merger, FuM of $301m has left Karpus and the division has yet to report a quarter with inflows.
Investment performance was poor, with the $1b lost due to market movements during Q3 extended by a further $1.1b during Q4. The full year saw $2.3b lost to market movements, representing a hefty 20% of the $11.4b FuM seen at the start of the financial year. An MSCI World ETF (MXWO, denominated in USD) fell 15% during the same twelve months. H2 saw a negative 19% return for CLIG’s FuM, versus a 20% fall for the MSCI World.
Overall, FuM fell 19% for the full year and 17% during H2.
Q4 ended with 40% of FuM invested in the group’s traditional Emerging Market strategies, the lowest proportion ever for CLIG. 23% of FuM was represented by International and other CLIM approaches, while 37% was held by Karpus.
——————————————————————————————————————
Operations
The Group’s income currently accrues at a weighted average rate of approximately 73 basis points of FuM, net of third party commissions.
The Group’s overheads for the year to 30 June 2022 are expected to be £19.7 million (2021: £16.8 million). “Fixed” costs are c.£1.7 million per month, and accordingly the run-rate for operating profit, before profit-share and amortisation of intangibles is approximately £2.8 million per month based upon current FuM and a US$/£ exchange rate of US$1.2178 to £1 as at 30 June 2022.
For the year to 30 June 2022, the Group estimates that the unaudited profit before amortisation of intangibles and taxation to be approximately £27.2 million, including non-controlling interest (“NCI”) loss of £0.1 million (2021: £27.2 million profit before amortisation of intangibles, exceptional merger costs of c. £1.7 million and taxation, NCI profit of nil) (2021: £25.5 million profit before amortisation and taxation).
Profits after an anticipated tax charge of £5.0 million (representing 22% of profits before taxation) will be approximately £18.1 million (2021: profits of £17.0 million after a tax charge of £5.3 million, representing 19% of profits before exceptional merger costs and taxation). Basic and fully diluted earnings per share are expected to be 37.1p and 36.6p respectively (2021: 39.4p and 38.8p).
Dividend
The Board is proposing to recommend a final dividend of 22p per share (2021: 22p), subject to approval by shareholders at the Company’s Annual General Meeting to be held on 31 October 2022. This would bring the total dividend payment for the year to 46.5p, including the special dividend of 13.5p paid in March (2021: 33p, special dividend nil). Rolling five-year dividend cover, excluding the special dividend equates to 1.22 times (2021: 1.29 times).
——————————————————————————————————————
Fee rates at 73 basis points compares to 74 basis points mentioned within the preceding H1 results and continues the long-standing trend of lower revenue from client money. That trend is due to greater International money that charges lower fees than the group’s traditional Emerging Market funds, alongside I suspect general fee pressure from clients.
For the full year, estimated tax of £5m suggests underlying full-year earnings will be £27.2m less £5m = £22.2m = 44p per share.
But underlying profit before tax was £15.5m for H1, so £27.2m for the full-year gives £11.7m for H2. H2 doubled up gives £22.7m, then less 22% tax gives earnings of £18.3m or 36p per share — just about covering the maintained 33p per share ordinary dividend.
——————————————————————————————————————
Dividend cover template
Please see dividend cover template attached here:
The dividend cover template shows the quarterly estimated cost of dividend against actual post-tax profits for last year, the current year and the assumed post-tax profit for next financial year based upon specified assumptions.
——————————————————————————————————————
The dividend cover template included notable decreases to projected retained earnings.
For 2021/22, the £5.6m now expected to be added to reserves is equivalent to 11p per share and, alongside the 33p per share dividend, confirms full-year earnings of 44p per share.
But for 2022/23, the £3.9m now expected to be added to reserves is equivalent to 8p per share and, alongside the 33p per share dividend, implies full-year earnings of 41p per share.
The difference between that 41p per share and my 37p per share calculation may in part be due to i) incoming client money, and; ii) currency fluctuations.
The dividend template shows CLIG (still) expecting to win new client money of $385m during the forthcoming twelve months. My 37p per share guess assumes FuM remains as per the average of Jan-Jun 2022 of $10b. FuM at the end of Q4 was $9.2b, which if maintained for the next year could mean my 37p per share EPS guess is a bit optimistic.
CLIG’s income to almost entirely denominated in USD, so a weaker GBP helps CLIG’s earnings. GBP:USD was 1.38 this time last year and is now approximately 1.20. Mind you, CLIG’s preceding H1 said FuM of $9.3b at GBP:USD 1.26 could give earnings of £16.6m (33p per share), which I estimate could be £17.5m (35p per share) at GBP:USD 1.20:
35p per share is just enough to cover the 33p per share dividend.
Maynard