24 March 2023
By Maynard Paton
Results summary for S & U (SUS):
- A seemingly lower-than-normal bad-debt charge underpinned a record H1 performance, which in turn supported fresh highs for net asset value (NAV) and the dividend.
- Mixed signals remain at the primary motor-finance division, with encouraging collection rates offset by lingering pandemic-related provisions and talk of “choppy waters ahead” testing “policies and procedures“.
- Bumper progress at the property-loan operation heralded the subsidiary declaring its maiden dividend and another divisional executive appointed to the board.
- Debt remains under control at 42% of customer loans, although admin and other costs have reached their highest combined proportion of revenue since at least FY 2016.
- Management’s webinar commentary cited a broker’s £33 price target, with subsequent RNSs suggesting the £22 shares are not expensive at a potential 1.17x NAV with a 6% income. I continue to hold.
Contents
- News links, share data and disclosure
- Why I own SUS
- Results summary
- Revenue, profit, net asset value and dividend
- Advantage Finance: Loan provisions
- Advantage Finance: Collections
- Advantage Finance: Overdue accounts and payment holidays
- Advantage Finance: New loans
- Aspen Bridging
- Financials
- Valuation
News links, share data and disclosure
News: Interim results, presentation and webinar for the six months to 31 July 2022 published/hosted 27 September 2022, trading statement published 08 December 2022, trading statement published 09 February 2023 and appointment of executive director published 14 February 2023.
Share price: 2,200p
Share count: 12,150,760
Market capitalisation: £267m
Disclosure: Maynard owns shares in S&U. This blog post contains SharePad affiliate links.
Why I own SUS

- Provides ‘non-prime’ credit to used-car buyers and property developers, where disciplined lending and reliable service have supported an enviable dividend record.
- Boasts veteran family management with a 40-year-plus tenure, 42%-plus/£111m-plus shareholding and a “steady, sustainable” and organic approach to long-term expansion.
- Very promising property-loan subsidiary offers the prospect of improved group progress post-pandemic.
Further reading: My SUS Buy report | All my SUS posts | SUS website
Results summary
Revenue, profit, net asset value and dividend
- An encouraging AGM statement last May…
“Following the Group’s “resounding results” announced in S&U’s annual report and our “quiet but determined confidence” in building on them even in uncertain times, we are pleased to report further steady progress.
Group profit before tax for the period was above budget for both Advantage Finance, our motor finance division, and Aspen Bridging, our property bridging division.“”
- …supported by a positive update during August…
“Although it is only just over two months since our last trading update, S&U is pleased to report that both its motor and property bridging divisions continue to outperform its expectations, both in transactions growth, and in the quality of its book and the new business it is writing.”
- …had already indicated these H1 2023 figures would display positive progress.
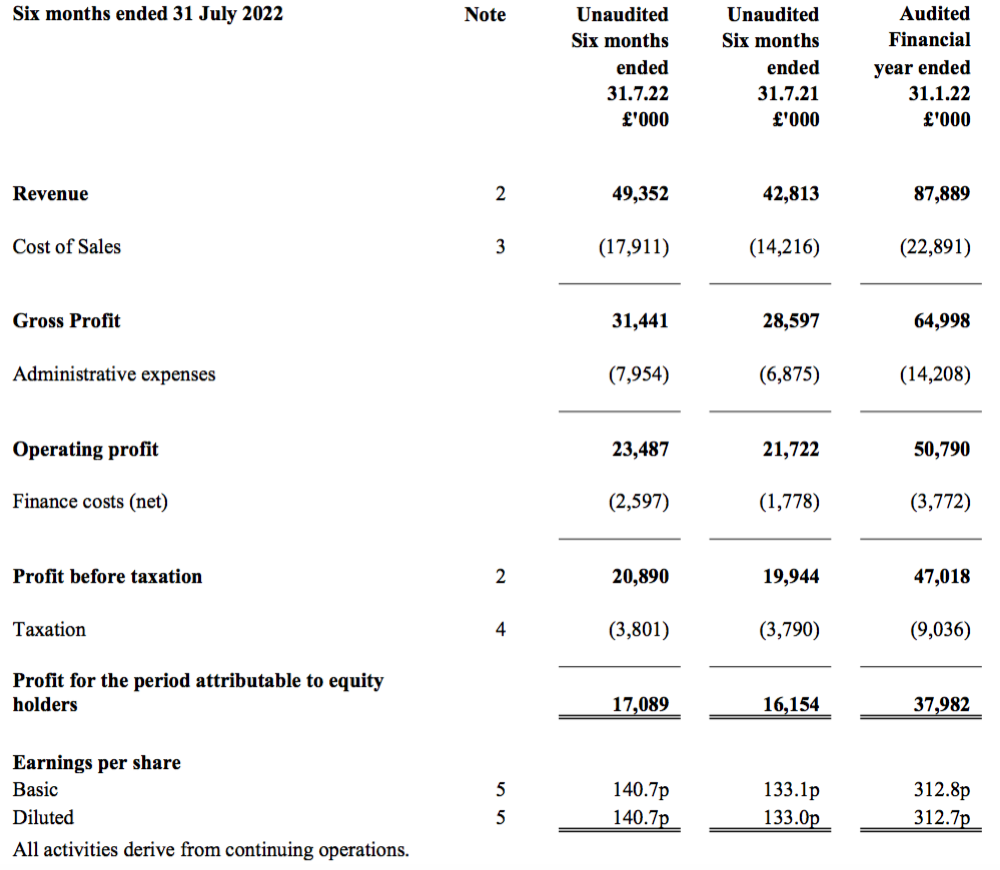
- Revenue improved 15% to £49m to set a new record for any H1 or H2:
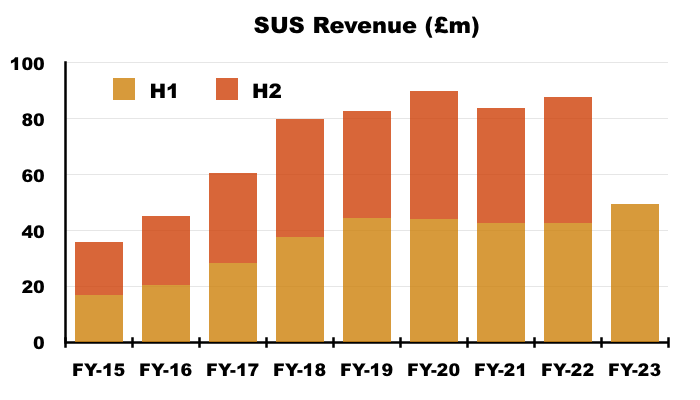
- Pre-tax profit meanwhile gained 5% to £21m to set a new record for H1:
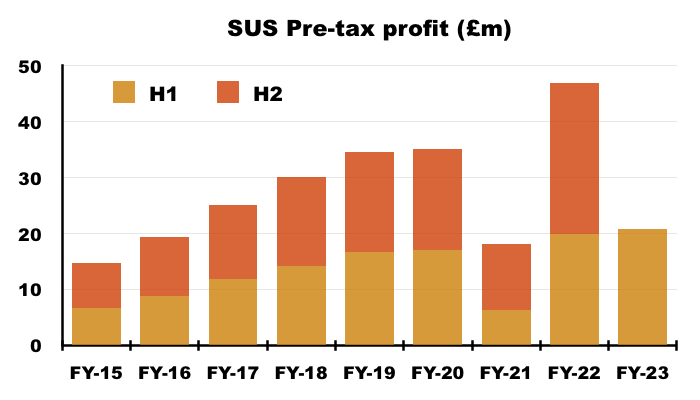
- SUS recalled the comparable H1 2022 profit was “inflated by a lower than normal impairment charge“:
“Meanwhile, this year’s profit increase of just over 5% is struck against last year’s results which we reported as inflated by “a lower than normal impairment charge at Advantage Finance.” The latter resulted from excellent collections offsetting pandemic-era provisions“
- The impairment charge for the comparable H1 2022 was £5.1m while the impairment charge for this H1 2023 was £6.5m.
- Prior to the pandemic, SUS’s impairment charge was running at approximately £17m a year.
- The £6.5m impairment charge for this H1 therefore also appeared “lower than normal“.
- As a reminder, FY 2021 suffered additional pandemic-related loan impairments of £20m, while FY 2022 — and it seems this H1 2023 — subsequently enjoyed lower provisions after a proportion of the expected Covid-19 bad debts were reversed:
- The provision fluctuations relate entirely to Advantage Finance, the group’s motor-loan subsidiary (see Advantage Finance: Loan provisions).
- SUS one day returning to pre-pandemic £17m yearly provisions was not discussed within this H1 statement nor during the accompanying webinar.
- The “lower than normal” provisioning for this H1 therefore flattered the group’s performance and financial ratios.
- SUS’s property-loan division, Aspen Bridging, meanwhile delivered an “excellent” performance.
- Group profit continues to be dominated by Advantage Finance…
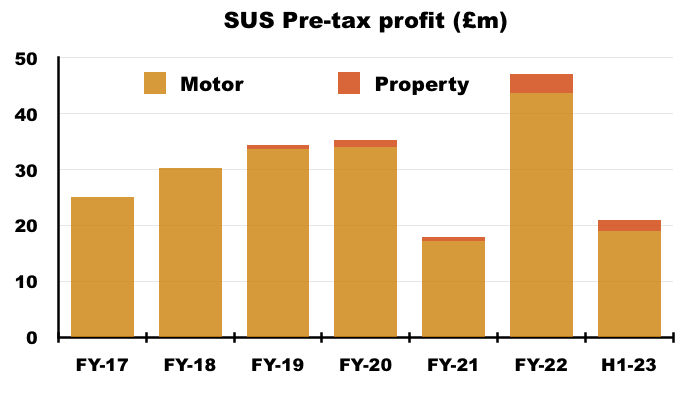
- …although management disclosed during the preceding FY 2022 webinar that Aspen could grow to represent 20% of group profit during the “next few years“.
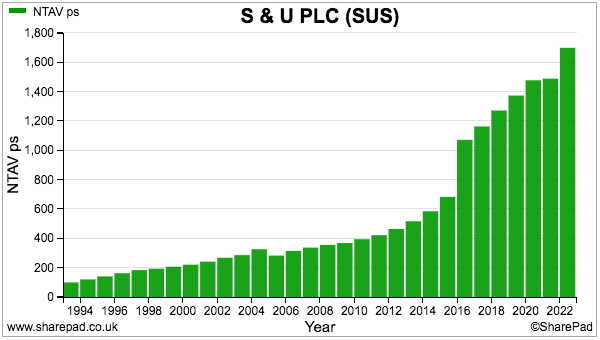
- This H1 performance increased net asset value (NAV) by £6m to £212m — equivalent to £17.49 per share and a fresh NAV record.
- NAV per share has gained 49% during the last five years and supports 80% of the £22 share price (see Valuation):
- After the FY 2022 dividend rebounded 40% following the 25% cut during pandemic-blighted FY 2021, this H1 announced an understandably moderated payout increase of 6%.
- SUS pays three dividends a year, and February’s update revealed the group’s second interim payout would match the H1 advance and also rise 6%.
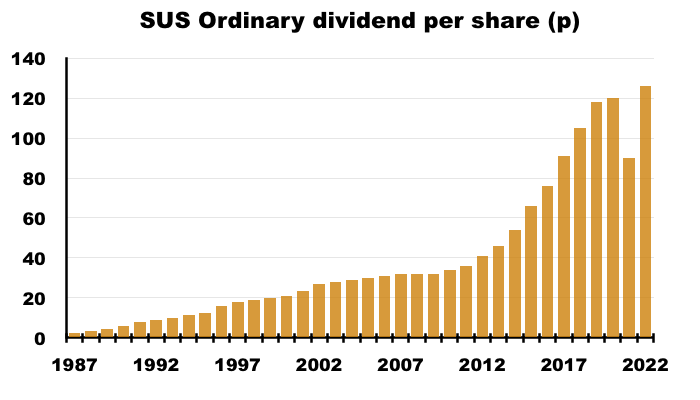
- The 6% uplifts put the trailing twelve-month dividend at a record 130p per share, and suggest the final FY 2023 payout will rise 6% as well.
- Companies House shows the payout expanding 50-fold since 1987:
Advantage Finance: Loan provisions
- SUS describes Advantage Finance customers as ‘non-prime’ and the 2022 annual report (point 2a) outlines their typical circumstances:
“This long experience has enabled Advantage to gain a significant understanding of the kind of simple hire purchase motor finance suitable for customers in lower- and middle-income groups. Although decent, hardworking and well intentioned, some of these customers may have impaired credit records, which have seen them in the past unable to access rigid and inflexible “mainstream” finance products.”
- Advantage borrowers previously took on motor loans of approximately £6.3k, but the average surpassed £7k during FY 2022 and has since increased to £7.7k:
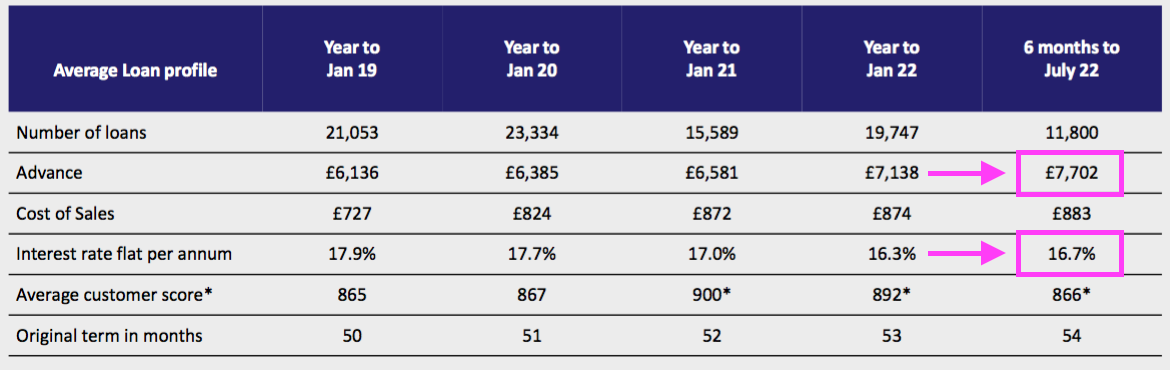
- Management said during the webinar the greater loan size in part reflected rising used-vehicle prices.
- The flat 16.7% interest rate charged by Advantage during this H1 was a fraction higher than the 16.3% charged during FY 2022 — which was the lowest rate charged for at least ten years:
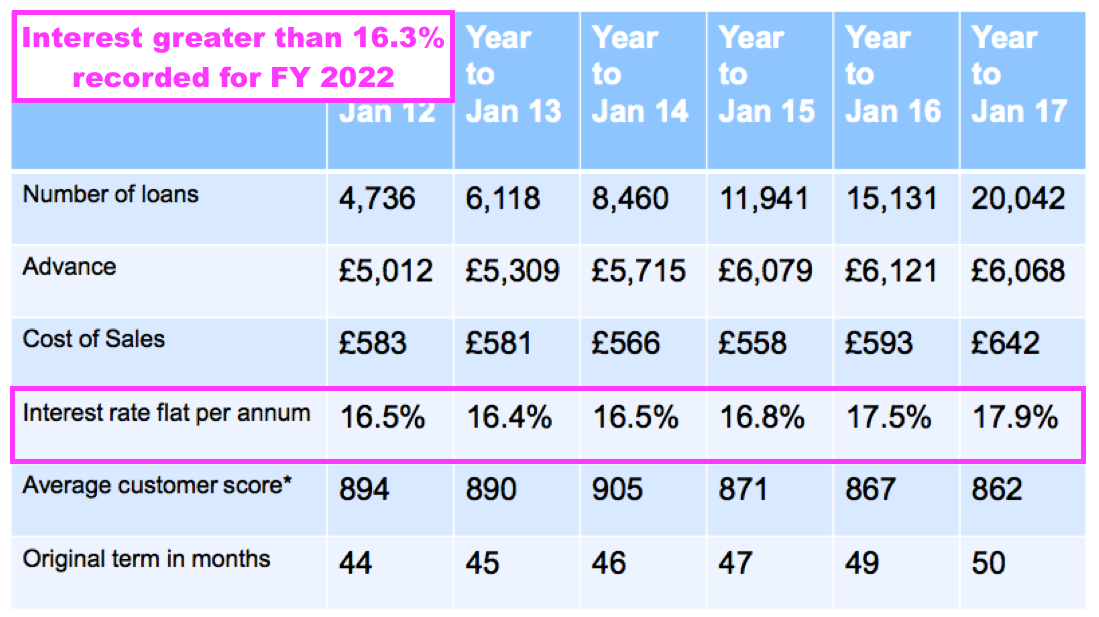
- The increase to 16.7% was due to a higher proportion of greater-risk Tier C/D/E customers:
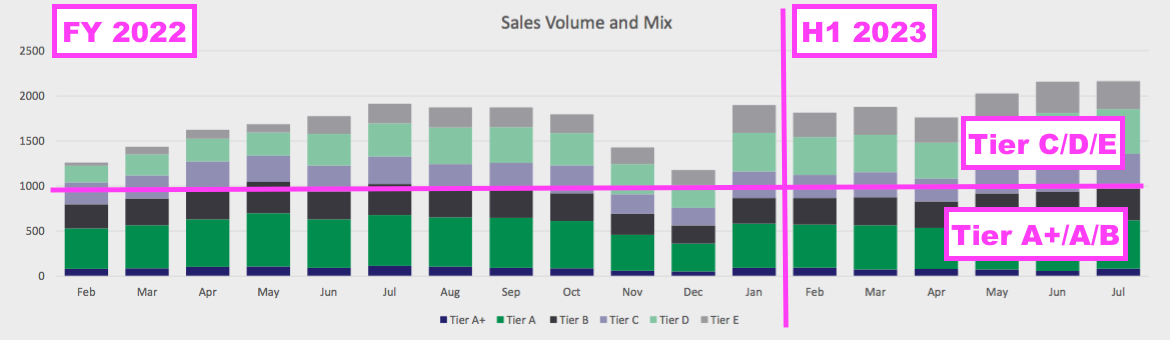
- Management confirmed during the webinar that different interest rates were applied to different customer tiers, and that the tier mix was “well managed” and was returning to the “traditional market” Advantage served before the pandemic.
- Borrowing £7.7k at a flat 16.7% a year over 54 months leads to interest of £5.8k and a total repayable figure of £13.5k before administration and other fees.
- Before the pandemic, the typical Advantage borrower would have eventually repaid approximately £11k of that £13.5k. But I estimate the eventual repayment would have fallen to less than £10k during the pandemic.
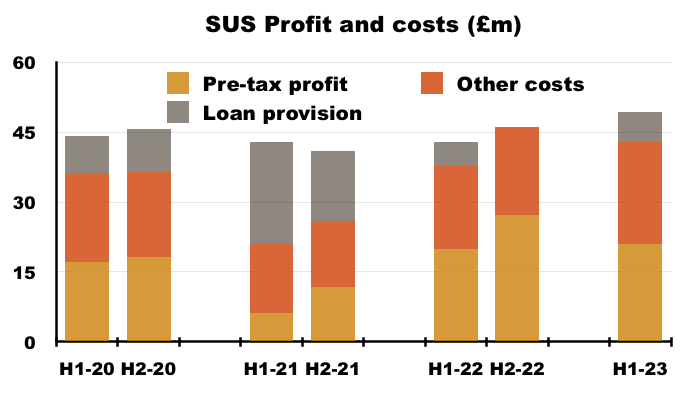
- The chart below shows the impact of the extra £20m Covid-19 bad-debt provision (grey boxes) on Advantage’s profit during FY 2021:
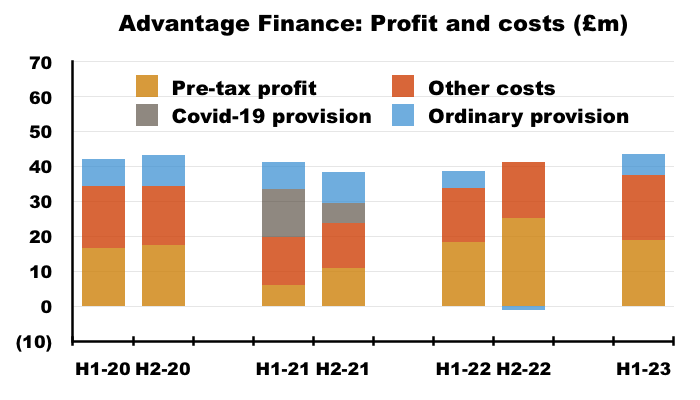
- The ordinary provision (blue boxes) was between £16m and £17m for FYs 2019 and 2020, versus only £6m for this H1 2023.
- A pre-pandemic level of impairment for this H1 of, say, £8m, would have increased Advantage’s loan provision by £2m and reduced the division’s pre-tax profit from £19m to £17m — which is just a fraction greater than the profit recorded for H1s 2019 and 2020.
- Note that SUS has never made clear what proportion of the extra £20m Covid-19 provision has since proved to be unnecessary. The chart above shows H2 2022 enjoying a net £1m bad-debt write-back due to better-than-expected customer repayments.
- Whether ‘normal’ provisions from here will run at the pre-pandemic £17m rate is hard to say.
- The presentation stated only that the lower H1 impairment charge was “unlikely to repeat this year [during H2] in a less favourable economic climate”.
- SUS’s commentary on credit quality was mixed:
“Most importantly, credit quality, measured by both bad debt and default levels and by collections against due, continues to be strong and improving. However, anticipating a more challenging collections environment ahead, S&U’s balance sheet provisions remain at £95m. “
- Advantage’s total bad-debt provision increased by £3m to £94m:
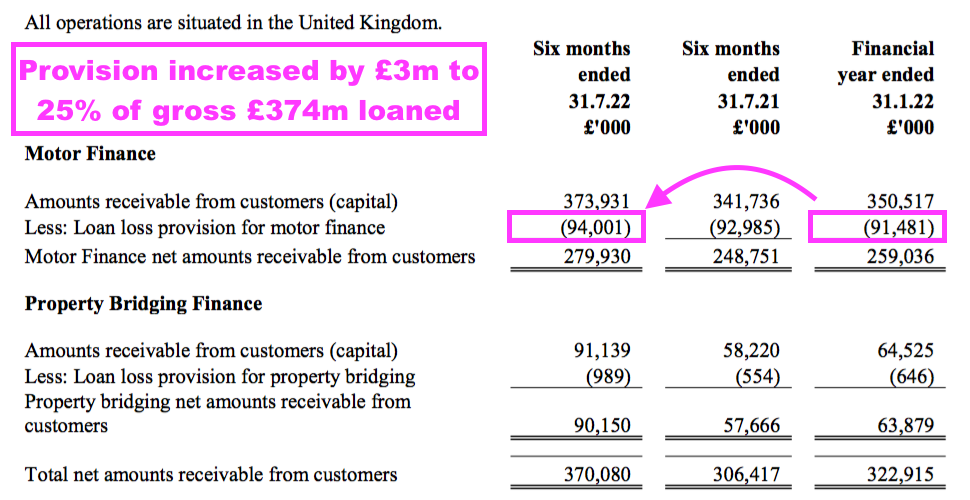
- The bad-debt provision of £94m represented 25% of the total £374m loaned:
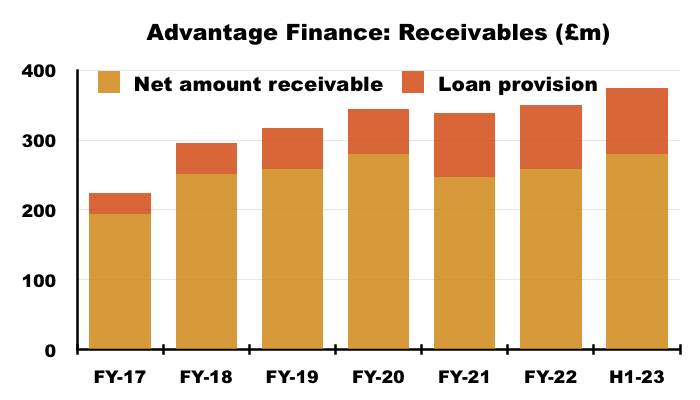
- The proportions for FYs 2021 and 2022 were 27% and 26% respectively.
- For pre-pandemic FYs 2019 and 2020 though, Advantage’s provisions ran at 18% of total money lent.
- Mind you, given additional Covid-related provisions were £20m during FY 2021, the total non-pandemic provision could be £74m (£94m less £20m).
- A £74m provision versus the £374m total loaned is 20% — higher than the 18% pre-pandemic proportion for FYs 2019 and 2020, and ongoing evidence perhaps of adverse expectations concerning future bad loans.
- Indeed, the 2022 annual report (point 10b) revealed SUS now includes inflation predictions within its bad-debt calculations.
- The small-print indicated a £402k impairment loss might occur for every 0.5% advance to the inflation rate… which could mean headline inflation having marched from 5% to 10% has created an extra £4m impairment.
- SUS’s earlier inflation guess proved very wide of the mark for FY 2023 (point 3a):
“Current trends in interest rates, although upward, are in our view unlikely to be very significant particularly since inflation is unlikely to persist at more than 4% throughout the year.”
Advantage Finance: Collections
- Customer repayments ultimately determine the quality of Advantage’s loan book and underwriting process.
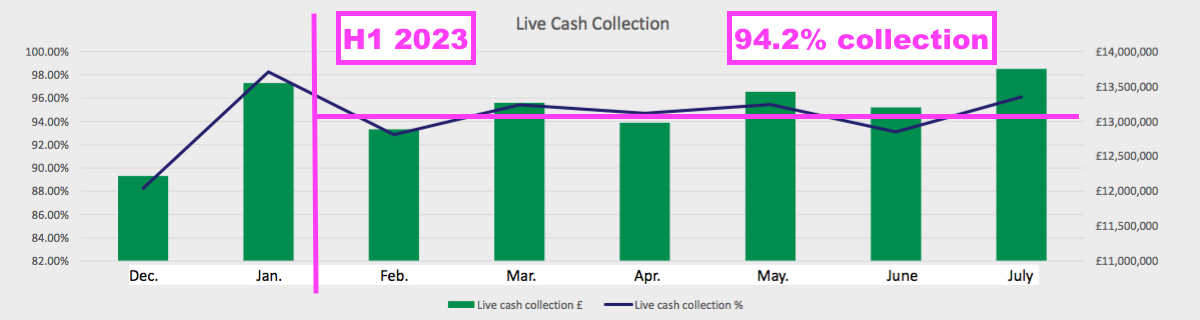
- SUS said Advantage’s collections during this H1 were “robust” and “well above budget“.
- The collection rate, at 94.2% of due, exceeded:
- the 93.2% for the preceding FY 2022;
- the 83.3% for the pandemic-disrupted FY 2021, and;
- the 93.5% for pre-pandemic FY 2020:
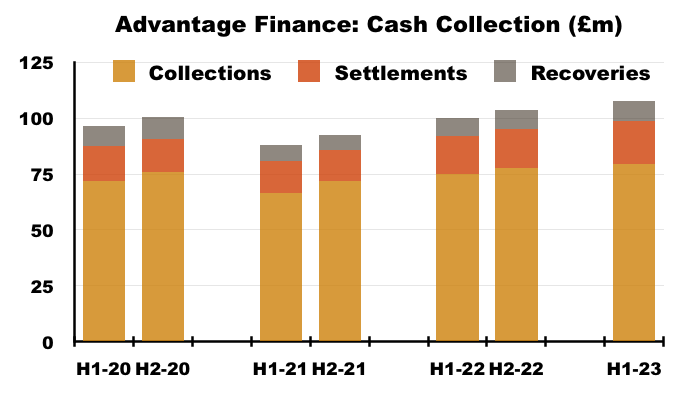
- Collections, recoveries and settlements for this H1 amounted to £108m, which was more than 10% greater than the total collected during pre-pandemic H1 2020:
- SUS said Advantage’s “robust” collection rate was in part made possible by the division’s customer data:
“Nearly a quarter of a century’s data and a broader range in our panel of credit reference agencies, have allowed Advantage to expand its new customers range, improve average yield rates and maintain excellent collections quality.”
- Savvy data analysis is part of SUS’s competitive advantage:
“Advantage constantly studies customer payment patterns and refines the data surrounding them. It can then adjust affordability calculations and extrapolate future cost of living trends with some accuracy.“
Advantage Finance: Overdue accounts and payment holidays
- The proportion of Advantage customers up to date with their payments increased to 71% during this H1:
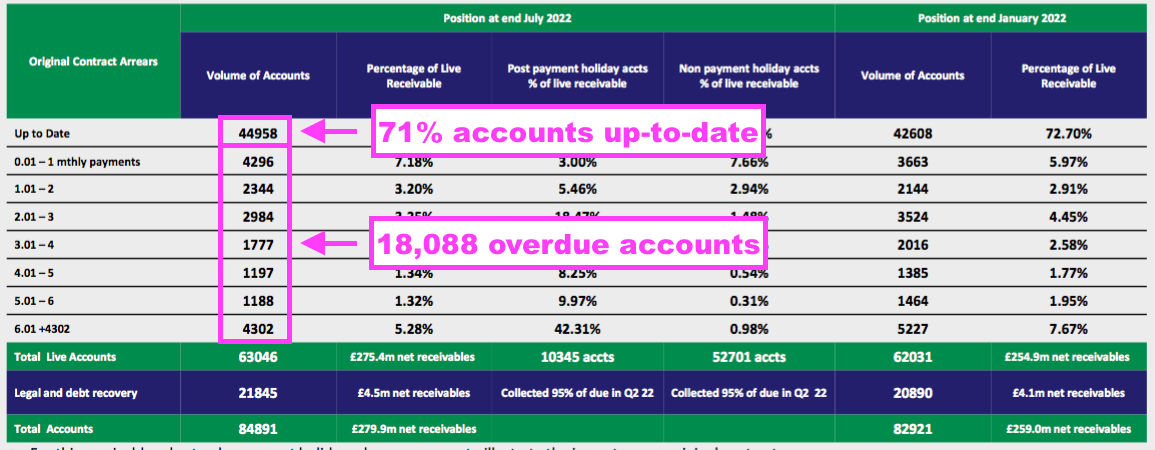
- Up-to-date customers represented 69% of all Advantage accounts at the preceding FY 2022, and 63% at FY 2021:
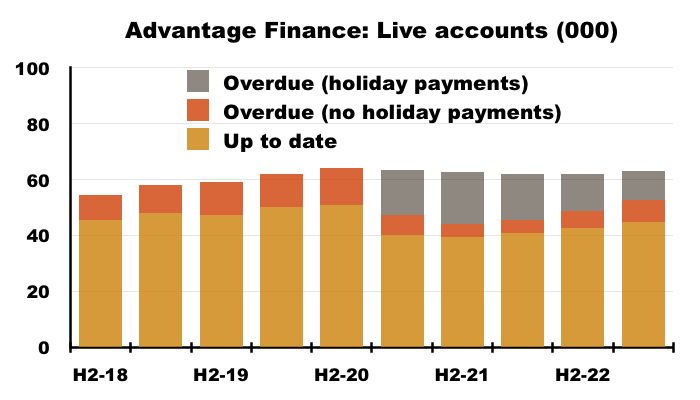
- The proportion for pre-pandemic FY 2020 was 79%, and was 84% for H1 2018 and a super 90% for FY 2016.
- Note that the 71% of up-to-date accounts represent 77% of total money owed.
- The up-to-date 71% remains skewed by customers that enjoyed an FCA-authorised payment holiday during the pandemic.
- Payment holidays lasted up to six months and all payment holidays ended on 31 July 2021.
- SUS deems customers that took a payment holiday as ‘overdue’, even if they have repaid as normal following their payment holiday.
- 10,345 payment-holiday customers were still active during this H1, versus a peak of 18,768 during FY 2021.
- 2,873 payment-holiday customers cleared their accounts (one way or another) during this H1, indicating payment-holiday customers could have all disappeared from the loan book within two years.
- Payment-holiday customers appear to be repaying at a very acceptable 95% of due…
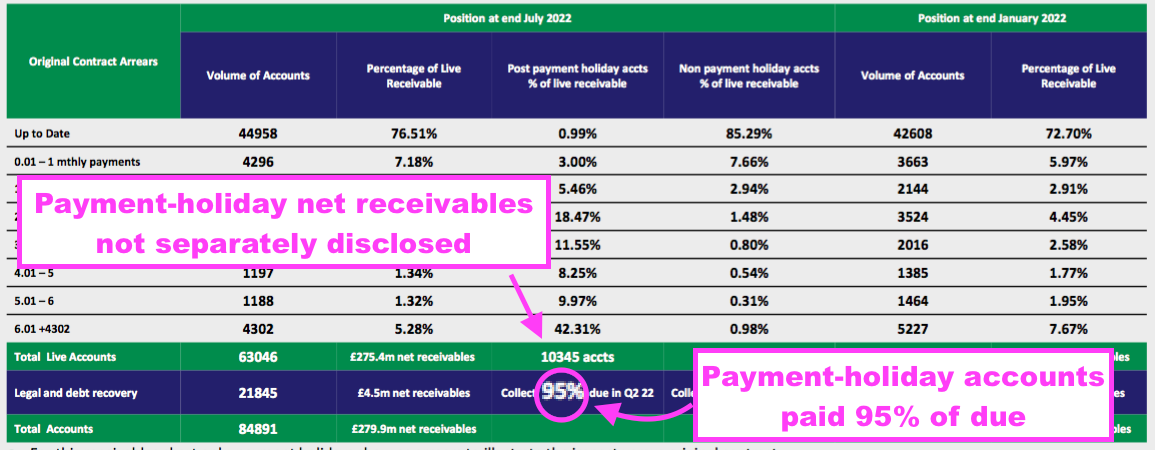
- …although the proportion reached a super 97% during the preceding FY 2022:
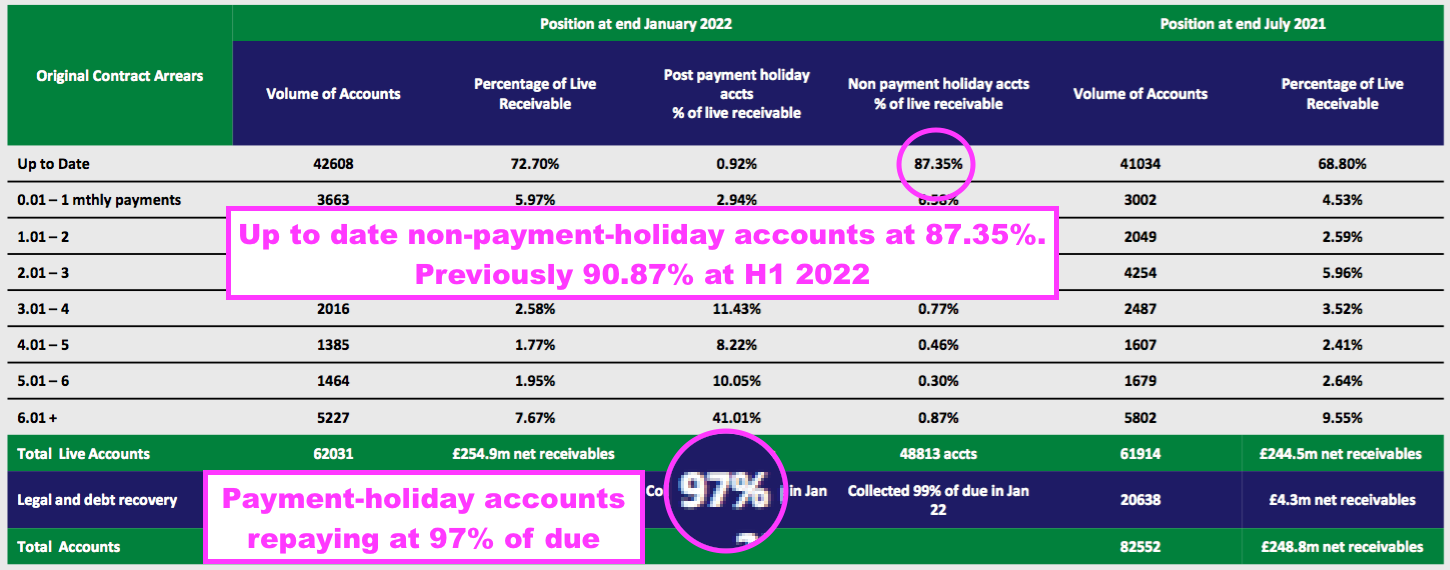
- SUS has frustratingly never disclosed the total amount owed by payment-holiday accounts. SUS has disclosed only the amounts owed by up-to-date accounts and the amounts owed by all those overdue:
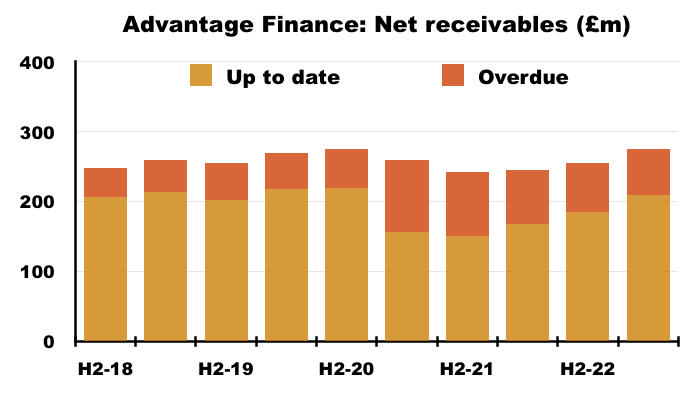
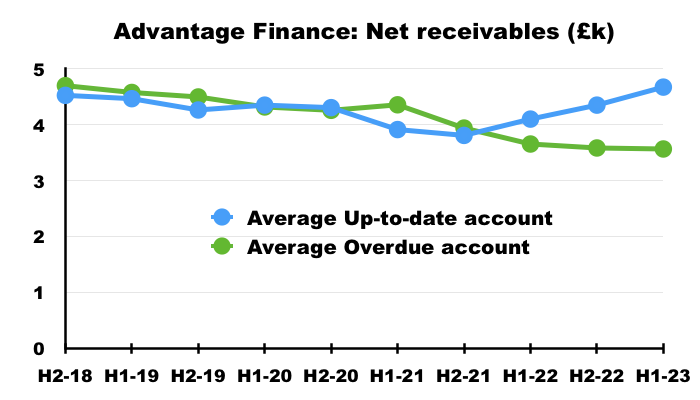
- I note the average amount still owed by overdue accounts has started to reduce while the average amount still owed by up-to-date accounts has started to increase:
Advantage Finance: New loans
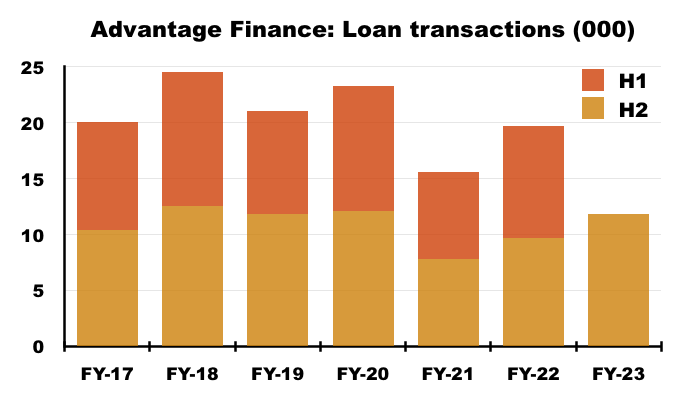
- The 11,800 motor loans issued during this H1 was the highest during any six-month period since H1 2020 (12,065 new loans):
- New loans at levels lower than witnessed during H1s 2018, 2019 and 2020 were not due to a shortage of applications.
- The 2017 and 2022 annual reports indicate applications for Advantage’s car loans have doubled to nearly 1.5 million during the last five years (point 2b).
- The H1 2023 presentation in fact revealed more than 150,000 applications are received every month (i.e. 1.8 million a year).
- Rising application numbers combined with steady loan volumes since FY 2017 hopefully mean Advantage has been very choosy with its lending.
- Widening the sources of applications has presumably helped with volumes:
“Integral to attracting good future customers is ensuring that Advantage has a balanced and stable introducer broker base. The success in ensuring this balance lies in the fact that the top three introducers now account for 34% of new transactions against 44% two years ago.“
- No hint of future loan numbers was given within this H1 statement or during the webinar.
- SUS’s talk of “choppy waters ahead” that would “undoubtedly test the resilience of Advantage’s policies and procedures” imply the number of loan agreements may be muted during the near term.
- The 11,800 new loans issued during this H1 were offset by 10,785 accounts closing due to finished repayments, voluntary terminations or the commencement of legal proceedings:
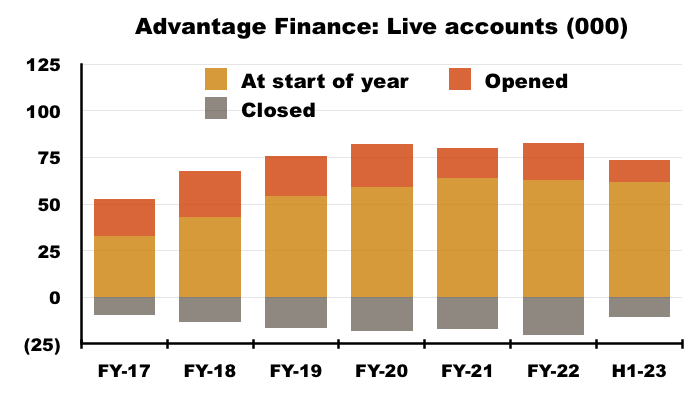
- The account openings and closures meant total ‘live’ accounts remained at approximately 63,000:
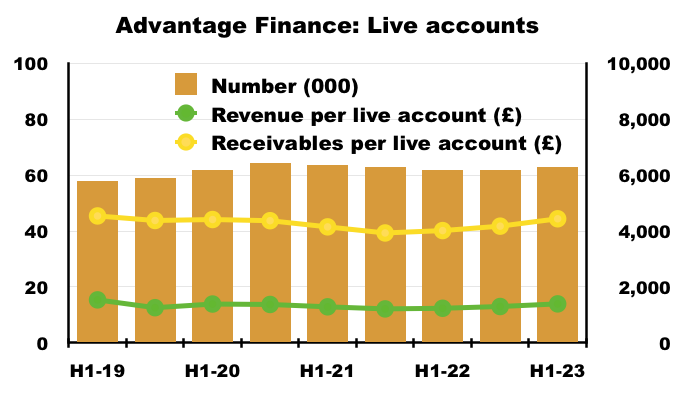
- Revenue per account continued around the £1,300 mark, while customers owe approximately £4,400 each.
- Advantage’s first-payment statistics just about remain within levels witnessed before the pandemic:
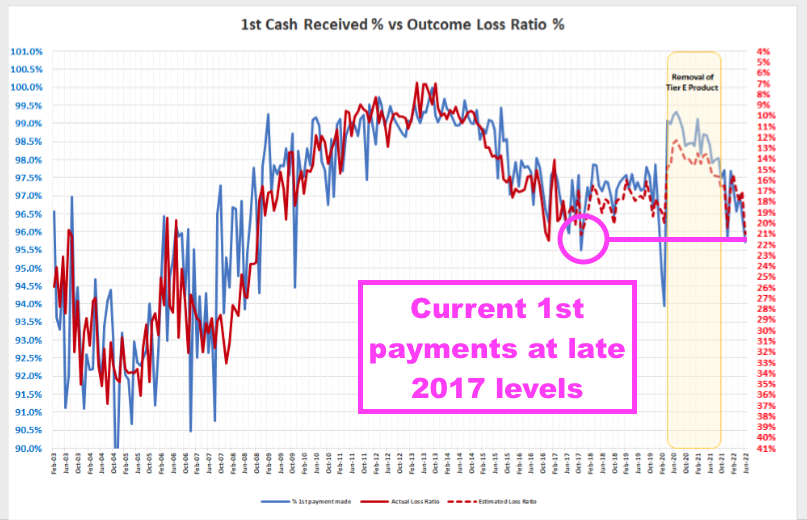
- The blue line (left axis) reflects the percentage of new customers making their first payment on time.
- The proportion at almost 96% was last seen during late 2017.
- (The 99%-plus first-time payments achieved during 2020 were due to the stringent lending applied as the pandemic struck).
- The unbroken red line (right axis) shows the actual ‘outcome loss ratio’, which correlates strongly to the first payment percentage.
- The dotted red line (right axis) shows the estimated ‘outcome loss ratio’, which implies write-offs of approximately 21% — close to my aforementioned 20% estimate (see Advantage Finance: loan provisions).
Aspen Bridging
- Established at the start of FY 2018, Aspen offers property bridging loans for small/individual property developers with awkward financial circumstances.
- The 2022 annual report (point 2f) outlined the lender’s attractions to customers:
““Mainstream” banks, including the newer “challengers”, continue to lack the speed, flexibility and appetite to furnish the smaller, short-term loans in which Aspen specialises. Recent consolidation in the challenger banking sector is evidence of this and again shows that, technology, speed and a quality bespoke service – as well as price – are what give smaller entrants like Aspen their competitive edge.“
- Aspen’s rate card says developers borrowing against residential properties pay a flat monthly interest rate from 0.84% on a 75% loan-to-value arrangement.
- Terms have tightened since I published my FY 2022 review; back then the monthly rate was from 0.69% on a 70% loan-to-value arrangement.
- These case studies give a flavour of the transactions involved:

- 73 clients were advanced an average £873k for 11 months during this H1:
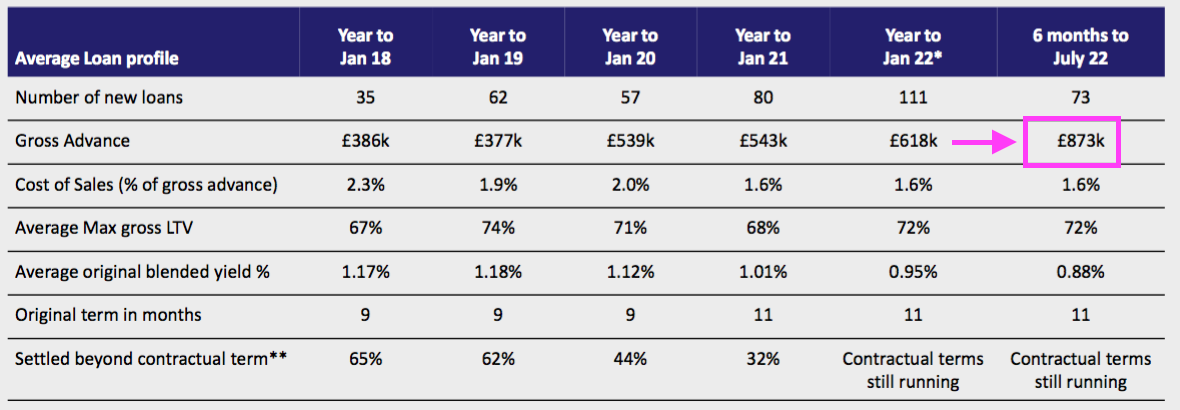
- 73 loans at £873k gave a total £64m advance:
- Aspen’s enlarged loan book currently represents 24% of SUS’s entire lending:
- I had speculated within my FY 2022 review:
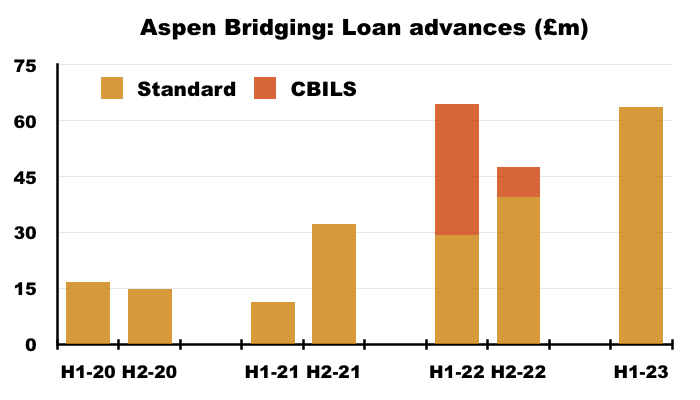
“Perhaps gross lending could reach £80m for FY 2023 and maybe even £100m for FY 2024?“
- Aspen’s lending now looks set to surpass £100m for FY 2023.
- Lifting the maximum loan value to £5m has assisted Aspen’s progress (point 1e).
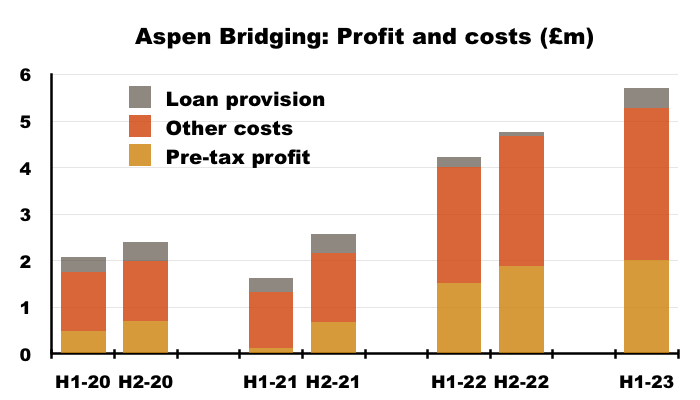
- Profit during this H1 came in at £2.0m versus £1.9m and £1.6m for the preceding CBILS-assisted H2 2022 and H1 2022 respectively:
- Aspen’s credit quality remains exceptional.
- Of the 442 loans advanced since Aspen’s formation, 314 have been repaid and only six of the remaining 128 remain overdue.
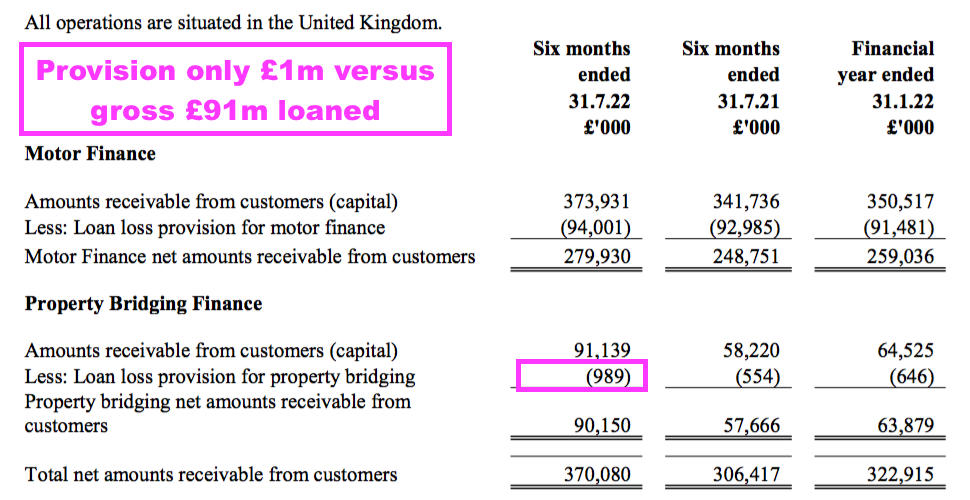
- Expected write-offs from Aspen’s £91m loan book amount to just £1m:
- Loan impairments during this H1 were £423k — relatively small, but a notable increase versus the ridiculously low £92k charged during the preceding H2.
- Bad loans are limited by employees inspecting every property before any money is lent (point 2k):
“In order to achieve and further bolster this progress, Aspen recruited experienced business development managers, tightened its processes to ensure even stronger more robust underwriting and still insists that every property upon which Aspen lends for security is personally visited by a member of the team.“
- I am not sure whether employees inspecting every property will eventually impinge on Aspen’s growth rate and lending scale.
- SUS suggested Aspen’s progress could moderate during H2:
“Aspen’s pipeline has remained consistently above budget, although seasonal factors, higher interest rates and a slightly slowing residential market has shown a recent return to budget.“
- I still wonder whether Aspen could one day surpass Advantage to become SUS’s largest division.
- I note Aspen’s lead directors Jack Coombs and Ed Ahrens are both now executives on the main group board.
- SUS’s lead executives — Anthony and Graham Coombs — are presently both 70 years old while their cousin Jack is 35.
- The question “when are you going to retire?” was asked during the webinar. Management responded.
“We are in very good fettle, we are in good form, and we don’t see [retirement]… as necessary… When we do retire, we have our eyes on a very, very good cohort of potential successors, some of whom are involved in the business, some of whom maybe in the future, but nevertheless, we feel continuity in terms of control can be assured.“
- While Anthony and Graham Coombs are not in any hurry to retire, Jack Coombs does seem likely to be leading SUS at some point… and maybe the lending focus of the group may alter thereafter.
- SUS was founded by Clifford Coombs during 1938 and Coombs family members own at least 42% (£111m) of the company.
- Aspen’s early years have been more profitable than Advantage’s early years.
- Advantage took more than a decade to grow from start-up (FY 2000) to report a £4m-plus pre-tax profit (FY 2011); Aspen in contrast looks set to surpass £4m after six years.
- Possibly signalling the greater prospects of Aspen versus Advantage, Coombs family member Richard Coombs joined Aspen earlier this year.
Financials
- This H1 witnessed Advantage register its largest six-month cash outflow, £16m, since H1 2018 (£27.2m):
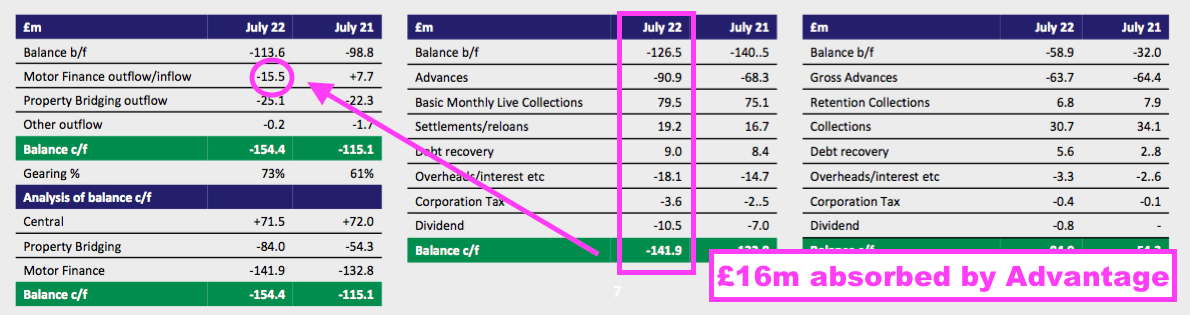
- Advantage absorbed the £16m after lending £91m, collecting £108m, expensing £22m and paying dividends of £11m.
- The preceding four years saw Advantage generate surplus cash that was used to support Aspen:
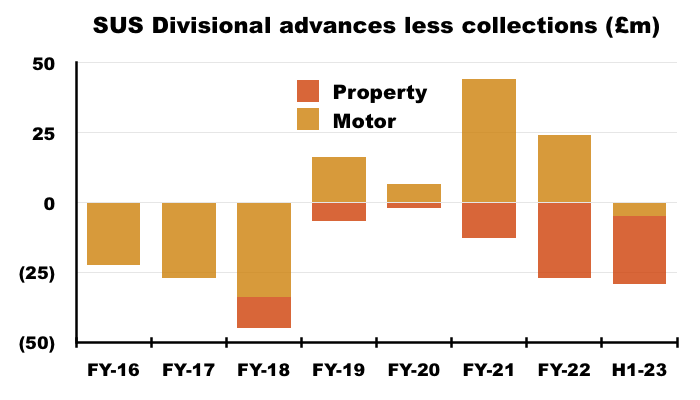
- Those preceding cash movements suggested Advantage had experienced fewer lending opportunities, and better potential returns were expected at Aspen.
- But Advantage’s cash outflow during this H1 suggests car-loan lending opportunities have improved.
- The presentation revealed Aspen distributing a maiden (£0.8m) dividend to the parent group:
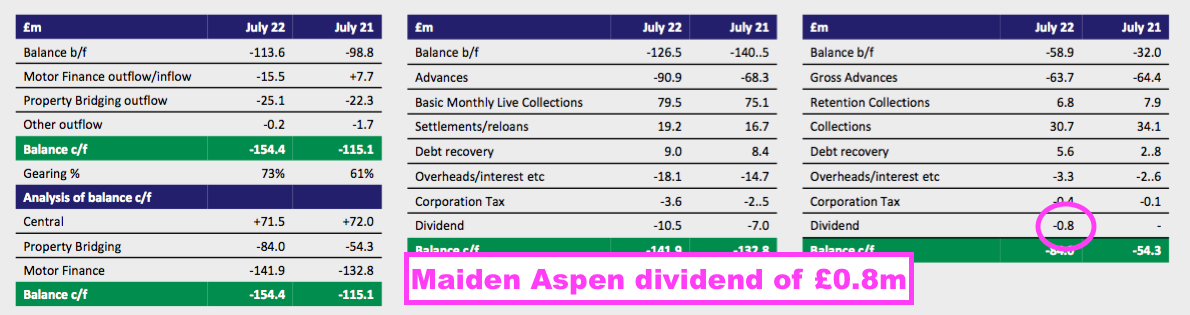
- Advantage restarting to reinvest its own cash alongside Aspen paying a dividend imply Aspen has now become self-funding.
- The extra £41m required during this H1 to fund operations at Advantage and Aspen (£30m) and support dividends (£11m) was covered by additional borrowings.
- Debt increased by £42m to £156m and represented 42% of the £370m owed by customers:
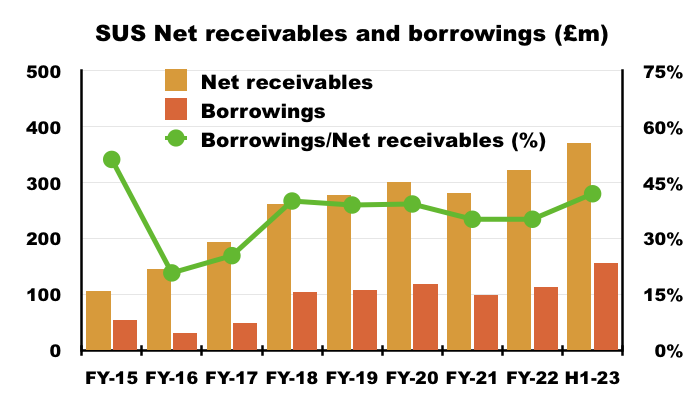
- SUS’s lenders appear happy with the borrowing arrangements, having extended SUS’s debt facilities by £30m to £210m following this H1:
“Nevertheless, to accommodate expected future growth in both our businesses in a timely way, a further £30m facility has been agreed with our banking partners since half year end.“
- Bank interest paid during this H1 was £2.6m, implying SUS’s borrowings incur interest at a reasonable 3.9% — albeit up from 3.3% during the comparable H1 2022.
- Management confirmed during the webinar that higher interest rates would impact Advantage more than Aspen. Interest payable by all customers is fixed throughout their agreements, but Advantage’s longer repayment terms (54 months) leave the division more exposed to rate movements.
- SUS’s various debt facilities are up for renewal between 2024 and 2029 (point 11c). SUS does not disclose the rates payable on its facilities, nor clarify whether the rates are fixed or variable, which is poor form.
- Management hinted during the webinar that rivals might suffer greater debt-cost problems:
“We are helped versus some of our competitors by our low gearing, so we are not so exposed to interest rate increases as others“.
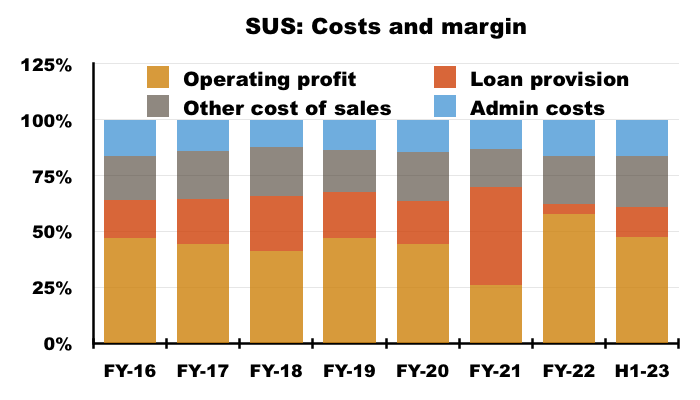
- The operating margin for this H1 was 48% and was bolstered by the aforementioned lower-than-normal bad-debt provision for Advantage.
- The lower-than-normal provision may have obscured greater operating costs.
- Admin expenses and other cost of sales (essentially broker commissions) absorbed a combined 39% of revenue — the highest level for any H1 or H2 since at least FY 2016:
- SUS requires a high margin to earn an adequate return on the money loaned to customers.
- This H1’s £22m operating profit versus the gross £465m borrowed by customers points to an annualised 9% return — which I estimate increases to approximately 14% given SUS has borrowed £155m to partly fund that £465m.
- SUS’s assets and liabilities beyond customer loans and bank debt — including a tiny defined-benefit pension scheme — amount to only a net £1m.
Valuation
- SUS appeared frustrated that its H1 progress was overshadowed by wider economic issues:
“Rarely in S&U’s 84-year history has the strength of our current trading and first half performance contrasted so starkly with the current frenzy of pessimism and gloom surrounding the UK’s economic, energy and political prospects.“
- Management’s webinar commentary went much further, and somewhat astonishingly referred to the group broker’s £33 price target, the possibility of “huge potential” upside and an “attractive” 7% dividend yield:
“I would just point out that we have just had our own broker’s marketing communication on these half-year results and they quite sensibly say that they retain their ‘buy’ recommendation. They see significant upside to their target price of £33 and when we consider we are just over £20 at the moment I think that gives an indication of the potential attractiveness of the shares.
Irrespective of the capital position on the shares, which I think has got huge potential, they also mention the dividend yield, which has been very steady and sustainable at 7%, which I think is also attractive.”
- Management also noted during the webinar:
“I believe that, as Peel Hunt has demonstrated, and the share price currently, sadly, reflects… I think the company is insufficiently rated given the underlying performance and its prospects… I am confident that [the group’s] above-standard performance will be maintained and will actually increase and I am very confident indeed for the prospects for this year and for the years thereafter.“
- Management webinar remarks are generally best reserved for business matters rather than share-price verdicts.
- A promising update was issued during December:
“S&U continues to trade well despite a period of economic and political chaos unprecedented in most of our lifetimes. A change of government and of economic strategy, rising inflation, taxation and interest rates and an incipient recession is not exactly the ideal economic landscape for any business.
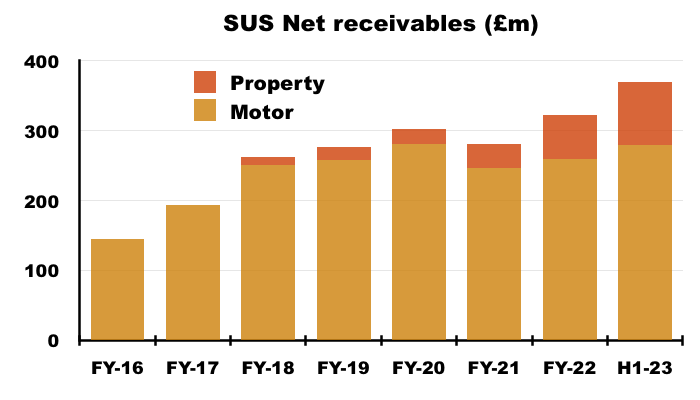
Nevertheless, trading is very good, focusing on the excellent quality of our customer relationships and the receivables which we derive from them. These receivables have now reached a net c£404m, against £370m at the half year end with continued good collections and profitability during the period.”
- An update during February then said the forthcoming FY 2023 results would “exceed budget“:
“Current trading in both businesses, Advantage, our motor finance lender, and Aspen , our property bridging lender, remains excellent. This will be reflected in the full year’s results which are expected to both meet expectations and exceed budget.
- Advantage in particular performed better during H2 than the H1 statement had signalled:
“Advantage’s experience reflects these trends. Transaction levels are likely to reach nearly 24,000 this year, an increase of 21% on 2021/2022. Transaction numbers in the period were near record levels. This year the usual sales lull of December did not occur. Tightened credit criteria has led to a shift towards a nearer prime customer so that average loan size rose by just over 9% to £7,800 per deal.
High receivables quality was demonstrated by collections against due finishing above budget for the year at an impressive 94%.
Both bad debts and voluntary terminations continue to remain below budget and monthly live collections exceeded £14m for the first time in January 2023.“
- Progress at Aspen has meanwhile slowed, but its profit will also “exceed budget“:
“Aspen, our property finance business, continues to make progress, albeit at a slower pace commensurate with recent trends in the UK housing market…
Repayment quality remains good. Of 141 loans on the books, Aspen currently has only one case in repossession and just four customers are more than 60 days overdue. Although the re-mortgage market has slowed, both in size and transactions, the overall quality of Aspen’s loan book means that profits exceed budget.”
- February’s update confirmed the group’s loan book stood at a net £420m (up £50m during H2) and debt stood at £192m (up £36m during H2).
- NAV may therefore be £420m less £192m = £228m or £18.76 per share.
- NAV increasing from £17.49 to £18.76 during H2 suggests H2 earnings were 162p per share — calculated by combining the estimated 127p per share NAV advance with the H1 dividend of 35p per share paid during H2.
- H2 earnings of 162p per share would give FY 2023 earnings of 302p per share — well ahead of forecasts carried by SharePad:
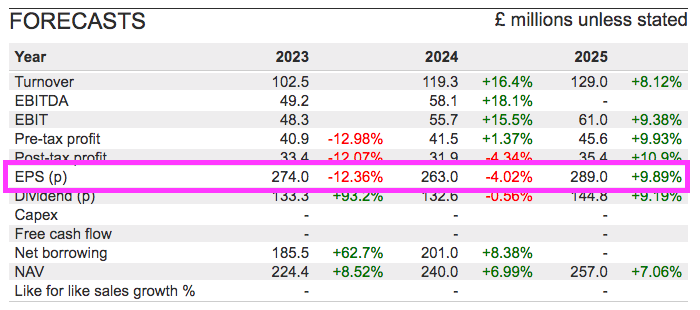
- My 302p per share earnings sums could therefore be very wrong.
- I prefer to evaluate SUS on an NAV basis, as earnings from year to year can suffer much greater fluctuations due to impairment calculations.
- The £22 shares presently trade at 1.17 times my NAV guess of £18.76 per share:
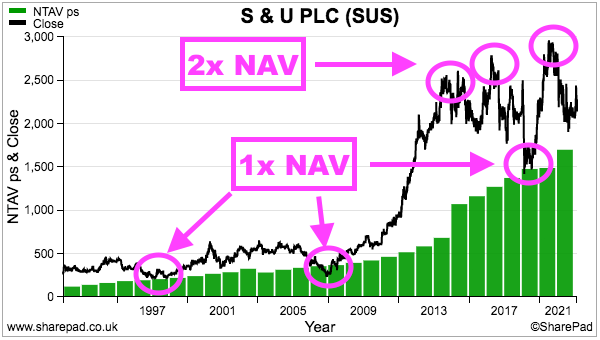
- The very best buying opportunities have occurred when the shares trade at NAV or below, while upside has tended to be very limited when the shares trade at 2x NAV or more.
- The 1.17x NAV rating suggests the market is worried that economic trouble will lead to poor trading and greater write offs.
- Another approach to valuation could be based upon five-year assumptions such as these:
- NAV grows 33% (c6% per annum) from £18.76 to £25 per share;
- The shares are re-rated to 1.5x NAV, and;
- The trailing twelve-month dividend is held at 130p per share.
- If such assumptions prove accurate, the shares would gain £15.50 to £37.50 by 2028 while dividends collected along the way would amount to £6.50 per share.
- The total five-year return would therefore come to £15.50 + £6.50 = £22… or a 100% return from the recent £22 share price.
- A 100% return over five years equates to a near-15% compound annual growth rate, and would be extremely satisfactory if achieved…
- … and might explain why management referred to that £33 price target during the H1 webinar.
- Management may also like referring to the share price because the aforementioned Anthony and Graham Coombs have been involved at SUS since the mid-1970s and steward a £111m-plus shareholding for their wider family.
- The Coombs family managers have successfully navigated many previous downturns (not least the pandemic) and the 2022 annual report (point 2g) reminded shareholders of the long-term benefit of employing such leadership:
“Our over-arching factor in the success of our business over 80 years and through three family generations of management is our business philosophy. The identity of interest between management and shareholders has fused our ambition for growth with a conservative approach to both credit quality and funding.”
- The board’s “conservative approach to both credit quality and funding” should (again) prove its worth were difficult times to emerge once again.
- That trailing 130p per share dividend meanwhile provides a handy 6% yield at £22.
Maynard Paton
