02 September 2022
By Maynard Paton
Results summary for Mountview Estates (MTVW):
- A steady FY 2022 performance, buoyed by an H2 that saw property sales achieve a record £379k average and realise a 66% premium to their 2014 Allsop valuation.
- The final dividend was lifted 11% while expenditure on new properties fell to a 13-year low after management expressed a desire to “not chase purchases at any price“.
- Net debt remains very modest at just 5% of the property estate and reflects management’s concerns of forthcoming “difficult economic circumstances“.
- Friction between major shareholders continues, with revised director-pay arrangements perhaps encouraging significant protest votes at the latest AGM.
- Net asset value remains at £101 per share, although the balance sheet could be worth £210 per share assuming all owned properties enjoy immediate ‘reversionary’ gains and are then sold at fair-market value. I continue to hold.
Contents
- News link, share data and disclosure
- Why I own MTVW
- Results summary
- Revenue, profit, dividend and net asset value
- Trading properties: gross margin and rental income
- Allsop valuation
- Financials
- Protest votes and executive pay
- Valuation
News link, share data and disclosure
News: Annual results for the twelve months to 31 March 2022 published 16 June 2022
Share price: £130
Share count: 3,899,014
Market capitalisation: £507m
Disclosure: Maynard owns shares in Mountview Estates. This blog post contains SharePad affiliate links.
Why I own MTVW

- Buys, holds and sells regulated-tenancy (and similar) properties and boasts an illustrious, 40-year-plus history of net asset value and dividend advances.
- Board led by veteran family management that continues to boast an aggregate 50%/£254m shareholding.
- Properties are carried at cost, and when eventually sold at their ‘reversionary’ values may generate total proceeds significantly in excess of the recent market cap.
Further reading: My MTVW Buy report | All my MTVW posts | MTVW website
Results summary
Revenue, profit, dividend and net asset value
- An acceptable H1 2022 performance that expressed caution about the “difficult times that may lie ahead“…
“The Company has generated strong cash flow and we are thus in a good position to shield ourselves from the difficult times that may lie ahead.”
- …and bemoaned a lack of property buying opportunities…
“Good purchases are vital to the future prosperity of the Company and our financial strength will enable us to compete when good opportunities occur.”
- …was never likely to herald an astonishing FY 2022 statement.
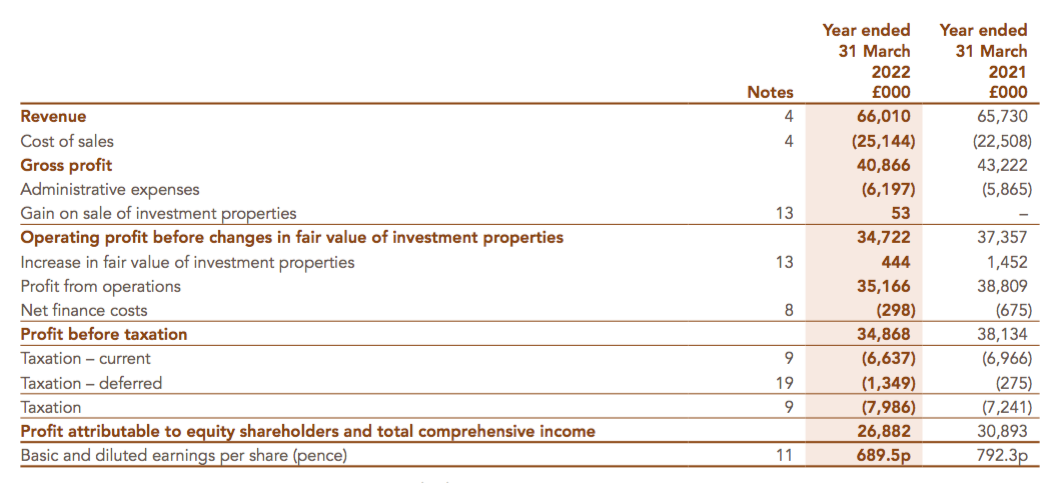
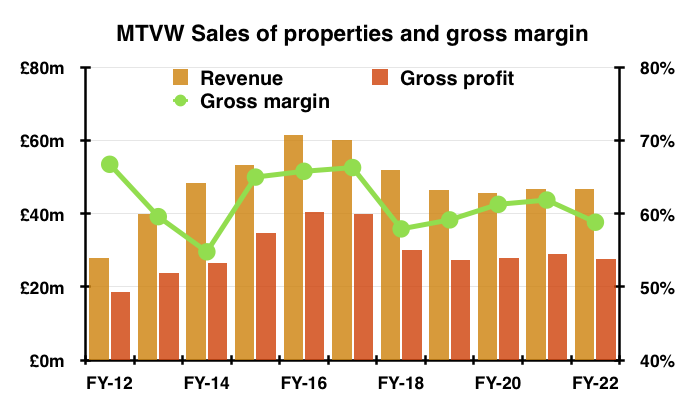
- For the full year, revenue was unchanged at £66m while operating profit dropped 7% to £35m:
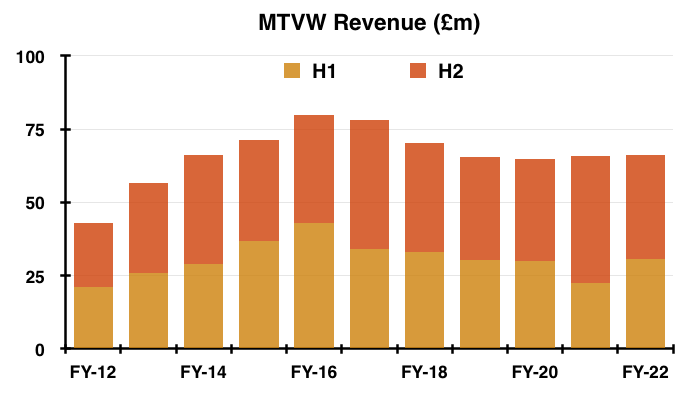
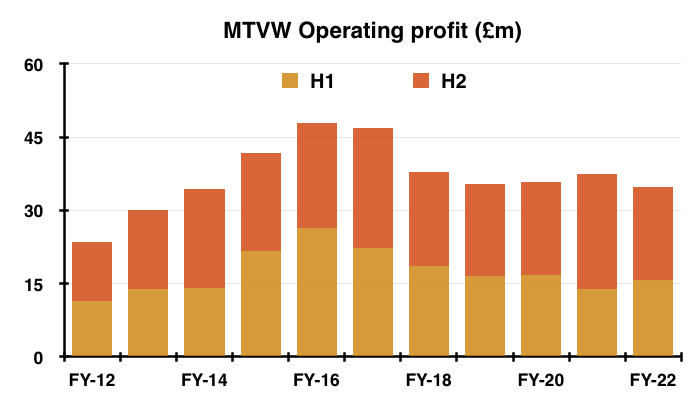
- The annual performance was also similar to that reported for FYs 2019 and 2020, but was 15-25% below the record revenue/profit levels witnessed during FYs 2016 and 2017.
- H2 revenue fell 18% and H2 operating profit fell 20% versus the remarkable H2 2021, which enjoyed a sales “backlog” following earlier pandemic-related disruption.
- Revenue was split 71%/29% between property sales and rental income, and broadly matched MTVW’s preceding ten-year average:
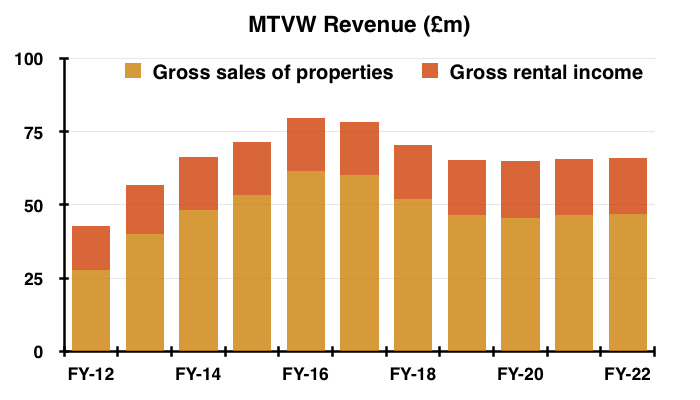
- Note that MTVW sells its regulated-tenancy (and similar) properties only when the tenancy ends — which typically occurs when the tenant dies.
- The mix of properties becoming available for sale — and the total proceeds MTVW earns — can therefore vary from one set of results to the next.
- The 135 properties sold during FY 2022 was the lowest number for at least 20 years:
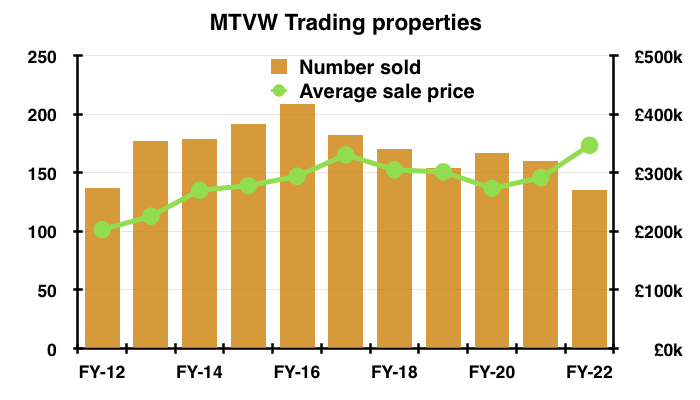
- But the average price achieved from the properties sold reached a new high of £347k.
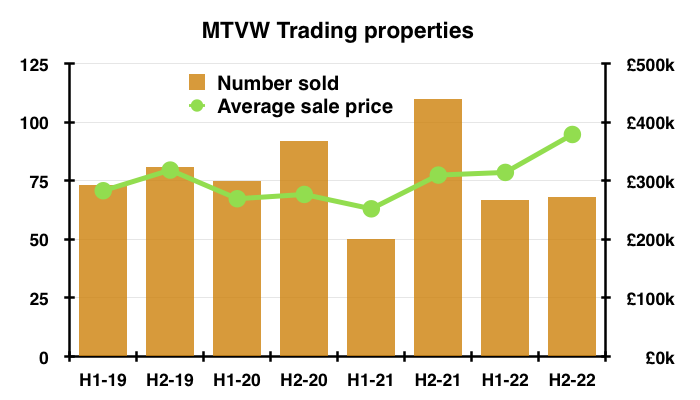
- H2 in fact witnessed average selling prices climb to £379k:
- The £379k average price perhaps reflects the “different type of purchaser” MTVW said had been attending recent auctions:
“On the purchase side, the tail end of Covid-19, and in particular the stamp duty holiday, attracted a different type of purchaser into the auction rooms who was willing to buy regulated tenancies at smaller discounts than we believed was reasonable.“
- Buoyant sales prices do mean MTVW has struggled to find auction bargains:
“We believe that our decision… to stick to our principles of risk management and not chase purchases at any price is proving a sound one that will protect shareholder value going forward.”
- Most of MTVW’s properties are located within London and south-east England and are relatively low value.
- Of the 786 properties MTVW sold between FYs 2018 and 2022, 688 achieved less than £500k, a further 89 achieved less than £1m and only nine achieved £1m or more.
- The payment of the 275p per share special dividend announced within the preceding H1 statement caused net asset value (NAV) to decline for the first time since FY 2009:
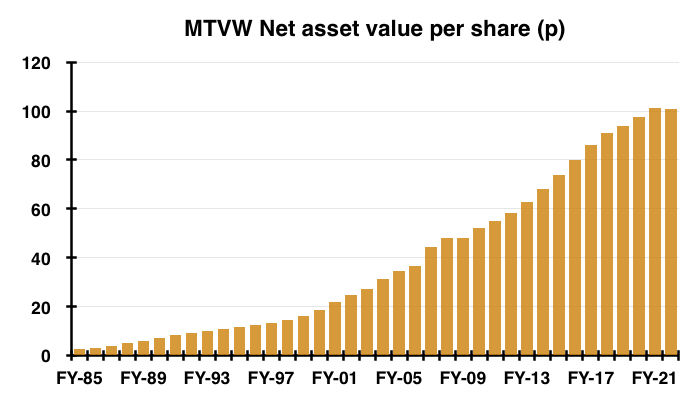
- NAV ended the year at £393m, or £100.92 per share, versus £395m, or £101.27 per share, twelve months earlier.
- The 275p per share special dividend cost almost £11m, and would have lifted NAV to £404m or £103.67 per share were it not paid.
- MTVW’s NAV per share growth has slowed over time.
- NAV per share has compounded at:
- 3% during the five years to FY 2022;
- 6% during the ten years to FY 2022;
- 6% during the 15 years to FY 2022, and;
- 7% during the 20 years to FY 2022.
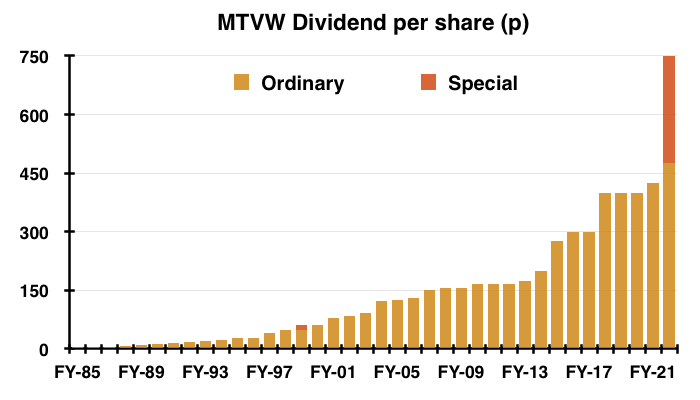
- The full-year dividend was raised almost 12% to 475p per share after the final dividend was lifted 11% to 250p per share.
- The preceding H1 statement suggested ordinary dividends for FY 2023 may not witness similar advances:
“It is not anticipated that this interim dividend will limit the final dividend payable in August 2022 in any way, but it would be prudent to presume that the interim dividend payable in March 2023 will be maintained at the new increased level of 225p per share.“
- Management talk of “difficult economic circumstances” within these FY 2022 results may also keep a lid on near-term ordinary dividends:
“Economists’ views on where inflation and interest rates are going and how long lasting their effects will be vary across the board though we do anticipate that the era of rock bottom interest rates is behind us.”
…
“We are now confronted by the prospect of double-digit inflation which will not be gone in the blink of an eye and may be with us for years rather than months.”
…
“As we now enter a period of what are expected to be difficult economic circumstances we may find opportunities of which we can take advantage…”
- At least Companies House shows the dividend has never been cut since at least 1979 — after which the payout has risen 317-fold:
Trading properties: gross margin and rental income
- The preceding H1 statement revealed a 54% gross margin generated through property sales — the lowest since H1 2014 (49%).
- I wrote at the time:
“I trust the 54% property-sales gross margin for this H1 was caused by an unusual collection of properties becoming available for disposal during the six months…
…and that MTVW’s longer-term gross margin will continue to average approximately 61%.“
- Sure enough, properties sold during H2 boasted a 65% gross margin to give a full-year gross margin of 62%:
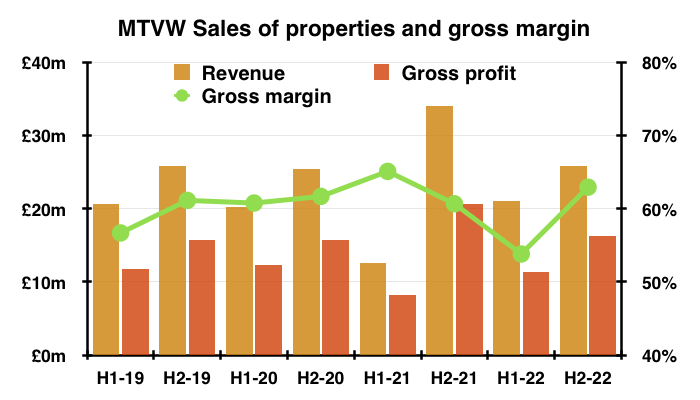
- A 62% gross margin is equivalent to buying a property for £100k and selling it for £263k.
- Fluctuations to gross margins occur because of the unpredictable mix of properties becoming available for sale during any particular period.
- The percentage gain on each property sold is correlated to the duration of MTVW’s ownership, which can range from a few years to a few decades.
- The mix of properties sold tends to even out over time. MTVW’s average gross margin over five-year periods has been remarkably consistent:
- FYs 2018 to 2022: 60%
- FYs 2013 to 2017: 62%
- FYs 2008 to 2012: 60%
- FYs 2003 to 2007: 63%
- The 65% property gross margin achieved during H2 is not unheard of but not common either.
- MTVW has recorded property sale gross margins of 65% or more during eight years since FY 2000 — most recently during FYs 2015, 2016 and 2017.
- A super 71% property gross margin was in fact reported for FY 2008.
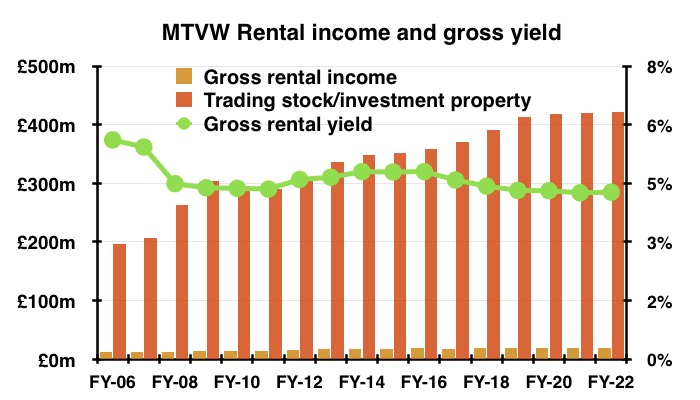
- MTVW’s rental-income gross margin at 69% has reverted to normal levels after certain work was deferred during the pandemic:
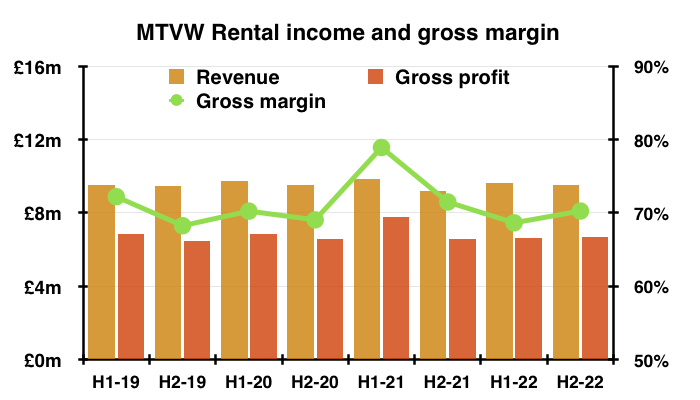
- Rental income as a proportion of the carrying value of all properties was 4.6% during FY 2022 and within the range seen since FY 2008:
Allsop valuation
- An encouraging development during this FY concerned the proceeds from sold properties compared to a past valuation.
- To recap, MTVW commissioned property agent Allsop during September 2014 to assess the group’s estate.
- Allsop returned a £666m valuation — some 2.1x the £318m book value of the properties owned at the time.
- The Allsop assessment was based on MTVW’s properties remaining in their regulated-tenancy state and therefore excluded any ‘reversionary’ gain (i.e. the value uplift that occurs when a regulated tenancy finishes, the rent reverts to a proper market level and the property can then be sold at a fair market value).
- The Allsop assessment was not applied to the audited accounts. MTVW’s properties instead remain on the balance sheet at their cost price.
- Following the Allsop assessment, MTVW reveals the proceeds from sold properties versus their Allsop valuation:
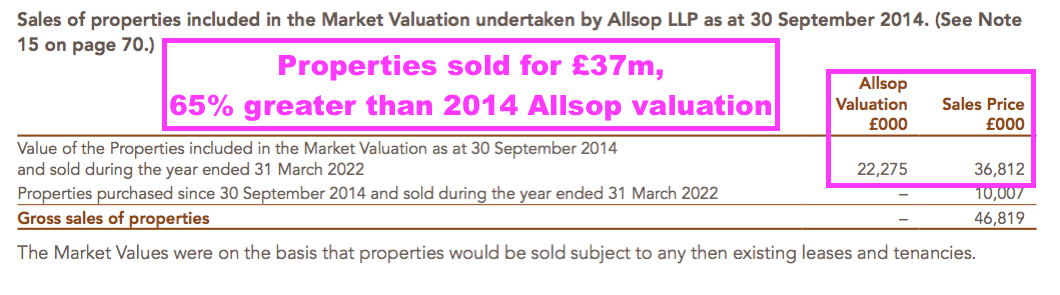
- Prior to the pandemic, sale proceeds realised premiums of between 43% and 53% on the Allsop valuation:
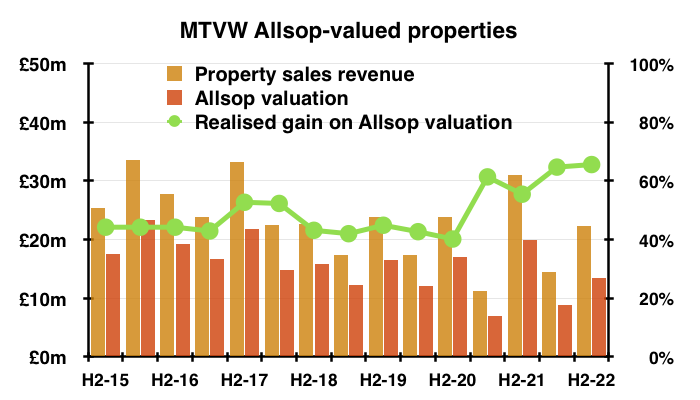
- But the preceding H1 statement showed realised gains on the Allsop valuation to be higher at 65%, and this FY 2022 statement revealed the premium to be 66% during H2.
- MTVW’s results commentary has never referred to the Allsop valuation since the assessment was undertaken.
- As such, shareholders are left to guess whether the record 66% premium during H2 was due to a favourable mix of properties being sold…
- …or generally higher sale prices being achieved at auction.
- The aforementioned reference to the “different type of purchaser” attending auctions suggests the 66% is indeed supported by higher sale prices…
- …although whether the aforementioned reference to “difficult economic circumstances” is management code for the 66% to subside remains to be seen.
- A greater realised gain versus the Allsop valuation has positive implications for estimating MTVW’s potential upside (see Valuation).
- During the seven and a half years following the Allsop assessment, MTVW has raised £351m from selling properties that the agent had valued at £236m.
- Selling properties that Allsop had valued at £236m implies the book value (i.e. the original cost) of the properties sold was £113m (£236m divided by that earlier 2.1x multiple).
- Selling Allsop-valued properties with a £113m book value indicates Allsop-valued properties with a £205m book value remain within MTVW’s ownership today (i.e. the £318m book value at the September 2014 assessment less the £113m since sold).
- MTVW during FY 2022 sold Allsop-valued properties with an estimated book value of approximately £11m, suggesting the remaining Allsop-valued properties of £205m could take a further 19 years to sell.
- These FY results showed total trading properties with a £393m book value, implying properties purchased after the Allsop review have a £188m book value (i.e. £393m less the remaining Allsop-valued properties of £205m).
- Bear in mind the figures above are guesstimates and could be rather inaccurate.
- As more Allsop-valued properties are sold and other properties are purchased, the less relevant the Allsop valuation becomes to the share price.
- MTVW refuses to undertake another Allsop-type valuation.
- The 2022 annual report reiterated the following text from previous years:
“The [Allsop] valuation is not a useful tool for running the business because we are always going to await vacant possession, and no perceived uplift in value can justify selling a tenanted property. The nature of our business and the rules and conventions under which we operate place no obligation upon us to value our trading stock at any given time and therefore the valuation has not been updated since.”
- And during the 2021 AGM, the board:
- Repeated it was “reluctant to inflict shareholders the cost” of another assessment;
- Disclosed Allsop was paid £600k for the 2014 assessment, and;
- Described the expense as a “substantial amount for something of very little use”.
- I maintain MTVW ought to implement regular valuations to provide greater clarity as to the inherent value of the group’s property estate.
- Further valuations could also help shareholders judge the astuteness of MTVW’s more recent purchases and the appropriateness of the board’s pay (see Protest votes and executive pay).
Financials
- MTVW’s accounts remain very straightforward.
- Some £13m (before acquisition expenses) was spent during the year acquiring 53 additional properties at an average cost of £237k:
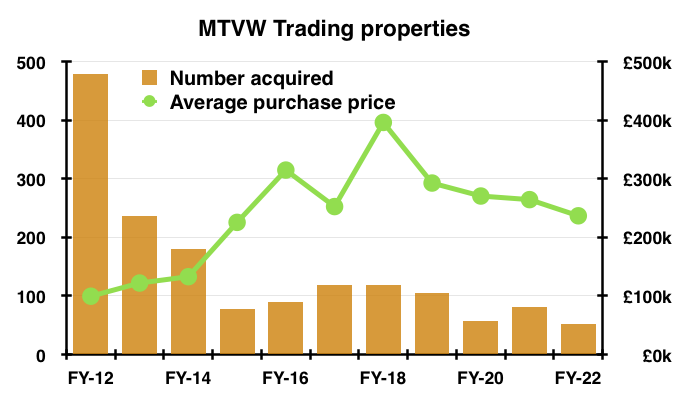
- The £14m (after acquisition expenses) was the lowest spent since FY 2009 (£6m), and compares to at least £17m spent on new properties annually since FY 2012:
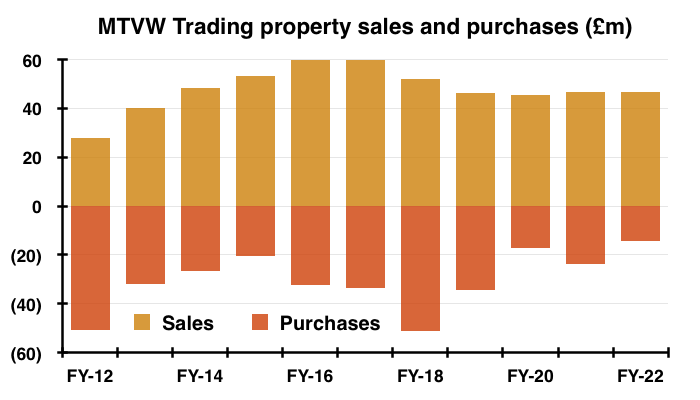
- £8m of the £14m was spent during H2, although MTVW does not disclose how many of the 53 purchased properties were acquired during H1 and H2.
- I have already pondered whether the low level of property purchases alongside the 275p per share special dividend are leading to a new company chapter, in which MTVW effectively goes into ‘run off’ as the group sells more properties than it buys.
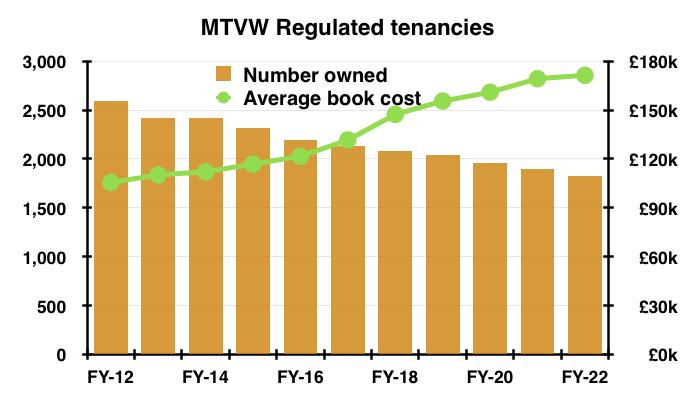
- The market for MTVW’s regulated tenancies will continue to shrink. Such tenancies have (with limited exceptions) not been created since 1989 and Allsop estimates fewer than 75,000 now exist.
- The number of regulated tenancies owned by MTVW topped 3,000 20 years ago, topped 2,500 ten years ago but today stands at approximately 1,800:
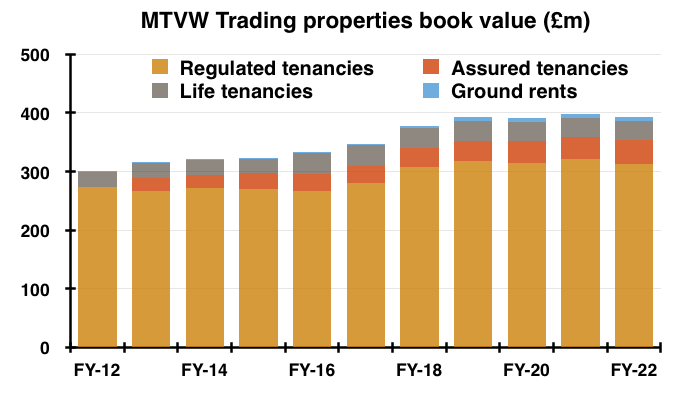
- MTVW’s trading-property estate has a £393m book value, of which regulated tenancies represent £313m or 80%:
- MTVW’s conventional investment properties are presently in the books at £25m or £6.53 a share.
- Full-year earnings of £27m funded dividends of £28m and debt repayments of £2m, which in turn left net debt at £19m — slightly higher than the H1 level of £16m but still the lowest year-end level since FY 1999 (£13m).
- Net debt of £19m is equivalent to 5% of the group’s £393m trading-property estate — the lowest year-end percentage since at least FY 1997:
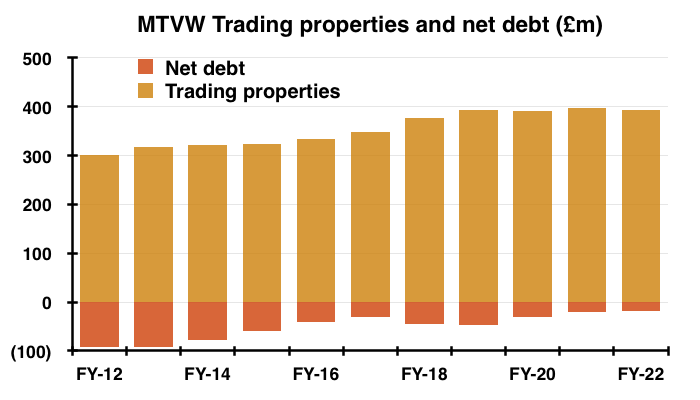
- MTVW’s gearing has been much higher. During FYs 2012 and 2013 for example, net debt was equivalent to 30% of the property portfolio.
- The annual-report small-print disclosed banking facilities of up to £90m — equivalent to 23% of the property estate.
- The modest gearing alongside the debt headroom suggests MTVW would have no problem acquiring future property bargains should any “difficult economic circumstances” emerge.
- Finance costs of just £298k for this FY imply a remarkably low 1.5% interest rate on the period’s £21m average net debt.
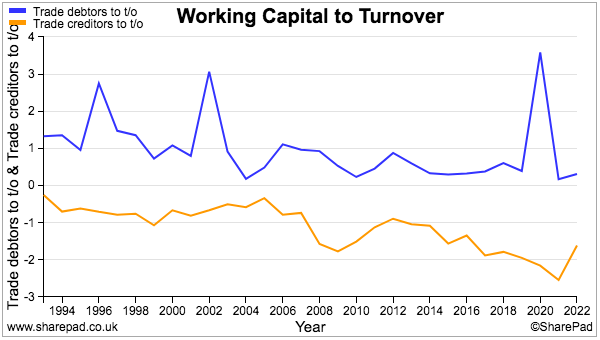
- Both trade debtors and trade creditors continue to represent a trivial 3% or less of revenue:
- MTVW’s accounts remain free of defined-benefit pension obligations.
Protest votes and executive pay
- Despite MTVW’s illustrious history of NAV and dividend advances, not every shareholder is content with the way the company is managed.
- The last six AGMs have witnessed c30% protest votes against re-electing independent non-execs, approving the board’s pay and re-appointing the auditors.
- MTVW’s shareholders fall into three camps:
- The Sinclair family concert party, which is led by chief executive Duncan Sinclair and controls just over 50% of the share count;
- The Murphy family and connected parties, who claim to own 24% of the share count and whose leading shareholder is the chief executive’s sister, and;
- Everybody else, who own 25% of the share count.
- The protest votes come from the Murphy family and connected parties.
- From what I can tell, the Murphy family is broadly satisfied with how MTVW’s day-to-day operations are run, but:
- Is aggrieved about the board’s pay;
- Has lost the trust of the non-execs to act on the views of all shareholders, and;
- Is frustrated about a general lack of influence at board level.
- The Murphy family stated during the 2021 AGM that it was no longer in direct communication with the company and would only engage with the directors through a “public forum“.
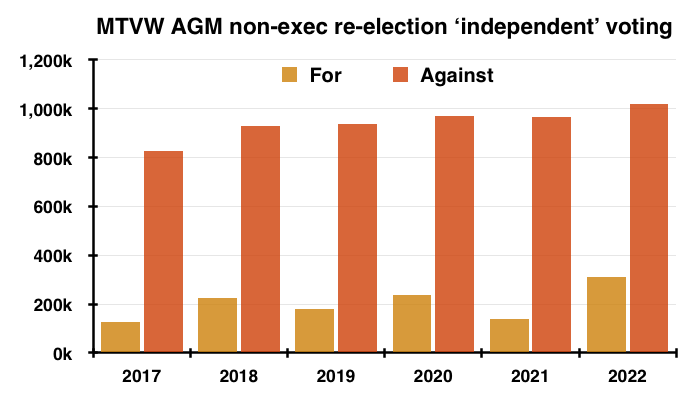
- The Murphy family and other unhappy shareholders have prevented the re-election of certain non-execs at the 2017, 2018, 2019, 2020, 2021 and 2022 AGMs:
- Following each AGM, MTVW is entitled to convene a general meeting and hold a further vote to re-elect the ousted non-execs.
- The ousted non-execs have (to date) all been re-appointed at the subsequent general meetings because the Sinclair concert party can then vote on the non-exec re-elections (unlike at the AGMs, where the concert party is prohibited from voting on particular ‘independent’ resolutions).
- The voting chart above shows the average AGM votes for and against the re-election of the contentious non-execs. The average protest votes against are slowly increasing, rising from 827k to 1,018k since 2017.
- Stock market rules dictate any company incurring a sizeable AGM or EGM protest vote has to contact the unhappy investors and publish an update to shareholders within six months.
- Six months after the 2021 AGM, MTVW stated:
“Following the 2021 AGM, and as it has done previously, the Company identified as far as possible those shareholders who did not support the various resolutions and attempted to engage with them to seek their views. Those shareholders did not wish to engage.
- Then six months after the follow-up 2021 EGM, MTVW changed the wording slightly:
“Following the meeting, the Company identified, as far as possible, those shareholders who did not support the resolutions and attempted to engage with them to seek their views. Some shareholders did not wish to engage..“
- Whether some or none of the opposing shareholders are engaging privately with MTVW is hard to say.
- New pay arrangements for the executives probably encouraged protest votes at the 2022 AGM.
- MTVW’s chief exec claimed the revised remuneration was “vital” for the directors:
“Whilst I am very happy to look after my shareholders in this manner I am very mindful to look after the Mountview staff who make all this possible. My greatest concern is for the most modestly paid but it is vital that the more highly paid are rewarded for their endeavours because it is their decisions which make the future prosperity of Mountview possible. In this light I trust that shareholders will support those resolutions that allow the potential to support the decision makers.“
- The new pay arrangements reflect a rebalancing of executive salaries and bonuses:
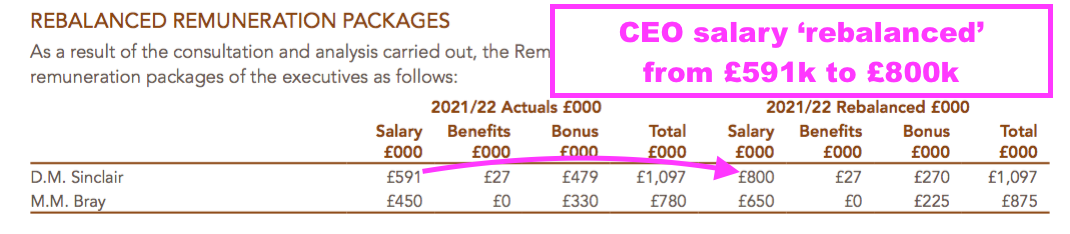
- Executive pay is now split 75% salary and 25% bonus versus 55% salary and 45% bonus.
- The remuneration report said the rebalancing was prompted by “observations during the pandemic and also in response to comments from shareholders“.
- The downside to the rebalancing perhaps is the increased scope for executives to earn more money at a time when returns to shareholders may not be so great.
- After all:
- Executive salaries may rise faster than bonuses as MTVW lifts employee pay to combat greater inflation, while;
- Business performance and therefore bonuses may suffer if MTVW and the housing market do indeed endure “difficult economic circumstances”.
- How MTVW’s executive bonuses are derived is confusing, and possibly encourages the protest votes on pay.
- For example, one section of the remuneration report suggests board bonuses are aligned to group profit…
“Base salary is reviewed with regard to seniority, inflationary increases, personal performance, changes in responsibilities, market themes and peer group; whereas the short-term incentive award is reviewed and aligned to:
* the Group’s financial metrics (primarily profit before tax);
* the Executive Director’s personal contribution; and
* non-financial corporate goals to build for long term sustainable success, including management development, succession planning and the maintenance of a robust business infrastructure.”
- …while another section of the remuneration report suggests board bonuses are not linked to group profit:
“The Remuneration Committee considered that, while firmly of the view that there should be a clear link between the Group’s financial results and the short term incentive element of the remuneration of the Executive Directors, the use of metrics that attempted to link Executive Director’s performance with the current year’s profits would be unreliable and, at best, be artificial and, at worst, be misleading. Consequently, the Remuneration Committee concluded that the current approach continued to be appropriate.“
- Bonuses are regular fixtures of the board’s pay. The chief exec has received a bonus every year since at least FY 2001…
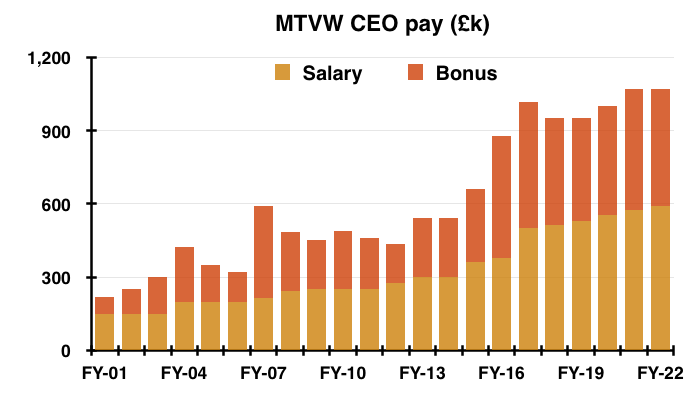
- …which does raise the question as to whether the bonuses are effectively guaranteed.
- MTVW is the only company I know that includes executive remuneration within its annual-report summary table:
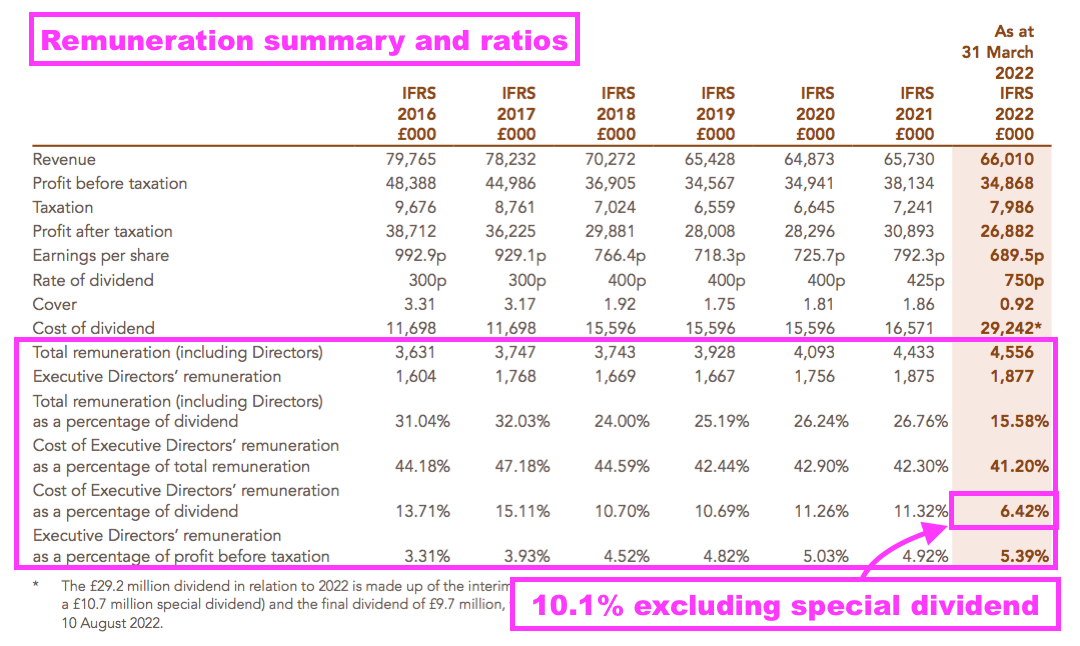
- The table shows that total executive pay has been maintained at 10-11% of ordinary dividends, which may bode well for future payouts if the remuneration rebalancing leads to much higher director pay… and of course the 10-11% ratio is sustained!
- The chief exec’s basic pay will be lifted from a (rebalanced) £800k to £830k for FY 2023. The finance director will be on £675k.
- Notice within the summary above how the (two) executives collect a sizeable 40%-plus of all employee pay.
- I would venture that if MTVW can afford to pay the executives an aggregate £12m since FY 2016, then the group can also afford a follow-up Allsop-type valuation for a mooted £600k.
- Suffice to say, a follow-up Allsop-type valuation — and any improvements shown — could then be used as an extra measure to determine the board’s performance and bonus levels.
Valuation
- MTVW’s shares could be worth £210, assuming all of the group’s regulated tenancies (and similar) end immediately and the properties then fetch a fair market value.
- The following table outlines the sums:
| Property stock Sept 2014 (£k) | 317,651 |
| Less sold Allsop-assessed stock (£k) | (112,791) |
| 204,860 | |
| Allsop-premium-to-book | 2.10x |
| Sold-premium-to-Allsop | 1.65x |
| 709,683 | |
| Stock purchased since Sept 2014 | 188,415 |
| Sold-premium-to-Allsop | 1.33x |
| 250,593 | |
| Possible property stock value (£k) | 960,276 |
- I have taken the original September 2014 estate value of £318m and subtracted the (estimated) £113m book value of Allsop-assessed properties sold since that date.
- I then multiplied the £205m remainder by the 2.1x ‘Allsop-premium-to-book’ multiple and then added a 65% ‘sold-premium-to-Allsop’ gain that was enjoyed during FY 2022.
- I arrived at a £710m estimate for all of MTVW’s properties that were owned at September 2014 but have yet to be sold.
- Since September 2014, MTVW has acquired additional properties with a net £188m book value.
- I have assumed these additional properties can be sold for £251m based on management comments of wishing to buy properties at 75% of their fair market value (i.e. the ‘reversionary’ gain will be 33%).
- Adding the £710m and the £251m together gives £960m.
- This next table adjusts that £960m for 25% taxation, the £25m conventional property portfolio, net debt and other liabilities to give a possible book value of £819m or £210 per share:
| Possible property stock value (£k) | 960,276 |
| Less tax at 25% (£k) | (141,750) |
| Plus other investments (£k) | 25,451 |
| Less net debt (£k) | (18,557) |
| Less other liabilities (£k) | (6,683) |
| Possible NAV (£k) | 818,737 |
| Possible NAV per share (£) | 209.99 |
- Bear in mind my estimated value of MTVW’s property estate has not really improved during recent years. Previous estimates were:
- The £200-£214 range-bound estimates may explain why the share price has made little headway during the same time:
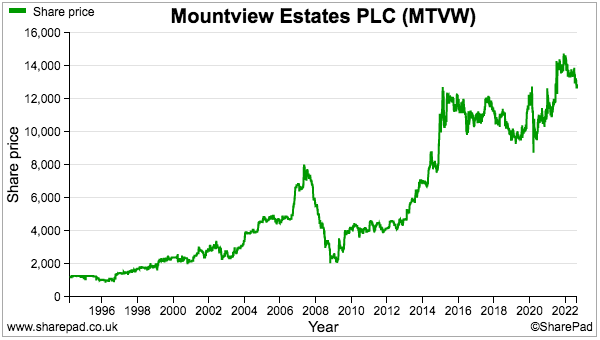
- The range-bound estimates might also suggest MTVW exhibits:
- ‘Value trap’ characteristics, whereby all the property trading is not really creating much additional benefit for shareholders, and/or;
- ‘Safe haven’ characteristics, whereby the property estate is likely to retain a steady value irrespective of future “difficult economic circumstances“.
- My estimated NAV sums are not perfect, and these questions remain unanswered:
- How long will MTVW take to sell all of its properties?
- Will future house-price advances compensate for being unable to sell all the properties immediately?
- How reliable is the 2014 Allsop valuation today?
- What impact could annual admin costs of £6m have on the calculations? (I have ignored such costs)
- My H1 2022 write-up attempted to address some of these issues through a discounted cash flow (DCF), whereby MTVW continues to sell its properties as normal but no longer buys any replacements…
- …but I am not longer sure the additional complexity of forecasting sale prices, rental income and admin costs provides that much extra insight.
- A watered-down DCF alternative is based on a similar ‘run-off’ scenario, whereby ‘run-off earnings’ are calculated by adding back stock sold during the year to reported earnings but no adjustments are made to reflect future sale prices, rental income and admin costs.
- Run-off earnings have bobbed around the £46m mark during the last four years:
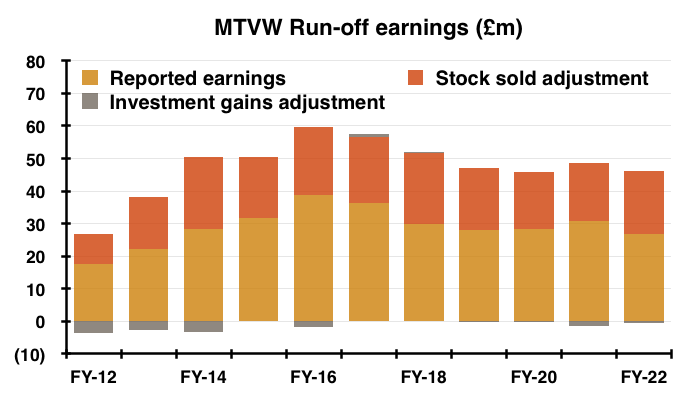
- At the start of FY 2022, MTVW’s trading-property estate had a £398m book value and during the year properties with a £19m book value were sold.
- With the year-end estate carrying a £393m valuation and, assuming stock of £19m is sold every year, MTVW would take another 21 years to dispose of its entire estate.
- 21 years of run-off earnings of £46m give an aggregate £973m or £250 per share valuation.
- Discount all 21 payments of £46m at 7% per annum, and their total net present value would equal the recent £507m market cap.
- In theory at least, the calculations imply shareholders might enjoy 7% annual returns should MTVW never buy another property.
- These run-off sums are not perfect, as they do not account for i) fluctuating sale prices; ii) lower rental income and admin costs as the property estate shrinks, and; iii) the upcoming 25% tax rate.
- Turning to more traditional valuation measures, MTVW’s shares have generally traded ahead of NAV (pink line below) following the Allsop valuation:
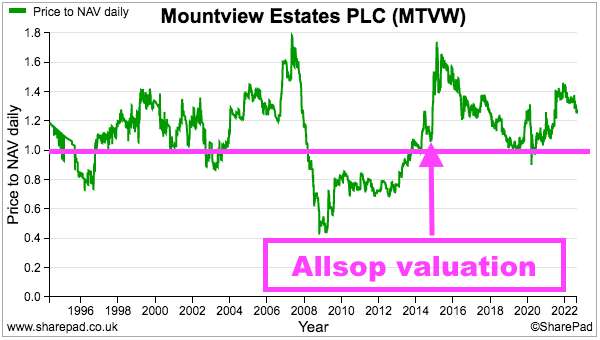
- The premium to NAV with a £130 share price is 29%, which is not the smallest surplus the shares have ever traded post-Allsop.
- The best time to buy appears to be when the market cap slides to (or below) NAV, at which point no future gains from the original property purchases are priced into the valuation:
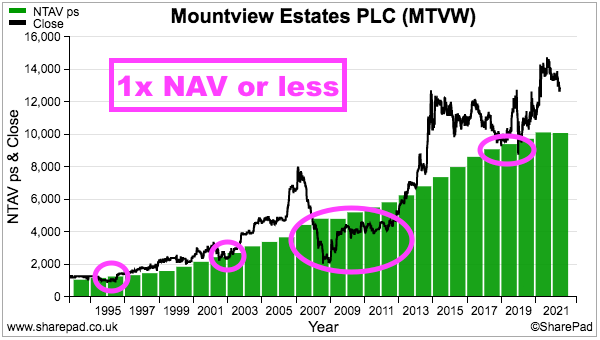
- My original MTVW purchase occurred during 2011 when the £41 shares traded at 0.75x the then £55 per share NAV.
- The 475p per share ordinary dividend meanwhile supplies a 3.6% income that is not quite at the 4%-plus level the shares have occasionally offered:
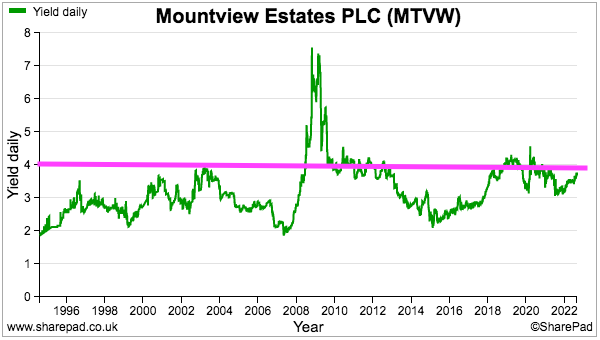
- With MTVW presently struggling to find suitable purchasing opportunities, perhaps excess cash flow can instead deliver further special dividends and temporarily enhance that 3.6% yield.
Maynard Paton

Mountview Estates (MTVW)
Publication of 2022 annual report
Here are the points of interest beyond those noted in the blog post above:
——————————————————————————————————————
1) OUR PURPOSE AND HOW WE OPERATE
No text changes here from last year, but a reminder of how the business has succeeded over time:
Our key strengths that underpin our culture and support our continuing success are:
* Our team’s experience and knowledge of their sector and the communities we operate in
* A long-term view, underpinned by family values
* A conservative approach to financing, and management of our cost base
* Investing responsibly to maintain our existing assets and acquire new assets
* Operating responsibly in the communities we serve”
This line is revealing:
“The strategy and business model are reviewed annually and discussed with major shareholders, the majority of whom have confirmed their support for the Company to continue to operate unchanged.”
The minority of shareholders not confirming their support must include the Murphy family.
2) REVIEW OF OPERATIONS
a) Group property portfolio
My blog post above refers to regulated properties, but MTVW does own other types of property:
Assured and assured shorthand tenancies are standard residential tenancies, albeit with different eviction processes. The 2022 report indicates the average value per assured tenancy is £164k.
Life tenancies may result from government-/council-type housing, and perhaps are akin to (or even include) properties subject to equity release. MTVW says:
“Life tenancy stock has nominal rental income, is bought at a greater discount to vacant possession value and has a higher margin on sale. A key attraction of this sector to Mountview is the fact that property maintenance is usually the responsibility of the life tenant and this leads to lower ongoing costs to the Group. We carry out regular checks to ensure that all properties are maintained in good condition.”
The 2022 report indicates the average value per life tenancy is £150k.
Freehold and leasehold ground rents are I presume the (small) payments made by leaseholders for the right to reside on the land owned by the freeholder. The 2022 report indicates the average value per ground rent is £6k.
Assured tenancies, life tenancies and ground rents represent £81m/20% of the £393m book value of MTVW’s property estate
b) Vacant properties and Sales
This table was introduced within the 2021 report has not shown much variation for 2020, 2021 and 2022:
Taking the exchanged (22), under offer (8), marketed by private treaty (14) and scheduled for auction (9) properties, 53 of MTVW’s properties were in various stages of being sold at the year end (versus 48 for 2021).
53 vacant-to-be-sold-at-year-end properties compares to 1,824 regulated properties and 3,377 total properties, so only 2-3% of the estate may be available for sale at any one time.
53 vacant-to-be-sold-at-year-end properties compares to 135 properties sold throughout 2022, which suggests properties may take nearly five months to sell.
For 2021, 48 vacant-to-be-sold-at-year-end properties versus 160 properties sold throughout that year suggested properties then took less than four months to sell.
This note outlines the sold properties:
The average sale price from year to year can be distorted by the occasional £1m-plus property being sold. Taking just the sub-£500k properties, the average price for 2022 was £289k versus £237k for 2021 and £251k for 2017 (the year MTVW first disclosed these figures).
c) Purchases
The 53 properties purchased during 2022 was the lowest number since 2002:
The 38 regulated properties purchased during 2022 was the lowest number since 2015 (33) and the £10.44m spent was the lowest amount since 2010 (£3m). Clearly buying opportunities were not plentiful for MTVW. At least the average regulated-property purchase price was £275k, the lowest since 2014 (£152k).
Note that MTVW creates ground rents and tenancies, and also acquires ground rents and tenancies via portfolio purchases.
Note also that cash spent on new stock in the accounts can reflect property repairs. MTVW says:
“Most properties acquired are unimproved and therefore of low average value. One of the core Mountview capabilities is to actively manage these properties: we identify opportunities to add value by carrying out refurbishments prior to their sale. The greatest gains are available at the upper end of the market and this is where we concentrate our refurbishment activities. These properties are predominantly sold by private treaty.”
“Where possible we still target those properties where the rent is capped and where our team has identified opportunities to make key improvements. For example, after discussing proposals with the tenant, installing services and amenities that have been lacking in the past can both improve conditions for our tenants and lead to an increase in rental income. ”
Therefore some of my purchase-price sums in the blog post above may be distorted a little by money spent on refurbishments.
d) Summary prospects for the group
New text for 2022. MTVW is optimistic of weathering any market downturn:
“This time last year we were still wrestling with the effects of Covid-19 – which hopefully has receded. New challenges, however, face us such as fallout from the war in Ukraine and the wider inflationary pressures and increases in interest rates bite. Just how they will affect the general housing market in the longer term is not clear. However as we have seen in harder times in the past, the houses that Mountview brings to auction are typically in high demand as they offer a lower priced entry to the housing market or, if sold to developers, leaves them with the opportunity for ‘developer profit’. We are hopeful therefore that Mountview will be well placed to weather any downturn in the housing market, should it occur through both continuing sales of attractive properties and also with the opportunity to purchase potentially discounted replacement properties both through auction and private tender.”
This text below is repeated every year:
“Since the end of the financial year on 31 March 2022 we have continued to sell and purchase properties through auctions and we are pleased with the results achieved. Given our financial strength, we believe that we are in a strong position to take advantage of any prime purchasing opportunities which may arise in the future.”
e) Investment companies
The text below is also repeated every year:
“Louise Goodwin Limited and A.L.G. Properties Limited were purchased in 1999 when we took the opportunity to build a presence in one of the best locations in London. Although rental returns have proven to be less significant than we anticipated, the investment portfolio has nevertheless generated consistently strong cash flow.
f) Risk review — principal risks and uncertainties
Text changes for 2022 that confirm the pandemic maintenance backlog has been completed:
“We respected these wishes so only essential work was carried out by contractors who abided by our Covid-19 secure regime. It increased the risk of maintenance backlog but this year we have seen a further decrease in this risk following the vaccination programme tenants were more ready to accept contractors into their houses and as a result we have caught up on the backlog that built up in the last two years meaning that this risk is now free of a Covid-19 influence.”
Various minor text changes within the principal risks, which remain unchanged as Trading Stock – Regulated Tenancies, Market, Financial, Dividends, People, Regulatory, Operations and Property Maintenance, Climate and Emerging Risk:
i) Trading Stock – Regulated Tenancies:
“the Group has performed creditably in a difficult market replacing this class of assets in the year ended 31 March 2022”
ii) Market :
“Weak macro-economic conditions triggered by external events including for example Brexit, Covid-19, the war in Ukraine and the cost of living crisis.”
iii) Climate :
“The impact on the Group of climate related matters. For example, physical risks following changing weather patterns, including extreme weather events, that could lead to increased wear and tear or other property damage and transition risks, for example following regulatory changes.”
iv) Emerging Risk:
“Where emergent risks arise and are concluded to be relevant to Mountview’s business then when considering which risks, including climate risks, to include in our framework we use the TRAP (Terminate; Reduce; Accept; Pass on) model to guide our approach.“
g) Viability statement
Text for 2022 replaces Covid impact with climate impact:
“In assessing viability, the Directors considered the principal risks (see pages 11 and 12) in severe but plausible scenarios up to and including double digit impacts on revenue streams, costs and interest, their potential impact and how to manage them. In the current year, and as further discussed in our TCFD disclosures (page 16), this analysis also included scenarios reflecting different impacts related to climate change including a heightened regulatory regime and a greater incidence of flooding or other extreme climate events.”
h) Section 172 statement
No major changes for 2022. MTVW has generally adapted to post-pandemic ‘hybrid’ working practices:
“Engagement with all stakeholder groups has evolved during the pandemic and with the vaccination programme heralding a ‘new normal’ despite continuing high rates of infection we are adopting the best practices that have also evolved combining traditional means such as face to face contact with technological means for remote contact to sustain the relationships in the manner most comfortable for our stakeholders. This evolution has also included new or adapted processes which have become effective operationally and, we believe, have a role to play absent the prior Covid-19 risks.“
i) Task force on climate-related financial disclosures (TCFD)
An all-new section for 2022, although climate issues are not top of the board’s agenda:
“We have considered our “comply or explain” obligation under the FCA’s Listing Rule 9.8.6R and confirm that we have made disclosures that we believe, in our context, are consistent with the spirit behind the TCFD Recommendations and Recommended Disclosures, but without creating structures and processes that for our context are not warranted. Specifically, in this context we believe that developing detailed plans and governance structures would be of limited value to the Group and to our stakeholders. We have identified and track the metrics described below which we believe cover the risks currently identified…
While climate is an important issue for us, given our context it is not currently a matter of sufficient significance to warrant the formation of a dedicated Board committee and is instead managed through our CWG incorporating normal functional roles. This is a matter that we keep under review and should circumstances change and greater prominence be warranted then we will revisit our approach. ”
But the board has set a net-zero target:
“Importantly, the Board has formally committed to meeting net zero before 2050 to align with the Paris Agreement objective of 1.5 degrees.”
One matter for MTVW is tighter EPC regulations leading to property improvements:
“For example, on the horizon is the expected tightening of the energy performance certificate (EPC) requirements where the detailed requirements remain subject to further consultation before becoming law.
The cost of the EPC improvement work is to be explored during 2023:
“The Climate Working Group has identified actions for the coming year including:
* As a part of our standing site inspection programme, exploring the exposure at a property level the flood or other risks faced by the 42 properties identified through the Environment Agency data
* Exploring the operational and financial impact of the tighter EPC regulations for landlords on our property portfolio as the new regulations evolve.
* Keeping under review the extent of our Scope 3 exposures as new sources are identified.
“As noted in our work programme we are monitoring the development of the EPC regulations-though the operational and financial impact will only be properly quantifiable once the final regulations, requirements, improvement options and exemptions have been published. No scenario has indicated the need to revisit our strategy and business model.
j) Operational response to Covid-19
Lots of text changes here reflecting the lower risk of Covid. A few snippets:
On rents: “We worked with tenants experiencing hardship as a result of loss of income through Covid-19 and, on a case by case basis, established the facts, advised on the help and assistance available to them and, if necessary, agreed a payment plan to safeguard their tenancy.
On audits: “The audits since 2020 have all been affected, including the need to conduct at least some of the audit work remotely. As a result of the co-operation between our finance team and our external auditors we have not needed to amend the timetable for any of our audits during the pandemic.”
On AGMs: “In 2021 we were able to welcome shareholders back to an in-person meeting, and look forward to welcoming even more shareholders to our 2022 AGM.
3) DIRECTORS’ REPORT
a) Streamlined energy and carbon reporting disclosures
Emissions were flat versus 2021:
The previous year was impacted by the pandemic and led to decreased mileage, with emissions down c17% on 2020. So a good effort keeping post-pandemic energy usage lower that pre-pandemic usage.
Not quite sure if elevated energy prices have filtered through to MTVW’s reporting. The £37 mentioned below is unchanged from 2021, while the 18.3p/kWh compares to 17.1p/kWh from 2021:
“Emissions from electricity accounts for 29.6% of Mountview’s overall carbon footprint. In addition to its head office, Mountview are also responsible for electricity use in the communal areas of 27 managed blocks of flats. Emissions have been estimated for these flats using the following assumptions:
* The Company pays an average £37 electricity charge per managed flat towards communal areas.
* The Company covers communal area charges for 27 properties.
* The average electricity standard rate is 18.3p/kWh. This is based on the average price of electricity purchased by non-domestic consumers in the UK with “very small” properties, for the last 3 quarters of 2021.”
b) Sustainability and climate change
An improvement to 91% EPC-valid properties from versus “over 80%” for 2021:
“We have obtained an Energy Performance Certificate (E.P.C.), or have valid exemptions for 91.4% of properties in our portfolio with 6.6% awaiting re-test and 2.0% yet to review due to access issues. Following these reviews, we have undertaken, where necessary, loft insulation, cavity wall insulation, provision for storage heaters and dual plate power meters.”
c) Employees
Some new text for 2022; each employees now gets a yearly one-on-one with the execs about pay:
“This is an environment in which every member of staff meets and talks with one or both of the Executive Directors, if not on a daily basis then on a weekly basis – something that is continuing under the hybrid working practices that were developed during the pandemic, and these practices are set to continue. In addition, the executives have one on one meetings with staff annually to discuss performance, bonus and salary levels individually and in general. Matters raised during these discussions are reported to the Board and Remuneration Committee.”
d) Relationship agreement
Worth examining this text in light of the iEnergizer (IBPO) delisting the other week:
“In accordance with the FCA’s Listing Rules (the Listing Rules), the Company has entered into an agreement with the Sinclair family concert party, which, as it controls more than 30% of the Group’s total issued share capital, is deemed a controlling shareholder. The relationship agreement is intended to ensure the controlling shareholder complies with the independence provisions in Listing Rule 9.2.2AR.
Under the terms of the relationship agreement, the Principal Concert Party Shareholder, Mr D.M. Sinclair (a member of the Sinclair family concert party), has agreed to procure the compliance of other individual members of the Sinclair family concert party who are treated as controlling shareholders with independence obligations contained in the relationship agreement. The Sinclair family concert party, as controlling shareholders of the Company have a combined aggregate holding of over 50% of the Company’s voting rights.
The Board confirms that, since the entry into the relationship agreement as at 5 July 2022, being the latest practicable date prior to the publication of this annual report and accounts:
* the Company has complied with the independence provisions included in the relationship agreement;
* so far as the Company is aware, the independence provisions included in the relationship agreement have been complied with by the Sinclair family concert party and their associates; and
* so far as the Company is aware, the procurement obligation included in the relationship agreement has been complied with by the Principal Concert Party Shareholder.”
Not terribly informative and I could not find the relationship agreement on MTVW’s website nor in any company RNS. A statement during November 2022 may explain why; the formal concert-party agreement has been scrapped and replaced by an informal agreement:
“The Company has previously notified its shareholders of the existence of a concert party consisting of certain members of the Sinclair family, related Sinclair family trusts and companies under the control of certain Sinclair family members (the “Concert Party”).
On 10 January 2020, the Company announced that all members of the Concert Party had entered into a new concert party agreement containing an extension of the previous agreement by a further period to 30 September 2022. The members of the Concert Party have re-affirmed to the Company that the Concert Party remains in place though they have decided that a formal agreement is no longer needed. They have also confirmed that they will continue to acknowledge the regulatory and internal obligations arising from the existence of the Concert Party, for example in relation to observing Rule 9 of the Takeover Code and notifying the Company Secretary of any proposed share transactions.
The Company has notified the Takeover Panel of the expiry of the Concert Party Agreement and the continued existence of the Concert Party. The Concert Party continues to have control of voting rights over 1,964,199 ordinary shares representing approximately 50.38 per cent. of the Company’s issued share capital.”
An informal agreement is not ideal either. But management actions over the years (i.e. rising dividends, plus special dividends of late) do not suggest a bombshell delisting is imminent, and trapping 49.6% of non-concert-party investors — including the unhappy Murphys — in a private company without an exit pay-off would not go down well. I suspect a few members of the concert party would not be happy either. So not an obvious IBPO situation here I think.
4) CORPORATE GOVERNANCE
a) Introduction
As in previous years, the board spent a lot of time discussing issues with shareholders and “other stakeholders“:
“As a result a considerable amount of Board time has been taken up with reporting back on contact with shareholders and other stakeholders and discussing and responding to points that they have raised.”
b) Compliance statement
The same corporate-governance non-compliances were incurred during 2022 as 2021, including:
* not enough independent non-execs;
* no senior independent non-exec;
* inadequate composition of committees, and;
* no formal board evaluation process.
c) Meeting attendance
Exactly the same number of meetings and attendees as 2021:
Board likes to talk about remuneration (six meetings). Two nomination meetings as well, although such meetings have yet to appoint enough non-execs to meet the corp-gov best practices. A regular AGM grievance from the Murphy family is its lack of board representation!
d) Nomination-committee report
What the nomination committee did discuss was the same as 2021:
“The Nomination Committee, and related Board discussions, covered the following matters:
• the composition of the Board and the Board’s committees
• the balance of skills, experience and knowledge required by the Board and its committees and the business as a whole
• the re-election of all the Directors at the AGM in 2022, taking into account their contribution and time commitments
• the review of the Group’s approach to and provisions for succession planning, taking account of the length of service of
each director, developing staff, diversity and gender balance and Board evaluation.“
But also on the nom-com agenda (perhaps!) was a small hint in some new-for-2022 text of seeking a new director:
“The Group has also developed succession planning arrangements to cover for both the short-term absence of a Director, or the situation where we are seeking a new Director – when the process outlined above would be followed.”
The nom-com is chaired by chief exec Duncan Sinclair, who from what I can tell does not want a Murphy representative on the board.
e) Audit-committee report
The board’s chairman should not really be chairing the audit committee as well:
“The Committee and the Board recognises that, given the size and composition of the Board, only one NED is independent. Also as Chairman of the Board I have a dual role. It has been determined that while it is not in accordance with Provision 24 of the code (see Corporate Governance Report on page 30) this is a pragmatic alternative approach given the size of the board.”
The only additional audit-committee work to that performed during 2021 was:
“In addition as they covered topics relevant to corporate reporting, the Committee participated in the tendering processes carried out to appoint advisers to assist in our TCFD disclosures (Achill were the successful consultancy) and our ESEF tagging and reporting (Tax Systems were the successful consultancy).”
The Covid-risk text from 2021 has been replaced by climate-risk text for 2022:
“Following the implementation of the TCFD reporting requirements, the Committee in conjunction with our Climate Working Group (see TCFD disclosures page 16) explored scenarios that could lead to enhanced exposure to the Company from the impact of both transition and physical risks. This work included exploring whether the effect of the impact of such risks could lead to a material impact on the accounts that met the criteria for being considered a liability, or contingent liability. As a result of the work the Committee and the Climate Working Group considered that at this point the exposures were all at a level that could be readily met within current operating budgets and equally did not meet the recognition criteria. As a result the Committee concluded that currently no adjustment to the accounts for climate related matters was needed, though equally recognised that changes in legislation or a rapidly worsening climate – notably warming might change this picture. This matter is therefore being kept under regular review by both the Committee and the Climate Working Group. Finally, as noted above, the Committee considered the impact of climate on the going concern and viability statements.”
Various reporting changes could appear for 2023:
“In particular for 2022/23 this will include the changes in the Listing Rules to accommodate reporting on diversity and any changes to the regulatory environment following the Government’s response to the BEIS consultation on Restoring trust in audit and corporate governance – whether this be through the Code, primary or secondary legislation or through any oversight body (for example the Audit, Reporting and Governance Authority (ARGA), the new regulator to replace the FRC).”
f) Remuneration-committee report
The main points here were noted in the blog post above.
Some background to deciding executive pay, including the £1m cost to clearing the pandemic maintenance backlog:
“Specifically when looking at the performance of the Executive Directors we have been mindful of both their contribution to ensuring that operations and the various transitions we have faced during the year ran smoothly, and also the drivers behind the fall in profits during the year. We have referred in prior years, and elsewhere in this Annual Report and Accounts, to the role of chance and external factors outside the role or control of the Executive Directors when it comes to the cost of properties sold and thus gross margin, but in the current year there were also two additional factors. The first was that we took account of the effect of managing the catch-up of the maintenance backlog that arose during the pre-vaccine phase of Covid-19 (£1M) and also the role of the revaluation change as computed by Allsops which was also £1M down on 2021, and is something that is outside the control of the Executive Directors. Using our discretion when taking these factors into account as part of our consideration of the financial metrics the Remuneration Committee, agreed to hold the total of salary and short term incentive steady year on year.
Applying these principles to the year under review the bonus awards for the CEO and CFO were set at £479,000 and £330,000 respectively. ”
This year’s report carries lots of text about the remuneration policy review.
Advisers and shareholders helped prompt the review:
“In addition to the Remuneration Committee’s own deliberations, recent feedback and comments received from advisers and shareholders have informed the process.“
The lower-risk nature of the business persuaded the board to rebalance executive pay towards basic salaries:
“The maturity of these aspects of the business mean that, in the Remuneration Committee’s view, the inherent risk of the operations is lower than it has been in the past and lower than for many other quoted companies. The Remuneration Committee’s main conclusion from reviewing the current structure was that it would be appropriate to alter the components and balance of the Executive Directors’ remuneration packages to better reflect this risk profile – and notably to adjust the weighting of remuneration from bonus to salary whilst broadly maintaining the level of total remuneration.”
Consultations were undertaken:
“In developing the proposals set out in this report, the Remuneration Committee, informed by detailed consultation with, and research by, FIT and in their role as our employment lawyers responsible for our employment agreements, review of proposals by Winckworth Sherwood LLP, and through consultation with the Concert Party and other major shareholders looked at the mix between fixed (salary) and variable (STI) remuneration and also at the relative balance of remuneration between the Executive Directors. ”
A 30%-plus rejection of the new remuneration policy at the 2022 AGM suggests not every shareholder was happy about the revised pay arrangements.
The 2022 report included new text on clawbacks provisions, shareholding requirements and discretion. All seem pretty standard:
“Malus and clawback provisions operate in respect of the annual bonus to protect shareholder interests and reduce the risk of inappropriate risk taking…
The Company has no shareholding requirement for Executive Directors in view of their current substantial personal holdings, although the Remuneration Committee reserves the right to introduce such a requirement should new Executive Directors be appointed in the future…
Consistent with market practice, the Remuneration Committee retains discretion over a number of areas relating to the operation and administration of these [bonus] awards.”
The revised remuneration-policy small-print reveals a handful of changes.
Executive salaries now have an annual increase cap:
“While all the factors above are taken into account, the percentage annual increase will normally not exceed the small cap upper quartile figure increase for executives as reported annually by FIT or other reputable provider of survey data.
And the maximum bonus is reduced from 150% to 100% of salary:
“Any award under this scheme will be set at a level that aligns the short- term incentive award with the Group’s financial performance, while also reflecting non-financial contributions and remaining comparable with our peer group. The maximum percentage of base salary payable for an award under this scheme is 100%.”
The executives received 3% pay rises last year:
I should add the executives do not receive pension contributions and MTVW does not operate any form of share scheme.
Executive pay on a rebalanced basis will increase c4% for 2023 (to £830k for the chief exec and £675k for the finance director). The non-execs will also receive a 3% fee increase.
Confirmation the composition of the remuneration committee does not meet corp-gov best practices:
“During 2021/2022 the Remuneration Committee comprised three NEDs, including the Chairman who was independent on appointment, and one independent NED. The Remuneration Committee and the Board recognise that this is not in accordance with Provision 32 of the Code (see Corporate Governance Report page 30) however, given the size and composition of the Board, believe that this alternative approach to the membership of the Remuneration Committee is pragmatic.”
The 2020 and 2021 AGMs also witnessed 30%-plus protest votes on pay:
5) NOTES TO THE CONSOLIDATED FINANCIAL STATEMENTS
a) Accounting policies
No changes here from 2021. A reminder MTVW does not carry stock provisions and properties typically become available for sale when the tenant dies:
“Carrying value of trading stock
The Group’s residential trading stock is carried in the balance sheet at the lower of cost and net realisable value.
As the Group’s business model is to sell trading stock on vacancy, net realisable value is the net sales proceeds which the Group expects on sale of a property with vacant possession. Given that by applying our buying criteria all stock is purchased at a discount to the value with vacant possession the Directors consider the risk of impairment to be low and accordingly the Group has no NRV provision.
Inventory expected to be settled in more than 12 months The Board estimates that inventory of £18.3 million will be settled within the next 12 months, with the remaining inventory value expected to be settled in more than 12 months. This estimation is based on the average cost of sales of inventory over the last three year period. Mountview’s business, both historic and current, has involved the purchase for sale of residential properties subject to regulated tenancies, such properties being sold when vacant possession is obtained.
Regulated tenancies by their nature are not for any specific period of time and in most cases they do not become vacant until the death of the tenant.
It is difficult to predict with any certainty the time at which Mountview’s inventory properties might become vacant.”
b) Profit from operations and staff costs
Audit fees of £68k for a group reporting a £35m profit last year seems good value for money:
Same number of 29 employees since 2019. Revenue per employee at £2.3m remains huge, but below the £2.4m-£3.1m range witnessed between 2013 and 2018. Exclude the executives and average employee costs are a hefty £92k per head, up 5% on 2021 (£88k) and up 104% since 2012 (£45k).
Transactions per employee are not great. 53 purchased properties and 135 sold properties gives 188 transactions, which per employee is 6.5 versus 8.3 for 2021 and between 10-25 between 2005-2018. Maybe transaction administration has become more complicated. Or maybe there are just fewer properties to buy and sell at present.
c) Inventories of trading properties
A repeat of why MTVW does not undertake a repeat revaluation of its trading stock:
“Thus the valuation is not a useful tool for running the business because we are always going to await vacant possession, and no perceived uplift in value can justify selling a tenanted property. The nature of our business and the rules and conventions under which we operate place no obligation upon us to value our trading stock at any given time and therefore the valuation has not been updated since.”
d) Receivables and payables
Welcome, super-small numbers here for a business reporting revenue of £66m:
e) Bank loans
Bank loans not a problem at £19m versus a property estate with a £393m value (plus other property investments). But worth watching for interest-rate increases given the current economic climate:
The 2022 average-rate increase of 0.1% does not appear alarming. And the 2022 rates were less than those reported for 2020.
The renegotiated £60m loan due March 2027 was encouragingly undertaken at the same 1.9% premium as the preceding facility. The £20m loan with HSBC may be renewed during November 2023, and hopefully can be renewed at the same 2.1% premium.
I see the strange loans connected to the chief executive have been cleared.
f) Related-party transactions
Further confirmation of loans associated with the chief executive have been cleared:
Why MTVW owes the chief exec £10k through an informal loan is very odd. No doubt a ‘quirk’ of a family-run company that outside shareholders have to accept.
6) INDEPENDENT AUDITOR’S REPORT
BSG Valentine has been MTVW’s auditor since 2007. Another four years will make 20 years and MTVW will then have to seek a fresh auditor.
No major text changes from the auditor between 2021 and 2022.
a) Key audit matters
Text identical to that of 2021. Key audit matters remain revenue recognition, the carrying value of property inventory (held as stock) and the carrying value of investment properties (held as fixed assets).
b) Materiality and scope
Overall materiality reduced by £0.1m to £4.2m, based once again on approximately 1% of gross assets. Performance materiality and income-statement materiality levels were reduced by £0.1m, too. Plus an interesting new snippet for 2022: “the low level of errors found in prior years“.
Full-scope audits on the entire group:
“We performed full scope audits of each entity using levels of materiality applicable to each entity, which were lower than Group materiality. At the Group level we also tested the consolidation process. There were no significant changes to our audit approach.”
7) TABLE OF COMPARATIVE FIGURES
As noted in the blog post above, this summary table includes various director-pay ratios:
Are the executives worth it? I take a pragmatic approach; if the company and executives have done well over time, then probably best not to fix what is not broken. But the bosses are not ‘thin cats’ and the re-balancing of pay (see point 4f) and regular bonuses (see blog post above) have to be accepted by outside shareholders.
Slightly odd the table does not include NAV, which many will view as the prime benchmark for MTVW’s progress.
Maynard
Mountview Estates (MTVW)
Announcement re the Sinclair Family Concert Party published 14 November 2023
Here is the full text:
——————————————————————————————————————
The Company has previously notified its shareholders of the existence of a concert party consisting of certain members of the Sinclair family, related Sinclair family trusts and companies under the control of certain Sinclair family members (the “Concert Party”).
On 10 January 2020, the Company announced that all members of the Concert Party had entered into a new concert party agreement containing an extension of the previous agreement by a further period to 30 September 2022.The members of the Concert Party have re-affirmed to the Company that the Concert Party remains in place though they have decided that a formal agreement is no longer needed. They have also confirmed that they will continue to acknowledge the regulatory and internal obligations arising from the existence of the Concert Party, for example in relation to observing Rule 9 of the Takeover Code and notifying the Company Secretary of any proposed share transactions.
The Company has notified the Takeover Panel of the expiry of the Concert Party Agreement and the continued existence of the Concert Party.
The Concert Party continues to have control of voting rights over 1,964,199 ordinary shares representing approximately 50.38 per cent. of the Company’s issued share capital.
——————————————————————————————————————
All a bit mysterious as to why a formal agreement is “no longer needed” when one has seemingly been in place since 1999 as per the RNS of 5 September 2013:
“The Company has previously notified its shareholders of the existence of a concert party consisting of certain members of the Sinclair family, related Sinclair family trusts and others (the “Concert Party”). In 1999 the Concert Party entered into an agreement (revised in 2006) setting out certain terms of conduct between members of the Concert Party including, inter alia, a common voting intention (the “Concert Party Agreement”).”
That 2013 RNS also stated:
“This revised agreement sets out certain terms of conduct between the concert party members, including the event of an offer being made for the Company. The concert party members are not bound under the terms of the revised agreement to vote together at a general meeting of the Company.”
Pure speculation of course, but I wonder if the scrapping of the formal Party agreement signals the membership is becoming a little bit more fractured.
The Concert Party controlled 53.5% of the shares during 2013 (and 2016), but had declined to 51.2% by 2020 and to 50.4% today.
The 10 January 2020 RNS listed the Concert Party membership as:
Anray Limited
Mrs Elizabeth Langrish-Smith
Mrs Emma Adjaye
Mr James Langrish-Smith
Mr Matthew Langrish-Smith
Scorpion Estates Limited
Mrs Susan Mary Simkins
Mr Ronnie Simkins
Miss Louise Simkins
Mr Thomas Simkins
Whitehart Holdings Pty Ltd
Viewthorpe (Old) Limited
Mr Duncan Sinclair
Sinclair Estates Limited
The Sinclair Charity
Viewthorpe (Subco2) Limited
Mrs Angela Williams
Mr Rupert Williams
Courtland Capital Limited
Frank & Daphne Sinclair Grandchildren Settlement
Maynard
Mountview Estates (MTVW)
Result of General Meeting published 21 November 2022
The two non-execs voted out at the AGM have been duly re-elected. Here is the full text:
——————————————————————————————————————
“Mountview Estates P.L.C. is pleased to announce that at the General Meeting held today, the Resolutions were duly passed on a poll, the results of which are set out below:
The Company is disappointed, that there was a significant minority vote (being more than 20 per cent) against each of the Resolutions. As we have done previously, we will continue to seek to engage with independent shareholders and will take into account any feedback around their concerns and considerations in the future.”
——————————————————————————————————————
This General Meeting was the sixth in six years, and for the sixth time the Sinclair family concert party (see comment above) reinstated the non-execs voted out by unhappy independent shareholders at the AGM.
Unhappy shareholders have been increasing in number, albeit slowly, over the years. Votes against during this meeting were 1,050k, versus 1,024k for 2021 and 826k for 2017. 1,050k votes = 27% of the share count and 34% of the votes cast in this latest meeting.
The voting back and forth is likely to persist because the unhappy shareholders, mostly the Murphy family with a claimed 24% of the vote, would like a seat on the board to influence proceedings. The Sinclair family concert party (led by chief executive Duncan Sinclair) is meanwhile quite happy with the board’s present membership.
Maynard