10 January 2020
By Maynard Paton
Happy January!
I trust you enjoyed the festive break and are now ready to battle the market for another twelve months!
This 5,562-word post provides a ‘year in review’ of my current portfolio holdings. I recap how each of the underlying businesses performed during 2019, as well as provide a few remarks about valuation.
As I mentioned this time last year, I find writing such reviews extremely useful — not least because I double-check my investment logic to ensure I am still invested for the right reasons! The upsets I will suffer during 2020 will most likely be caused by the shares I already own rather than by new shares I purchase.
I performed the same review on this blog at the start of 2015, at the start of 2016, at the start of 2017 and at the start of 2018.
During 2019, my portfolio gained 13.1% on a bid-price-to-bid-price basis that included all dividends and dealing costs. This post outlines that performance in more detail.
I have reviewed each of my holdings below in order of size within my portfolio.
I have accompanied each review with a SharePad chart to show how each company has performed over the longer term. The charts display the share price, earnings per share (or in two cases, net asset value per share) and dividend per share.
Of course my calculations, logic, assumptions and charts may have little bearing on the future… so please do your own research!
Contents
- Tristel
- Mountview Estates
- Bioventix
- Daejan
- FW Thorpe
- S & U
- City of London Investment
- M Winkworth
- Andrews Sykes
- Mincon
- System1
- Tasty
- Castings
- Getech
- Oleeo
- Summary
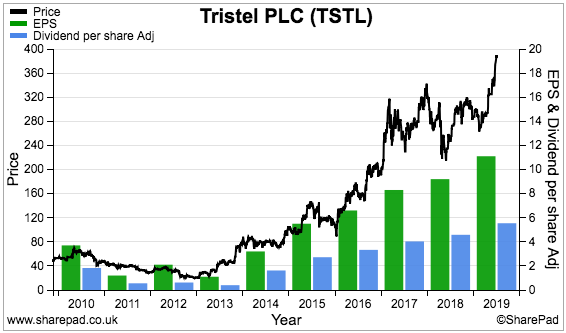
1) Tristel (TSTL), price: 380p, market cap: £170m
TSTL became my largest holding during 2019 following a lovely 58% share-price surge. Upbeat management guidance within October’s full-year results alongside (possible) hints of progress finally occurring in the United States may have caused the optimism.
TSTL’s medical disinfectants continue to underpin a very respectable business. The group’s foams and wipes are used daily within most UK hospitals — plus an increasing number overseas — and should underpin a reliable top line.
Various patents, secret ingredients and scientific testimonies meanwhile support a healthy 20% operating margin and robust 26% return on equity.
Brexit ‘stockpiling’ and the purchase of the group’s Dutch, Belgian and French distributors during 2019 helped propel annual revenue up 18%, profit up 20% and the dividend up 21% — and set new records for the sixth consecutive year. The balance sheet has commendably remained cash rich and debt free.
Open-day scuttlebutt revealed France could become a sizeable market due to new disinfectant regulations. The purchase of the group’s Italian distributor also looked a sensible move.
The faster-growing international division now represents 55% of total group revenue, and supports management’s public forecast of revenue compounding by up to 15% a year until 2022.
Management’s revenue projection does not include any sales from the US, which is just as well as the associated regulatory-submission project has been ongoing since 2014. TSTL (unsurprisingly) withdrew all timing predictions for the milestone event — FDA product approval — during February.
I am hopeful of an FDA product submission this year, but I was hopeful twelve months ago, too.
I bought TSTL during 2013 and 2014 at an average of 46p and then sold 75% at various occasions (and for various reasons) during 2014, 2015, 2016 and 2017 at 79p, 100p, 123p and 289p. I have learnt my lesson not to top slice and have not sold any since.
My October sums suggest the shares are presently priced beyond 30x earnings. The premium rating appears understandable given the firm’s competitive position, management’s growth forecast and the appealing accounts.
My TSTL buy report | All my TSTL posts
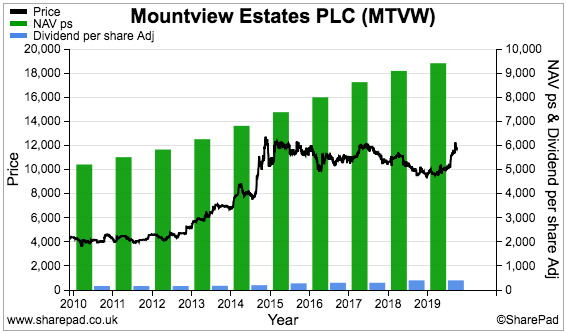
2) Mountview Estates (MTVW), price: £117, market cap: £456m
I increased my MTVW position by 21% during 2019, buying at a £98 average (Q1, Q2).
I first invested in this regulated-tenancy landlord during 2011. I bought initially at £42 and again at £98 during 2018.
The shares rallied 27% last year, which was a little odd since MTVW’s results were not spectacular.
The firm blamed Brexit for full-year profit sliding 7% and a standstill first-half performance. Bear in mind that 2019’s lacklustre numbers followed some rather dull 2017 and 2018 figures.
Nonetheless, I am hopeful the outcome of the general election could lead to a lower level of Brexit “uncertainties” for MTVW to contend with.
Other signs of encouragement include an improved gross margin and the disposal of four ‘non-core’ properties for prices well above book.
Net asset value (NAV) continues to move higher, and inched 4% to a new £96 per share record during the twelve months. Since the current chief executive took charge in 1990, NAV has rallied 17-fold (+10% per annum average) while the dividend has jumped 35-fold (+13% per annum average).
The chief executive and connected parties continue to control 51% of this business, and the board’s corporate governance keeps prompting AGM protest votes. I attended the lively AGM during August, where pointed questions were raised about payoffs to former directors and the abilities of the non-execs.
One disappointment from the AGM was management’s indecisive remarks about a formal estate re-valuation. The previous valuation was conducted during 2014 — and is now very stale for shareholders trying to guess what the business might one day be worth.
I still calculate MTVW’s NAV could be £200-plus per share should all of the group’s properties lose their regulated-tenancy status and are then sold.
The £117 shares are not quite the bargain they were this time last year at £92, but they could prove to be a safe haven in a choppy market. A 3.5% yield, modest gearing and director talk of “good purchases” should not create too many headaches during 2020.
My MTVW buy report | All my MTVW posts
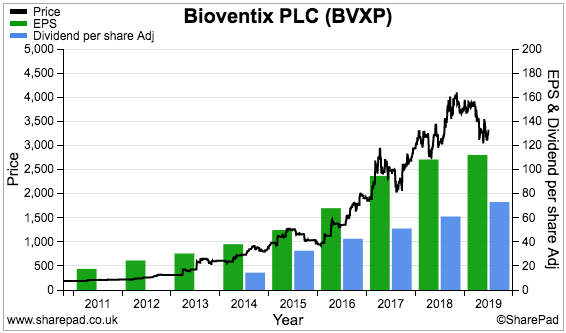
3) Bioventix (BVXP), price £32.70, market cap: £168m
BVXP dropped from first to third in my portfolio last year. The 9% share-price advance for 2019 was well below the superb gains made during previous years — I bought BVXP during 2016 at £11 and the price has since tripled.
The 2019 results from the antibody specialist were quite satisfactory. Full-year revenue and profit increased by 16% and 14% respectively, although progress slowed markedly during the second half.
H2 revenue and profit gained c10%, versus c24% advances reported for H1.
The 2019 figures were nevertheless BVXP’s best ever, and extended the group’s run of substantial yearly growth to nine years.
The accounts remain among the classiest in the stock market, not least due to the terrific 75% operating margin and wonderful 54% return on equity.
Cash continues to mount up, too, and shareholders were rewarded during 2019 with a 20% dividend lift and a 47p per share special payout. A one-off dividend has now been declared for the last four years.
The main concerns at present are the loss of 13% of revenue from a 2021 product expiry — and whether BVXP’s other antibodies can make up the shortfall.
The new, much vaunted, troponin antibody generated just 1% of 2019 revenue, while 46% of revenue remains dependent on a vitamin D antibody — demand for which, the board keeps warning, will one day “plateau”.
An unsettling development last year was management’s tweaked outlook, which suggested various pipeline antibodies may require five years of further work. Superior progress beyond 2020 could therefore be very dependent on troponin.
The 29x near-term P/E reflects the group’s exceptional economics and, as I am sure we all know by now, holding on to quality names — even when their immediate valuations appear rich — quite often rewards investors.
For the year ahead, I have my fingers crossed that troponin sales can take off, vitamin D income will not stagnate and another special dividend can be declared.
My BVXP buy report | All my BVXP posts
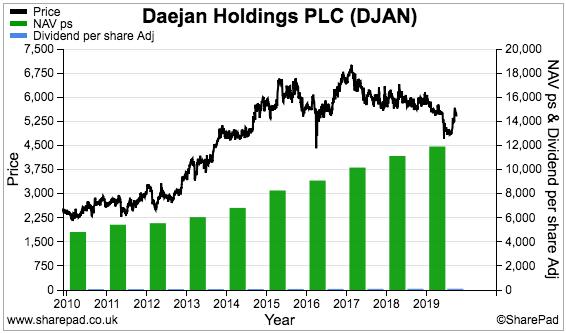
4) Daejan (DJAN), price: £54.10, market cap: £882m
Value bargain or value trap? I am sure DJAN is the former but the market reckons the share is the latter.
My trades tell the story. I first bought DJAN in 2015 at £60, then during 2016 at £53 and again during 2018 at £57. While the shares went nowhere, the commercial-property group’s net asset value (NAV) advanced from £82 to £116 per share — up 41%.
Undaunted by the flat share price, I increased my holding by 44% during 2019 at a £53 average (Q2, Q3) as NAV crept to £120 per share.
History suggests buying DJAN at a 50% (or more) discount to NAV works out quite well for long-haul shareholders. Maybe this time greater patience is required. Or maybe this time is different — and something is wrong.
True, DJAN’s management cited Brexit for the prospect of reduced NAV growth in the “immediate future”. New rent laws in New York also led to a £46m devaluation and put DJAN on course to register its first annual valuation loss since 2009.
But this business has survived and prospered during much worse. After the current chairman took charge during 1980, NAV has since soared 87-fold (+12% per annum average) while the dividend has since expanded 29-fold (+9% per annum average)
I am sure that wonderful track record and the family management’s 80% shareholding are not coincidental.
Similar to MTVW, perhaps DJAN will welcome the outcome of the general election and a reduction to the previous “high levels of political and economic uncertainty”.
I should add that 20% of DJAN’s net assets are located in the States, while net debt is equivalent to just 13% of the total property estate. The modest gearing should allow DJAN to make attractive purchases if the wider sector falters.
Management at the AGM rebuffed suggestions of instigating buybacks to kick-start a re-rating, so I can only trust various development projects can continue to bolster NAV and rental income… and eventually make DJAN too large for the stock market to ignore.
I have not sold any DJAN shares to date and am unlikely to start selling in 2020.
My DJAN buy report | All my DJAN posts
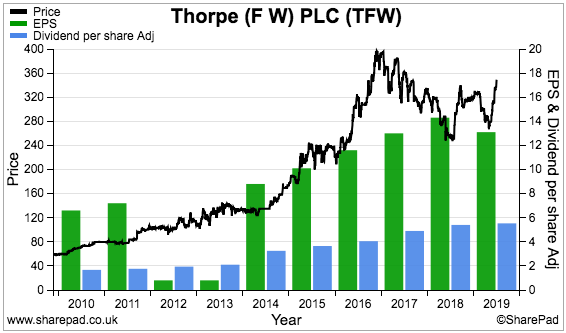
5) FW Thorpe (TFW), price: 350p, market cap: £407m
Sometimes I do not understand why share prices move the way they do.
Take TFW. Last year this share was my second biggest winner with a delightful 36% price jump. And yet the lighting specialist reported rather mixed progress.
A “significant general downturn in [UK] market conditions” that was blamed on Brexit caused 2019 revenue to flat-line and profit to drop 10%. TFW’s first half was particularly challenging.
The full-year statement also carried unnerving remarks about slowing demand for LED products and an unusual move into non-lighting applications.
At least the impressive dividend — lifted every year since 2002 — was improved, albeit by 2%.
It’s not as if these shares were rock-bottom cheap this time last year either. Back then the valuation was equivalent to approximately 17 times earnings. My latest sums indicate the multiple is now 24x.
Talk of an improved order book at the AGM was reassuring. And the outcome of the general election could help, too — TFW recently bemoaned the lack of “government-led investment”.
TFW remains a very respectable business. The illustrious dividend history, a 16% operating margin, the 24% return on equity and a £57m cash hoard suggest the company would still prosper if trading conditions stayed subdued.
Overseeing developments is the Thorpe family, which includes one executive and two non-execs, and has at least £200m riding on the share price.
I hope to see a pick-up in business during 2020 — which my 24x P/E appears to be expecting. I also wonder if that cash hoard could be used to fund another special dividend, further overseas acquisitions, or both.
I bought TFW during 2010 at 69p, during 2011 at 79p and during 2012 at 80p, and sold 25% of my holding during 2016 on valuation worries at 234p. TFW is therefore another stock that has taught me something about decent companies and running your winners.
My TFW buy report | All my TFW posts
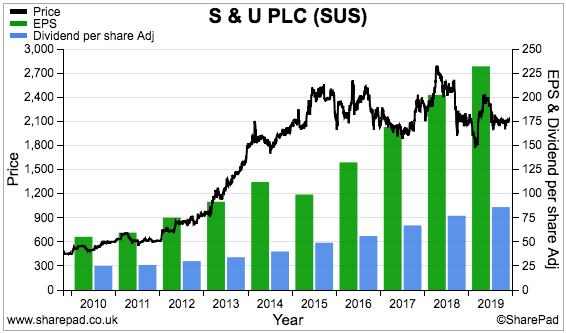
6) S & U (SUS), price: £20.80, market cap: £252m
I doubled my shareholding in SUS during 2019 at £19 (Q2) to propel the specialist lender from eleventh to sixth within my portfolio. I first bought during 2017 at £21.
I am hopeful September’s half-year results marked an improvement in fortunes for SUS. The statement revealed the group’s lowest level of bad debts for 18 months after management implemented various underwriting improvements.
The same H1 announcement disclosed revenue up 7%, profit up 3% and the dividend up 6% — which admittedly were behind the double-digit advances recorded at the full-year stage during March. Still, the H1 progress and a reasonable December update has put the main motor-finance division on course to celebrate its 20th year of consecutive growth in 2020.
SUS was not the most exciting share to hold last year — the price gained only 1%. However, the firm’s impressive dividend — the payout has not been cut since at least 1987 — sustains a very handy 5.8% yield.
A lot rests on SUS’s managers and how they cope with what appears to be a less favourable lending environment. At least they have run the business for decades and their family have more than £125m invested. The directors have also referred to “political vacillation”, so SUS may well be another beneficiary of the general election.
One downside for 2020 is the retirement of the managing director of the main motor-finance division. He had overseen the division’s 20-year growth run and I can only trust his successor does not embark on any radical operational changes.
A useful company presentation last year informed of tip-top FCA compliance, a dependence on brokers for new customers and in-house IT and algorithms creating a competitive advantage.
SUS does not sport the greatest of financials. In particular, sizeable debt is required to fund customer loans and leads to a modest 12% return on equity. That may explain why the shares trade on an 11x multiple.
My SUS buy report | All my SUS posts
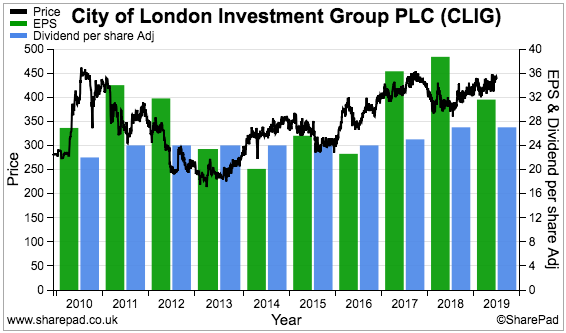
7) City of London Investment (CLIG), price: 431p, market cap: £114m
This time last year I wrote: “I suspect I will just sit back and collect the dividends during 2019 as well.”
I did just that — and fortunately collected a useful special dividend, too. In fact, CLIG delivered a total 11% income during 2019 on top of a worthwhile 16% share-price gain.
The special dividend accompanied February’s underwhelming interim results. The fund manager admitted its funds under management had dropped 9% during the six months and had thumped profit by 21%.
CLIG thereafter prospered, with funds under management advancing 17% by June and by a further 12% by December. At a fraction over $6bn, funds under management now stand at their highest level since March 2011.
But CLIG’s progress has not been perfect. In particular, July’s annual summary showed funds under management had increased almost entirely because of rising markets rather than from customers adding new money. New clients remain frustratingly elusive.
Other drawbacks include fee rates being trimmed lower and employees (seemingly) taking a greater share of earnings simply because the markets — and therefore client fees — have rallied. CLIG’s flagship funds appear not to have thrashed their benchmarks during recent years, too.
Possibly the main worry is the recent retirement of founder/chief executive/8% shareholder Barry Olliff. An important attraction to this business was Mr Olliff’s candidness with shareholders — from providing earnings/dividend estimates to alerting investors to his future share disposals. I am not sure whether Mr Olliff’s successor will continue publishing such worthwhile information.
CLIG’s accounts are still robust, with margins at a super 33%, return on equity at a splendid 44% and net cash/investments standing at a chunky £28m.
The aforementioned $6b funds under management have elevated my latest earnings guess to approximately 42p per share — versus the 34p per share CLIG reported in July. I make the cash-adjusted P/E to be less than 9.
I invested at a 281p average between 2011 and 2013, sold 42% of my holding during 2015 at 335p, and will once again sit back and collect the dividends in the year ahead.
My CLIG buy report | All my CLIG posts
Enjoy my blog posts through an occasional email newsletter. Click here for details.
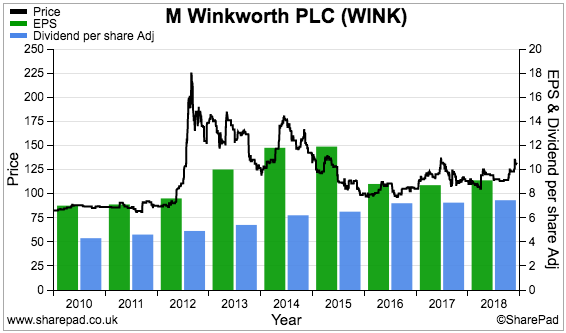
8) M Winkworth (WINK), price: 125p, market cap: £16m
WINK is another share that I hope can benefit from the outcome of the general election.
The estate-agency franchisor said in September that it hoped to “take advantage of any upturn once Brexit uncertainty clears”. The group earns approximately 80% of its income from franchisees based in London, the property market for which has seen annual transaction numbers shrink by at least 10% since the Brexit vote.
WINK’s 2018 figures were not that bad considering the subdued market conditions. Revenue improved by 10% while profit advanced by 5%. Bear in mind, though, that earnings were 25% below those reported for 2014 and 2015.
One highlight from the full-year statement was confirmation that lettings income had exceeded property-sales commissions for the first time. A greater dependence on lettings income ought to make WINK’s progress a little more predictable.
Consistently capturing market share from London rival Foxtons was also reassuring, as was the 24% operating margin, 63% return on equity and £4m net cash/investment position.
WINK has consistently lifted the annual dividend following its 2009 flotation, and during 2019 the quarterly payouts were raised by 0.05p to 1.9p per share. The 6% or so yield was a very useful addition to last year’s 16% share-price gain.
Note that the dividend is covered just 1.15x by my 8.7p per share earnings guess. At some point earnings will have to advance to keep the payout improvements going.
My sums indicate a P/E of 10-11 adjusted for WINK’s cash and investments, which does not seem awful value given the group’s appealing financials, the possibility of improved post-Brexit trading and stable family management that still own a fraction over 50% of the business.
I bought initially at 90p during 2011 and then sold 70% of my holding during 2013 and 2014 at 173p. I then increased my residual investment twelve-fold after purchasing at an average 116p during 2016 and 2017.
My WINK buy report | All my WINK posts
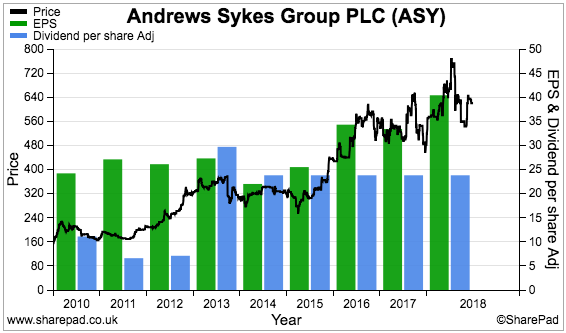
9) Andrews Sykes (ASY), price: 580p, market cap: £245m
ASY has become a payout hero within my portfolio.
I bought the shares during 2013 at 233p and subsequent dividend payments now represent 69% of the purchase price. Another three years of the 23.8p per share payout should see my entire investment recouped!
I really should have bought more ASY after 2013, but never did. Indeed, I would love to buy more during 2020 if the price is right. My latest sums point to possible earnings of 36p per share and a cash-adjusted P/E of 15, which is not in the bargain basement.
ASY’s earnings can bob up and down… and following bumper 2018 results, the first half of 2019 witnessed profit dive 25%.
ASY supplies heaters, boilers and air conditioners for hire, and can become very busy if the weather turns very hot or cold for long periods. Unfortunately, 2019 did not repeat the deep snow and extended heatwave of 2018.
Still, September’s interims and the company’s own blog have hinted that trading during the second half of 2019 might have improved upon the first. Note, too, that a quarter of the business now serves Europe — where new depots continue to open and the weather can be more extreme than in the UK.
ASY retains its core financial attractions, with the operating margin and return on equity regularly topping 20%, and the last balance sheet carrying £20m net cash.
The free float remains tight. The chairman and his family control 90% of the business, and I understand a listing is maintained because the family are ‘hands off’ directors and like the reporting discipline that a market quotation demands.
I should add that the chairman will celebrate his 100th birthday next month — which must surely make him the oldest company director on the London market today.
What succession plans are in the place — and what then happens to ASY when those plans are implemented — remain a mystery to outside investors.
My ASY buy report | All my ASY posts
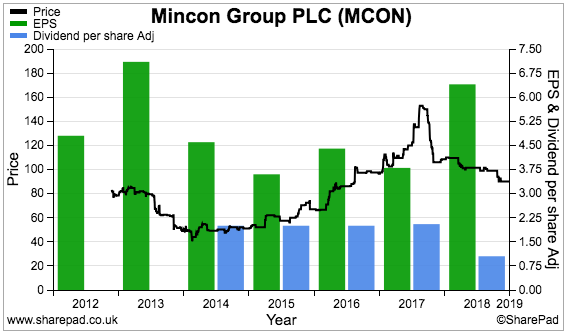
10) Mincon (MCON), price: 85p, market cap: £179m
Last year was not great for MCON.
True, annual results published in March showed revenue and profit enjoying double-digit gains and reaching all-time highs.
However, the results also admitted the industrial-drill manufacturer would spend much of 2019 “consolidating” its operations. The annual report then revealed management would determine which products, customers and markets were no longer worth the “investment and risk”. I guess the various acquisitions made since the 2013 flotation may have created some ‘non-core’ activities.
Half-year results in August showed revenue up 8% and profit down 14% as the effect of an acquisition could not offset a “softening” market and “competitor behaviour”. The follow-up Q3 update — a contender for the most long-winded RNS of 2019 — disclosed a further weak performance.
The rather mixed progress has been reflected by both margins and returns on equity declining to a so-so 12%. Huge investment in working capital — stock levels represent an enormous 40% of revenue — remains a significant drawback and has left the balance sheet carrying a small net debt position.
A lot rests on MCON’s veteran family management — which owns 57% of the business — to enhance the group’s efficiency.
The board’s plan is to turn the firm into a direct and full-service supplier of drills and bits, which should cut out intermediaries, earn reliable contract income and improve the financials.
The directors have outlined the plan (point 1) using many appealing phrases: “develop a long term sustainable competitive advantage”, “the creation of intellectual property” and “building a business for the future”. But for now a wider ‘moat’ has yet to be dug.
These shares fell 19% last year after the market paid more attention to the accounts than the visionary directorspeak. Mind you, the shares still trade at 18 times my earnings guess — which suggests some investors continue to appreciate the long-term possibilities.
I bought MCON at 45p during 2015 and have not touched the holding since. Management’s new strategy will have to start bearing fruit before I add more.
My MCON buy report | All my MCON posts
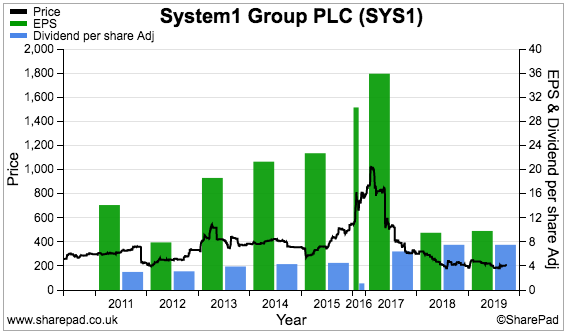
11) System1 (SYS1), price: 200p, market cap: £25m
Spending £2.4m a year to develop the new AdRatings service — and earning subscription revenue of only £24,000 in return — was the predominant matter concerning SYS1 last year.
Whether these shares are cheap or expensive currently depends on whether AdRatings ever comes good.
Assume the new service will quickly cover its £2.4m annual running costs, and the shares could be a bargain at 8x possible earnings.
Assume the new service will instead keep on losing £2.4m annually, and the shares seem richly priced at 23x possible earnings.
I must confess, I am not sure either way.
What does seem apparent is that AdRatings needs to take off to kick-start superior growth.
SYS1’s ‘core’ market-research consultancy — the company is known mostly for rating the effectiveness of television adverts — has grown its top line by just 5% a year since 2012. June’s full-year results showed flat revenue and underlying profit rebounding 80% following significant cost cuts. The subsequent interim statement told a similar story.
Director remarks at the AGM revealed various hurdles the group has to overcome — including attracting the attention of chief marketing officers and persuading clients to ditch long-standing practices and suppliers. Compiling extra “validation” data for AdRatings is required, too.
The accounts are not as sparkling as they once were. The aforementioned cost cutting recently improved the ‘core’ operating margin to 21%, but cash flow has been variable while my last return on equity calculation arrived at a modest 14%.
I first bought SYS1 at 325p during 2016 and was attracted by the company’s history of organic expansion, its evangelical leader/26% shareholder and the very straightforward, cash-rich accounts.
I then tripled my investment at 238p during 2018 — just before the AdRatings costs zoomed higher.
The shares fell 5% last year, but might recover this year should an ITV Euro 2020 competition generate greater client interest.
Similar to MCON, SYS1’s attempts to dig a wider ‘moat’ (through AdRatings) may have to bear fruit before I invest again.
My SYS1 buy report | All my SYS1 posts
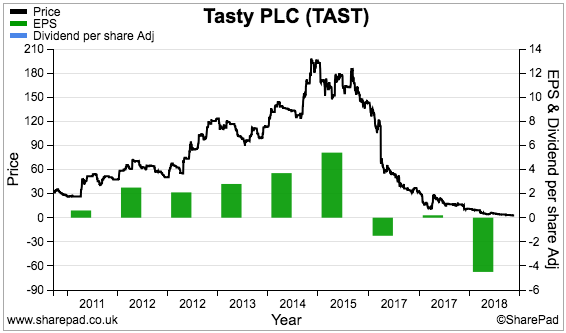
12) Tasty (TAST), price: 2.7p, market cap: £4m
Another year, another share-price disaster.
During 2019, TAST shares crashed 74% — following dives of 55%, 56% and 23% for 2018, 2017 and 2016 respectively.
The investment performance has been so awful, strangers at AGMs now approach me and mention it.
How will this hapless restaurant chain fair in 2020?
September’s woeful half-year results had indicated the group’s future was somewhat in the balance. Bumper party bookings before Christmas were essential to boost sales, stem losses, generate cash and keep a lid on debt.
Prior to that, March’s full-year statement had signalled trading starting to stabilise. The announcement also flagged an emergency fund raising, which duly arrived in April and collected £3m at 4p a share. The shares had started the year at 10.5p.
Famous last words, but TAST’s fortunes may now have turned. A £2m property disposal (versus a market cap of £4m!) and confirmation of in-line Christmas trading mean debt is no longer an immediate issue and have allowed more time for a recovery.
Whether TAST can sustain a profit during 2020 — let alone revisit the 10% operating margins of yesteryear — remains to be seen. Similar to many other restaurant operators, TAST’s financials have been blighted by rampant discounting, higher wages, onerous leases and bold debt levels.
I first bought TAST at 50p in 2011 and again at 98p in 2014. I sold 15% of my holding during 2016 at 179p — and still regret not selling the rest.
Instead, I quadrupled my holding at 45p during 2017 and then increased my holding by a further 85% at 15p during 2018.
In retrospect, I placed too much faith in the Kaye family and its connected parties — which own 36% of the business and have already built and sold multi-bagger restaurant chains ASK Central for £223m (in 2004) and Prezzo for £304m (in 2015).
I should have instead faced up to the deteriorating financials at both TAST and the restaurant sector in general.
Anyway, let’s see if TAST’s turnaround plan can deliver in 2020 after that £2m property disposal shored up the balance sheet.
My TAST buy report | All my TAST posts
Sold shares
I sold three shares during 2019 — and I lost money on each one. They became the fifth, sixth and seventh investments I have exited completely at a loss since 2004.
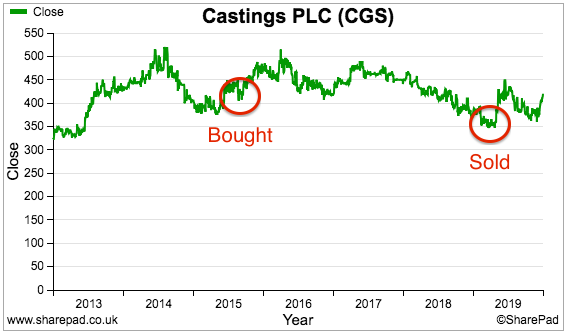
SOLD) Castings (CGS)
I sold my entire CGS holding during April at 343p including all costs. This time last year I mentioned a desire to shift to higher-conviction positions, and the engineer was simply a casualty of wanting fewer shares.
True, CGS offered a long dividend history, an LTIP-free board plus cash-flush accounts. But so did other shares in my portfolio and, unlike CGS, those alternatives boasted long-haul family managers, too.
I bought CGS during 2015 at 426p and events did not turn out the way I expected.
In particular, problems in the machining division saw a £4m-plus subsidiary profit turn into a £4m loss by 2018 . At least the main foundry division lifted its profit from £13m to £16m during my ownership.
I was not sure about CGS changing its depreciation policy. The group decided to extend the useful life of certain machinery from 10 to 15 years — which reduced the depreciation charge for 2019 by £1m and bolstered reported profit by 7%. Fifteen years does seem a long time for foundry equipment to become obsolete.
At least I collected dividends of 76p per share during my time as a shareholder, which limited the loss to 1.6% over three-and-a-half years.
A trading statement issued after I sold revealed the engineer had (frustratingly!) enjoyed “strong demand” during the second half, and the 2019 results then (frustratingly!) declared a special dividend!
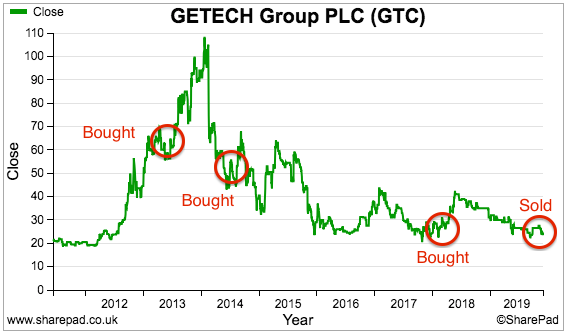
SOLD) Getech (GTC)
I sold my entire GTC holding during November at 23p including all costs.
Similar to CGS, GTC was a casualty of exiting my lower-conviction holdings. Half-year results from the geoscience software specialist re-emphasised a number of drawbacks that I could no longer tolerate.
In particular, immediate earnings continued to be dictated by “lumpy”/one-off data sales — the timing and value of which remained unpredictable.
Meanwhile, recurring revenue seemed a long way off from covering the cost base — let alone helping to generate a decent profit and fund a resumption of dividends.
Other sell factors included a high level of capitalised development costs, the less optimistic tone of the directors and the substantial dependence on a rising oil price for extra revenue.
The dependence on the oil price was in fact the killer for this investment. I first bought during 2013 when the oil price topped $100 and GTC’s margins were running beyond 20%.
However, oil dropped to $30 and GTC’s oil industry customers soon reigned in their exploration. Demand for GTC’s services then slumped and those high margins quickly evaporated. The lesson I learned was market-leading software on its own can’t defy widespread customer cutbacks.
I purchased Getech at 62p during 2013, at 59p during 2014 and at 25p during 2017. All told, I paid an average of 51p, collected dividends equivalent to 4p and sold at 23p to register a 47% loss.
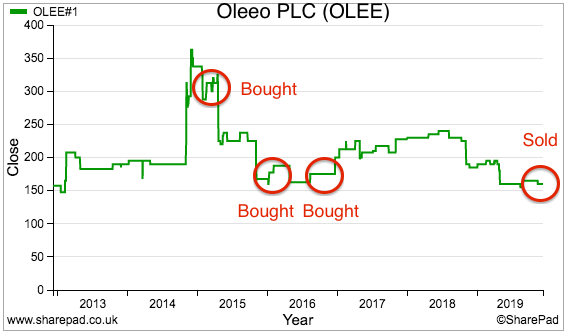
SOLD) Oleeo (OLEE)
I was pretty much a forced seller of OLEE.
The recruitment software developer accompanied its 2019 results with a bombshell tender offer and delisting proposal. Shareholders could either accept the 165p per share tender offer or remain invested in what would become a private company.
The prospect of owning shares in an unlisted £13m firm — where significant product investment had depressed earnings for the last few years without too much additional revenue in return — was not appealing. I therefore accepted the 165p offer and received the proceeds in December.
The tender price was not exactly generous, but at least a tender was provided (not all AIM shares that delist offer a cash exit). The tender also raised funds for my portfolio that will one day go towards higher-conviction holdings.
I was a tad unfortunate with OLEE. At the time of my first purchase, earnings had grown, margins were generous, the accounts were solid and the valuation was modest. Then followed the aforementioned multi-year product investment that crushed profits and the share price.
The chairman’s 72% shareholding proved to be a double-edged sword. His investment suggested owner-aligned leadership, but the resultant illiquidity of the shares prevented me from exiting earlier. The chairman’s shareholding also steamrollered the delisting through.
I purchased OLEE (then known as World Career Networks) during 2015 at 320p and during 2016 at 182p. All told, I paid an average of 260p, collected dividends equivalent to 16p and sold at 165p to register a 30% loss.
Summary
Last year I cut my portfolio from 15 shares to 12, and my remaining companies generally offer the traits outlined within How I Invest: decent accounts, capable executives, respectable track records and reasonable prospects.
I am pleased three of my less convincing investments have now gone — although owning TAST and arguably MCON may one day prompt further pruning.
The plan for 2020? I am hopeful my returns can improve by focusing more on my higher-conviction holdings. I also have a 14% cash position to employ, and my SharePad screening articles might find some suitable new investments.
All of the above means my portfolio started 2020 like this:

I trust you found this blog post informative. I certainly found it useful to write.
Please click here to examine my portfolio’s 2019 performance in more detail.
Until next time, I wish you happy and profitable investing!
Maynard Paton
PS: You can receive my blog posts through an occasional email newsletter. Click here for details.
Disclosure: Maynard owns shares in Andrews Sykes, Bioventix, City of London Investment, Daejan, Mincon, Mountview Estates, S & U, System1, Tasty, FW Thorpe, Tristel and M Winkworth.

Thanks Maynard for sharing, great review as usual and good luck in 2020.
Just for info most of my money these days is in managed funds and I returned 14% last year. I also invest in scotch whiskey which returned 8%. This one is very stable and only goes up over time and if all goes pear shaped you can revert to drinking it!
My other investment lump is my DC Pension where I choose funds and this returned a whopping 18%
I dabbled in Gold and lost 10% which in hindsight was a mistake as it’s now back up again.
I remain convinced that share investing is good for the long term as long as you can hold your nerve and ride through the choppy times.
Best regards
David
Hi David
Thanks for the comment. Given the performance of some funds/indices over time, I do wonder if the stock-picking is worth the effort. It has been in the past, though, and I do like studying different companies. Well done on your returns and good luck for 2020. Whiskey investing sounds great!
regards
Maynard
Wishing you all the best for 2020 and hope your next January report shows some spectacular returns!
Thanks for your writings as always!
Nick
Thanks Nick. If I repeat last year’s return, I will be happy!
Maynard
All the best for 2020 Maynard – the blog is a great read.
You make a good point here. You can spend a lot of time worrying about your relative returns, but in the end if you can do 13% (really 10% or above) on a consistent basis, you’re going to do just fine in life.
Thanks,
Phil
Thanks Phil
TSTL looks impressive. One for the watchlist. Thank you for posting. Good luck in 2020!
Thanks Es
Hi Maynard,
I’m not sure if you still hold your Daejan shares but looking at the price today is this not an opportunity for a decent arbitrage. The shares are selling (at the time of this post) at just over £70 a share. Should the deal go through in the next month or two then that is a10% and above return in just 3 months. Am I missing something?
Regards
Andrew
Hi Andrew,
“Am I missing something?” — Yes, the deal might not go through at £80.50:-) In ‘normal’ times, an arbitrage opportunity would indeed exist at £70, but in ‘normal’ times the price would be £80 and the opportunity would be minimal.
Funnily enough I was re-checking the offer RNS small print this morning and, while the text does not explicitly say “DJAN reserves the right to withdraw/adjust the offer“, there’s enough small-print in there to leave some wriggle room.
Part 3(e)(i) might be important:
“since 31 March 2019, except as Disclosed (in each case to an extent which is or could be material in the context of the wider Daejan group taken as a whole or the wider BidCo Group taken as a whole, or material in the context of the Offer):
(i) there having been no adverse change in the business, assets, financial or trading position or profits or prospects of any member of the wider Daejan Group;”
At times such as these, when previously declared/approved dividends are being withdrawn by many companies, I suppose anything is possible. Whether the Freshwaters would want to screw ordinary shareholders over with a lower offer — I am not sure. They could have done so with the initial offer. They are keen to quit the stock market, though, and adjusting the offer now would cause more fuss. A two-week delay in preparing the scheme document is not helpful.
Maynard