26 July 2019
By Maynard Paton
Results summary for City of London Investment (CLIG):
- These 2019 summary figures contained no surprises, as lower funds under management (FUM) throughout the year left revenue down 6% and profit down 16%.
- FUM ironically ended the year at its highest-ever level in GBP terms (£4.2b), as client money once again trickled out of the main emerging-market funds and in to other strategies.
- The overall fee rate paid by clients slid from 80 basis points to 76 basis points.
- The accounts continue to sport high margins, a robust return on equity, decent cash flow and net cash.
- The P/E is approximately 10 and the yield tops 6%, although the shares have traded on a similar rating for years. I continue to hold.
Contents
- Event link and share data
- Why I own CLIG
- Results summary
- Revenue, profit and dividend
- Funds under management
- FUM fee rates
- Income statement, balance sheet and cash flow
- Valuation
Event link and share data
Event: Summary results for the twelve months to 30 June 2019 published 16 July 2019
Price: 430p
Shares in issue: 26,560,707
Market capitalisation: £114m
Why I own CLIG
- Emerging-market fund manager that employs a lower-risk ‘value’ strategy of buying investment trusts, and which does not require ‘superstar’ stock-pickers.
- Management offers regular/transparent reporting and distributes the majority of company earnings as dividends.
- A P/E of 10 and yield of 6%-plus offer upside potential should significant new clients ever bolster funds under management.

Further reading: My CLIG Buy report |All my CLIG posts | CLIG website
Results summary
Revenue, profit and dividend
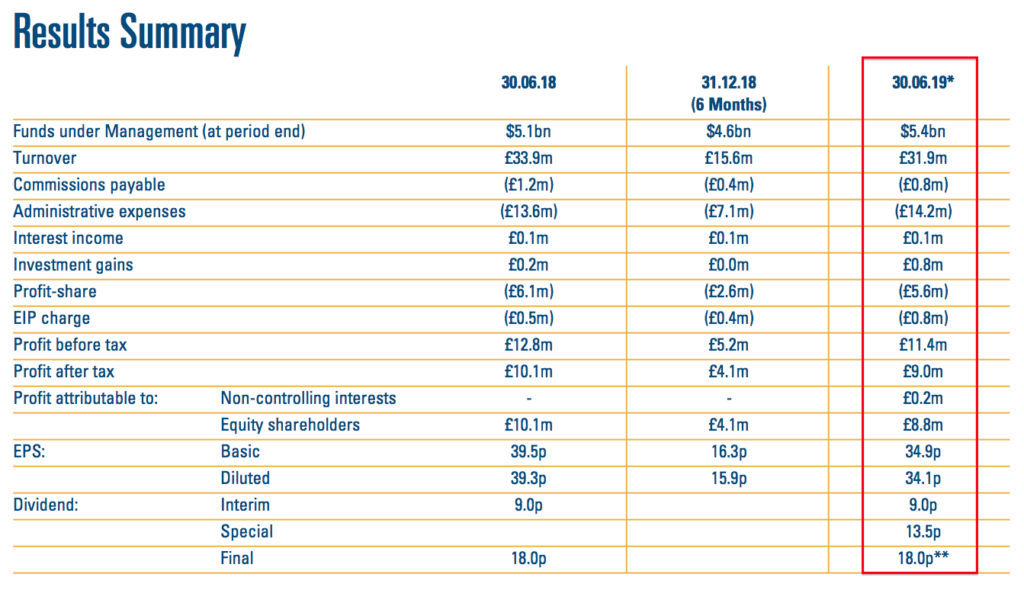
- CLIG commendably published these summary 2019 results just 12 working days following the year end.
- A lower first-half profit, a mixed Q3 statement plus monthly website updates meant the figures contained no surprises.
- Revenue fell 6% to £31.9m while operating profit dived 16% to £10.5m.
- Funds under management (FUM) actually ended the year 6% higher at $5.4b.
- However, FUM on a monthly average basis fell 3% to $5.1b. FUM dropped 9% during the first half then rebounded 17% during the second.
- Lower fee rates on FUM and greater staff costs also affected the figures (more on those later).
- The overall performance broadly matched that of 2017:
| Year to 30 June | 2015 | 2016 | 2017 | 2018 | 2019 |
| Funds under management ($m) | 4,211 | 4,005 | 4,661 | 5,107 | 5,389 |
| Revenue (£k) | 25,356 | 24,413 | 31,294 | 33,931 | 31,933 |
| Operating profit (£k) | 8,727 | 7,757 | 11,508 | 12,528 | 10,503 |
| Finance income (£k) | 205 | 212 | 82 | 264 | 894 |
| Other items (£k) | - | - | - | - | - |
| Pre-tax profit (£k) | 8,932 | 7,969 | 11,590 | 12,792 | 11,397 |
| Earnings per share (p) | 26.4 | 23.6 | 36.9 | 39.5 | 34.9 |
| Dividend per share (p) | 24.0 | 24.0 | 25.0 | 27.0 | 27.0 |
| Special dividend per share (p) | - | - | - | - | 13.5 |
- CLIG continues to benefit from the Brexit-weakened GBP.
- CLIG’s revenue is collected almost entirely in USD but approximately 40% of costs are expensed in GBP — hence the much improved performances after 2016.
- The dividend was held at 27p per share. A special 13.5p per share payout was declared at the half year.
Funds under management
- FUM ended the year at its highest-ever level in GBP terms:
- In USD, CLIG’s FUM high occurred during early 2011 when total client money surpassed $6b.
- CLIG’s FUM can be divided into two main categories: i) Emerging Markets (EM), and; ii) non-Emerging Market (non-EM), which covers ‘frontier’ markets, developed markets and other themes.
- Both categories apply CLIG’s long-standing ‘value’ approach of buying investment trusts at a discount.
- Non-EM FUM has become a larger part of overall FUM during recent years:
| FUM | 2015 | 2016 | 2017 | 2018 | 2019 |
| EM ($m) | 3,855 | 3,659 | 4,202 | 4,207 | 4,221 |
| Non-EM ($m) | 359 | 346 | 461 | 900 | 1,168 |
| Total ($m) | 4,214 | 4,005 | 4,663 | 5,107 | 5,389 |
| EM (%) | 91.5 | 91.4 | 90.1 | 82.4 | 78.4 |
| Non-EM (%) | 8.5 | 8.6 | 9.9 | 17.6 | 21.6 |
- Non-EM funds have often attracted additional client contributions, unlike the EM funds, which have suffered net withdrawals since 2017:
| Client flows | 2015 | 2016 | 2017 | 2018 | 2019 |
| EM ($m) | 23 | 150 | (295) | (215) | (184) |
| Non-EM ($m) | 242 | (12) | 23 | 400 | 280 |
| Total ($m) | 265 | 138 | (272) | 185 | 96 |
- During 2019, client money generally trickled out of EM funds and trickled in to non-EM funds:
| Client flows | Q1 2019 | Q2 2019 | Q3 2019 | Q4 2019 | FY 2019 |
| EM ($m) | (95) | (62) | 45 | (72) | (184) |
| Non-EM ($m) | 103 | 12 | 108 | 57 | 280 |
| Total ($m) | 8 | (50) | 153 | (15) | 96 |
- An irony of the growing exposure to non-EM FUM is that EM delivered a greater investment return last year than non-EM:
| Market movements | Q1 2019 | Q2 2019 | Q3 2019 | Q4 2019 | FY 2019 |
| EM ($m) | (96) | (222) | 403 | 113 | 198 |
| Non-EM ($m) | (11) | (113) | 89 | 23 | (12) |
| Total ($m) | (107) | (335) | 492 | 136 | 186 |
- CLIG said the EM strategy out-performed because “discounts narrowed and country allocation was positive”.
- CLIG said the non-EM strategies under-performed due to “a combination of negative NAV and country allocation effects”.

- I estimate total FUM enjoyed a 3.6% gain excluding additional client contributions during 2019. My estimate for 2018 was 5.6%.
- This next table sums up the additional client contributions and general market movements experienced during 2019:
| Movement total | Start FUM | Q1 2019 | Q2 2019 | Q3 2019 | Q4 2019 | End FUM |
| EM ($m) | 4,207 | (191) | (284) | 448 | 41 | 4,221 |
| Non-EM ($m) | 900 | 92 | (101) | 197 | 80 | 1,168 |
| Total ($m) | 5,107 | (99) | (385) | 645 | 121 | 5,389 |
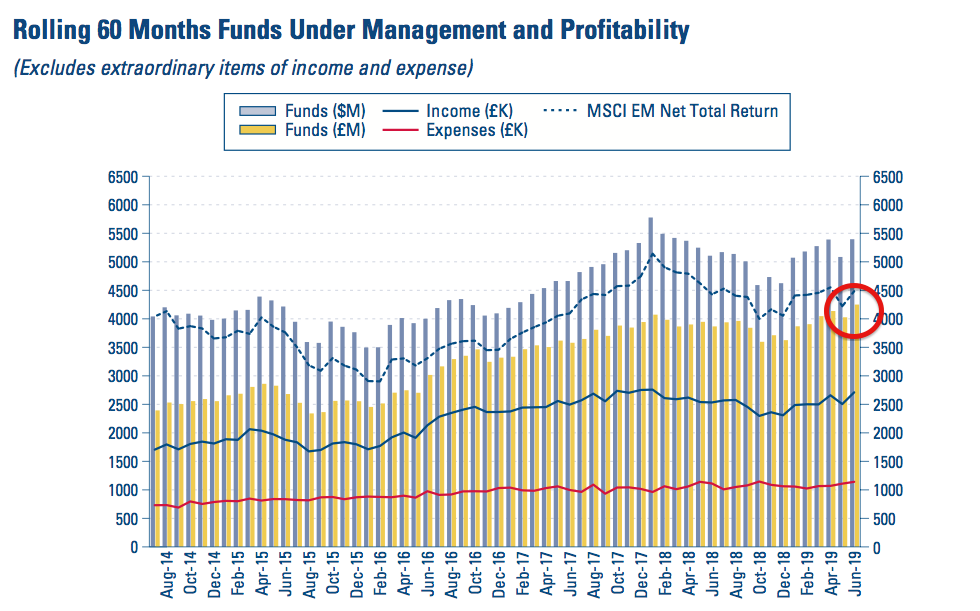
- The chart below from CLIG’s 2018 annual report (point 3) shows market movements (the brown boxes) outweighing the movements from client contributions and withdrawals (the yellow boxes):
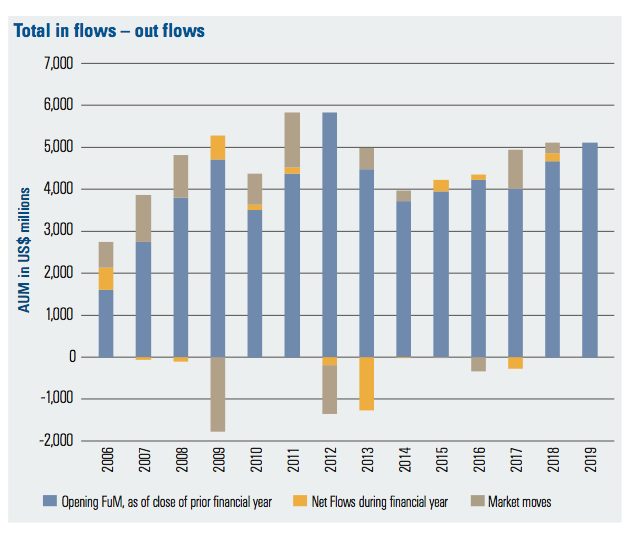
- Additional FUM through market movements and client contributions are typically (and frustratingly!) small compared to the overall level of FUM.
Enjoy my blog posts through an occasional email newsletter. Click here for details.
FUM fee rates
- CLIG’s greater dependence on non-EM FUM may explain the group’s lower fee rate.
- Back in 2015, CLIG charged clients 85 basis points (i.e. 0.85%) on its overall FUM.
- Between 2017 and 2018, the rate slid from 84 to 80 basis points.
- Then between 2018 and 2019, the rate slid further to 76 basis points (first disclosed during Q3).
- My basic algebra suggests EM fees are levied at 90 basis points and non-EM fees are levied at 30 basis points to arrive somewhere close to the overall fee rates CLIG has declared:
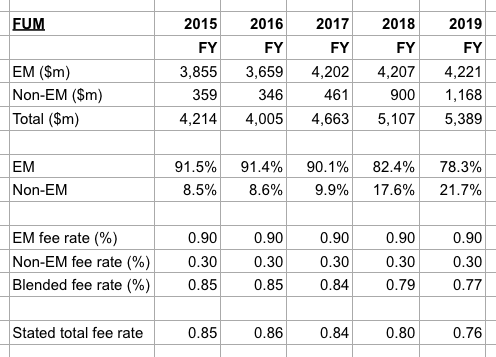
- If my fee-rate algebra is accurate, the advance of non-EM FUM is not surprising given the associated fees are so much lower.
- I do wonder if non-EM FUM has been bolstered partly by EM clients switching to non-EM. The total number of clients has increased from 161 to only 169 during the last five years.
- CLIG claims its representative EM fund has out-performed its benchmark during the last 18 months following two years of prior under-performance:
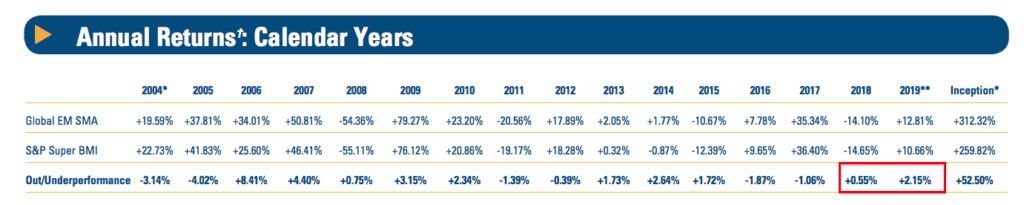
- During the last three and a half years, both CLIG’s representative EM fund and its associated benchmark have gained 41%.
- During the last five and a half years, CLIG’s representative EM fund has gained 29% while the associated benchmark has gained 23%.
- CLIG claims its representative EM fund (red circles below) has enjoyed consistent first- or second-quartile performances during the last 15 years:
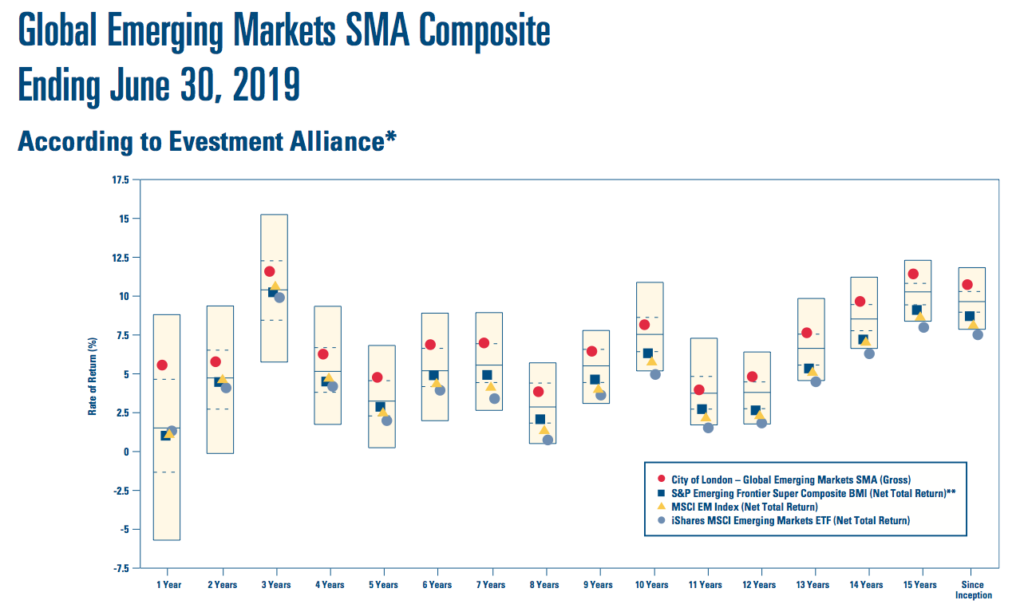
- Given the appealing relative performances, I question why the EM division has suffered net client withdrawals during the last three years.
- One reason could be that only three people were employed within the business development and marketing department during 2018:
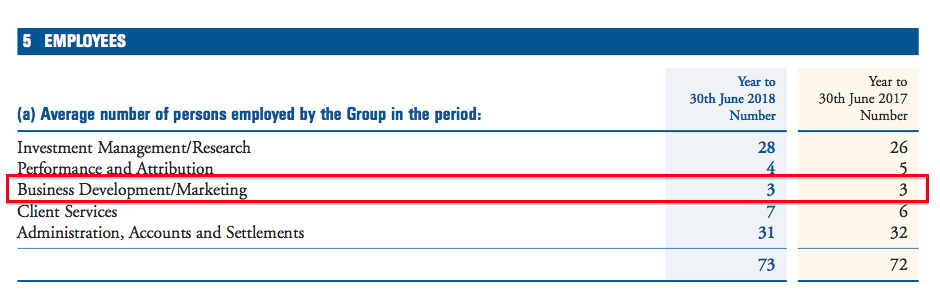
- A few extra employees tasked to find new clients could easily pay for themselves if/when the extra FUM (and fees) roll in.
- The (re-)appointment of a senior business-development manager (point 4) might help stir up some new business.
Dividend-cover template and FUM/exchange-rate table
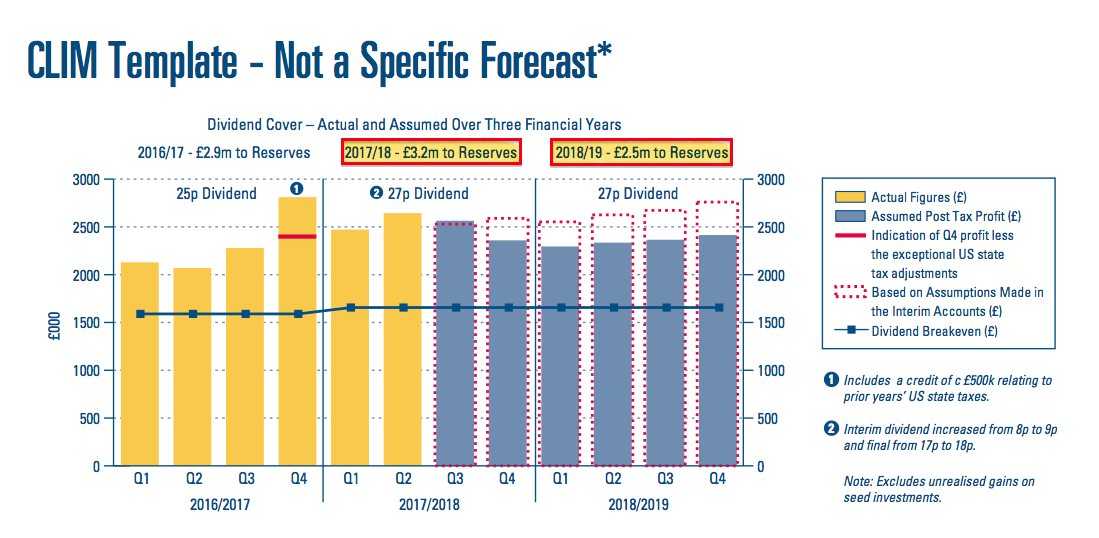
- An updated dividend-cover template accompanied these summary full-year results:
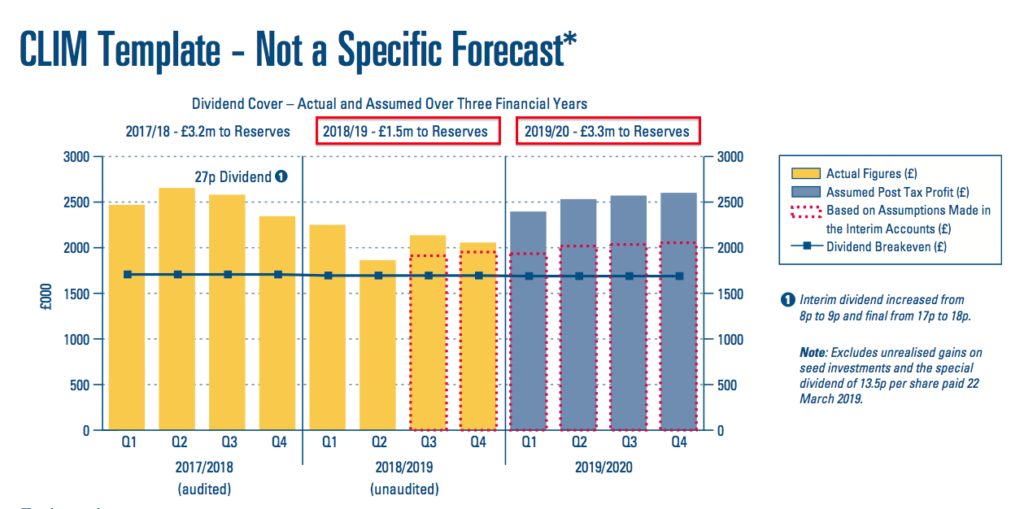
- Market ups and downs can leave left the template looking rather optimistic or pessimistic at times.
- The template does nonetheless reveal what CLIG believes could happen during the coming twelve months.
- The template expects earnings of £3.3m to be retained during the current year.
- £3.3m is equivalent to approximately 13p per share which, when added to a maintained 27p per share dividend, indicates current-year earnings might be 40p per share.
- The red dotted lines within the template show the projections at the half year, since when FUM has rebounded 17%.
- A year ago the template looked like this:
- The template back then expected CLIG to retain earnings of £2.5m during 2019.
- In actual fact, CLIG retained £1.5m. In other words, the template misjudged total earnings by £1m or 10%.

- The “key assumptions” used to construct the template expect the non-EM funds to attract a further $250m during 2020. This $250m non-EM assumption has been surpassed during the last two years.
- The same assumptions expect EM funds to attract no extra money during 2020. This zero EM assumption has been too optimistic during the last three years.
- I am pleased the “key assumptions” show overheads not increasing during the current year.
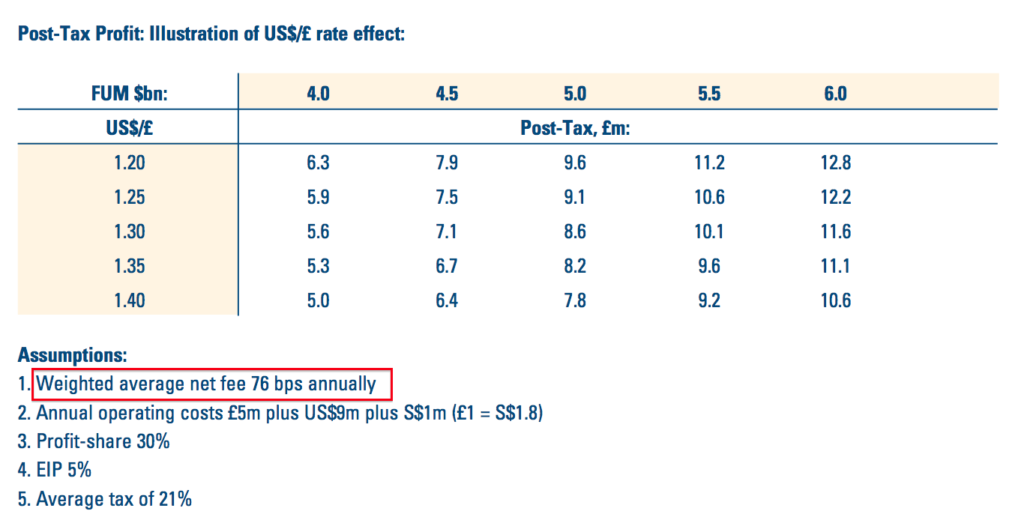
- CLIG’s updated FUM/exchange-rate table confirms the 76 basis-point fee:
- The (awful) Employee Incentive Plan (EIP) is set to pinch 5% of pre-bonus profit during the current year
- The EIP should cease this time next year.
Income statement, balance sheet and cash flow
- CLIG’s operating margin and return on equity remain high, but not as high as they have been:
| Year to 30 June | 2015 | 2016 | 2017 | 2018 | 2019 |
| Operating margin (%) | 34.4 | 31.8 | 36.8 | 36.9 | 32.9 |
| Return on average equity (%) | 47.7 | 42.7 | 58.9 | 50.9 | 43.6 |
- The margin reduction was due mainly to staff costs (identified under ‘human resources’, ‘profit-share’ and ‘EIP’ below) increasing 5% to almost £15m:
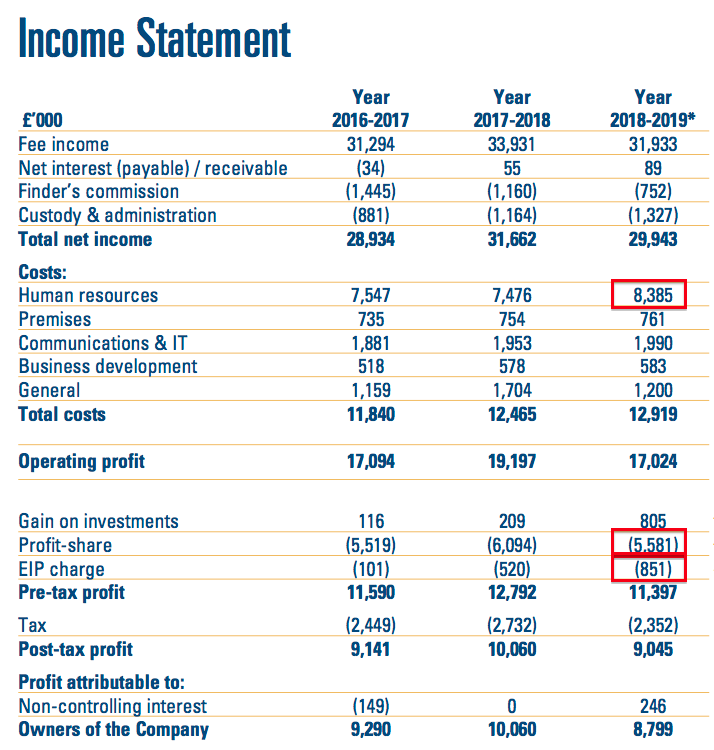
- As I have noted before, fund-management employees tend to enjoy higher total remuneration every year regardless of whether their business improves or not.
- Cash finished the year £6m lighter at almost £14m following a £10m dividend (including a £3.4m special payout), £3.6m to seed a REIT fund and £1.2m spent buying shares for cancellation:
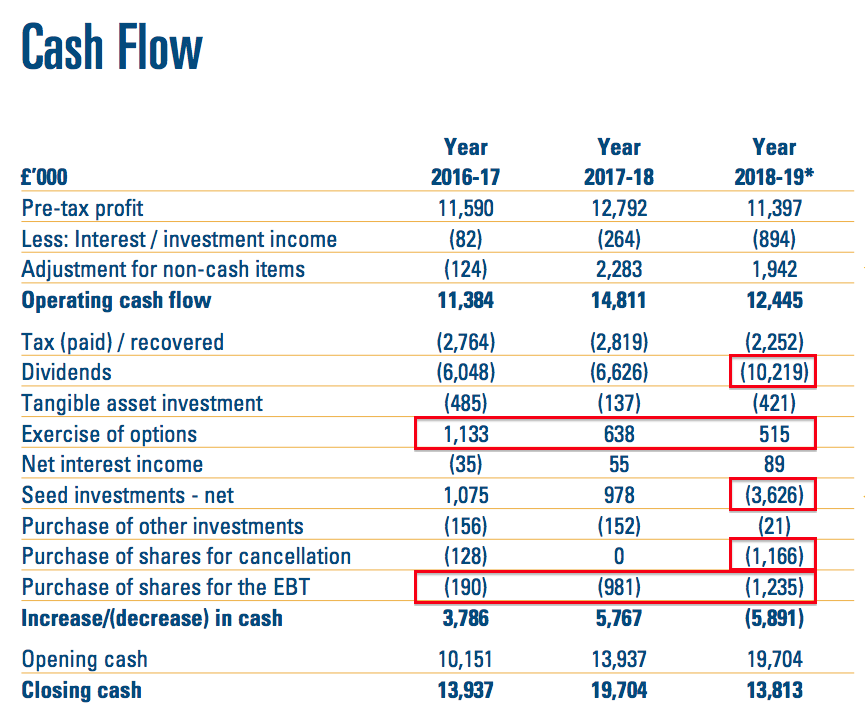
- CLIG has spent £2.4m during the last three years buying shares for the employee benefit trust (EBT). This sum has been counterbalanced by £2.3m generated by staff exercising options to acquire the shares held by the EBT.
- CLIG’s balance sheet showed investments of £7.8m, of which ‘non-controlling interests’ (i.e. third-party investors) own £3.4m. Investments actually owned by CLIG are therefore £4.4m:
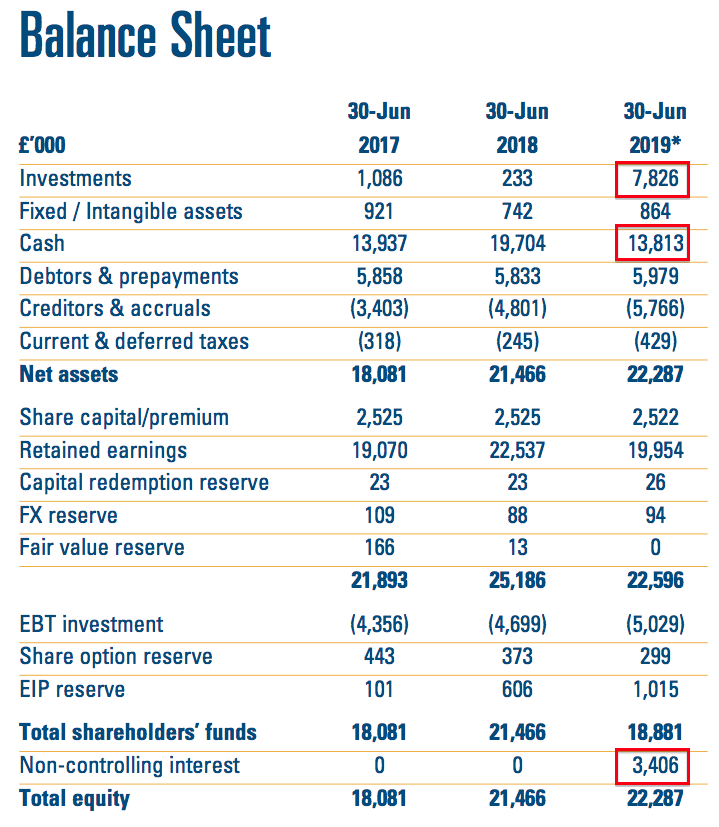
- Cash and net investments are therefore £18.2m, which less regulatory capital of £1.7m leaves £16.5m or 62p per share.
- CLIG’s books remain free of debt and pension obligations.
- I will look at the accounts in more detail when the full annual report is issued during September.
Valuation
- My valuation sums employ CLIG’s latest FUM/exchange-rate table (see above).
- I reckon FUM at $5,389m and GBP:USD at 1.25 may lead to earnings of approximately £10.3m or 38.7p per share.
- Adjusting the £114m market cap for the near-£17m of cash and net investments, my enterprise value (EV) calculation comes to approximately £98m or 368p per share.
- Dividing that EV by my earnings guess gives a possible P/E of 9.5.
- Ignoring the cash and investments gives a potential P/E of 11.
- Note that the FUM/exchange-rate table (above) applies an EIP charge of 5%, and the EIP ought to cease after 2020.
- Applying an EIP charge of 0% instead of 5% increases my earnings estimate by almost 8%.
- While the P/E does not look expensive (with or without the EIP), bear in mind:
- these shares have rarely traded at an extended rating;
- little progress has been made attracting additional FUM and clients for some years;
- client fee rates have been sliced lower over time, while costs have been rising;
- the balance sheet has regularly carried a sizeable cash position, which in reality may be needed to reassure clients and might therefore not be ‘surplus to requirements’ for valuation purposes, and;
- Founder/chief investment officer Barry Olliff retires during December and is currently reducing his near-8% shareholding. Mr Olliff last sold at 450p and wishes to sell more at 450p, 475p and 500p (point 1).
- A notable re-rating could be hard to achieve unless the group starts to win fresh clients that bring in significant FUM.
- Perhaps the retirement of Mr Olliff may spark a more dynamic approach to attracting extra customers. The new chief exec once worked in marketing (albeit a long time ago):

- CLIG likes to distribute the majority of its earnings as a dividend. Dividend cover during the last ten years has never topped 1.5 times.
- My 38.7p per share earnings guess covers the trailing 27p per share dividend 1.43 times.
- The 27p per share dividend supports a useful 6.3% income at 430p.
Maynard Paton
PS: You can receive my blog posts through an occasional email newsletter. Click here for details.
Disclosure: Maynard owns shares in City of London Investment.

Maynard as usual this article on CLIG provides an impressive quantitative analysis. For me the main problem and why Id never invest is that City of London doesn’t have a sticky customer base. Customers are fickle and this will forever cause it problems.
Hello Lorraine,
Thanks for the comment. CLIG’s presentations do show a slide indicating ‘customer tenure’, and 52 clients (out of 169) have been around for 10 years or more. Ironically, CLIG’s management once told me that part of the challenge to recruit new clients was to combat client inertia — apparently they tend to keep to their favoured funds unless the performance is absolutely awful. But yes, some investors are fickle and chop and change and unless CLIG’s fund performances are consistently good, the group will experience regular client churn.
Maynard
Yes 52 out of 169 is pretty poor – it’s not even a third. I wouldn’t say this paints a full picture either as where is the new money going, even amongst the 52 who have retained some business with them. Investors chop and change markets go up and down, Fund managers exceed and disappointment. They are understandably more expensive but the platforms are better investments.
Well, 52 out of 169 over ten years is around an 89% annual retention rate! Which is very good by the standards of most businesses, although asset management in general is a very high retention rate industry (consistent with what CLIG said to Maynard).
I don’t own any CLIG shares – although I’ve looked pretty closely at the company in the past – but I don’t think the retention rate would put me off, if anything it seems to me that retention is one of the strongest aspects of the investment case.
City of London Investment (CLIG)
Funds under management update
FUM during July decreased by $58m to $5,338m —- although in GBP terms FUM has reached another new all-time high (c£4,375m) due to recent FX fluctuations:
Using the exchange-rate/FUM table shown in the Blog post above, I arrive at earnings of £10.4m or 39.3p per share with client money at $5,338m and £1 buying $1.22.
Maynard
City of London Investment (CLIG)
Funds under management update
FUM during August decreased by $173m to $5,165m:
Using the exchange-rate/FUM table shown in the Blog post above, I arrive at earnings of £9.8m or 36.8p per share with client money at $5,165m and £1 buying $1.23.
Maynard
City of London Investment (CLIG)
Quarterly funds under management update Q1 published 09 October 2019
Here is the full text:
————————————————————————————————————————————
City of London (LSE: CLIG), a leading specialist asset management group offering a range of institutional products investing in closed-end funds, announces that as at 30th September 2019, FuM were US$5.3 billion (£4.3 billion). This compares with US$5.4 billion (£4.3 billion) at the Company’s year-end on 30th June 2019. A breakdown by strategy follows:
IM Performance
IM performance was ahead of the benchmark over the quarter. Specifically, in the Emerging Market strategy NAV performances were positive and discounts narrowed marginally. In the Developed strategy relative returns were impacted by weak NAV performance from European and UK securities. In the Frontier strategy performance was negative due to exposure to Argentina.
There were continued flows into the Developed and Opportunistic Value strategies totalling $152 million, while flows were negative in the Emerging strategy and neutral in the Frontier strategy.
Operations
The Group’s income currently accrues at a weighted average rate of approximately 75 basis points of FuM, net of third party commissions. “Fixed” costs are c. £1.1 million per month, and accordingly the current run-rate for operating profit, before profit-share of 30% and an estimated EIP charge of 5%, is approximately £1.6 million per month based upon current FuM and a US$/£ exchange rate of US$1.23 to £1 as at 30th September 2019.
The Group estimates that the post-tax profit for the first three months of the year will be approximately £2.4 million (2018: £2.2 million).
Dividends
The final dividend of 18 pence per share, subject to approval at the AGM on 21st October 2019, will be paid on the 29th October 2019, bringing the total dividend for the financial year 2018-19 to 40.5 pence, including the special dividend of 13.5 pence paid in March (2017-18: 27 pence, special dividend : nil).
Board Change
City of London Investment Group is pleased to announce that Mr. Carlos M Yuste will be joining the Board as an Executive Director as of 1st January 2020. Carlos is the Head of Business Development. He served on the Board as the Business Development Director from CLIG’s initial listing in 2006 through 2015.
————————————————————————————————————————————
The FUM numbers were not spectacular.
New client money of $140m during Q1 meant market movements subtracted $191m — equivalent to 3.5% of FUM at the end of Q4. A 3.5% loss does not look out of line with the highlighted benchmarks.
The $12m outflow for Emerging Market (EM) funds was the sixth quarterly outflow client money from that division in the last seven quarters. A wobbly market presumably does not help attract new contributions.
A net $101m has left CLIG’s EM funds during the last twelve months.
Non-EM funds added $152m during Q1 to make $240m added during the last twelve months.
I will be happy if non-EM funds can attract a further $240m during the next twelve months — that amount would bolster the $1,280m non-EM funds by 19%.
Non-EM funds now represent 24.0% of total FUM, versus 21.7% for Q4 and 19.8% this time last year.
The rising proportion of non-EM funds to EM during the last twelve months has been due to EM funds staying at just over $4.0b while non-EM has gained 29% ($288m).
I am hopeful inflows to non-EM funds can continue to contain EM outflows.
I am disappointed — but not that surprised — by this line:
“The Group’s income currently accrues at a weighted average rate of approximately 75 basis points of FuM”
Oh dear. CLIG’s fee rate has been chipped lower again. The blog post above noted the rate was 76 basis points. This time last year the rate was 77 basis points. The year before that was 84 basis points.
I am convinced the lower rate is due to lower fees on the non-EM funds.
My basic algebra suggests EM fees are levied at 90 basis points and non-EM fees are levied at 30 basis points to arrive somewhere close to the overall fee rates CLIG has declared:
I still need to investigate further on this matter — especially if non-EM FUM is meant support CLIG’s growth ambitions.
I note the promotion of the Head of Business Development to the board. In my view, CLIG has lacked adequate sales and marketing for years given the low levels of extra client money obtained. I hope the promotion can improve matters in this area.
Maynard
City of London Investment (CLIG)
Board Changes published 31 December 2019
Confirmation that CLIG founder Barry Olliff has become a non-exec. His impending retirement from executive duties was signalled at least three years in advance. Here is the full text:
————————————————————————————————————————————
As previously announced, Barry M. Olliff, Founder and Director, has retired from his executive role effective 31 December 2019, having retired from the Board of City of London Investment Management Company Limited on 1 December 2019.
The Board re-confirms that Barry has agreed to serve as an advisor to the executive team for the next two years. In addition, the Board has now asked him to complete his current term as a Non-Executive, non-independent Director on the Group Board through October 2020, in order to advise on the continued development of the business, and the Directors are pleased to announce his acceptance.
Tracy Rodrigues, Finance Director, has requested a leave of absence for family reasons and will step down from the Group Board on 31 March 2020. The Finance team is well established and will cover her duties during her absence and will report directly to Tom Griffith, CEO of the Group.
As previously announced, Carlos Yuste, Head of Business Development, will join the Group Board on 1 January 2020.
————————————————————————————————————————————
Maynard
City of London Investment (CLIG)
Funds under management update
FUM during October, November and December increased by a significant $676m, or 13%, to $6,022m:
FUM has only ever surpassed $6,000m once before — March 2011.
Using the exchange-rate/FUM table shown in the blog post above, but applying a fee rate of 75 basis points as per this comment, I arrive at earnings of £11.32m or 42.6p per share with client money at $6,022m and £1 buying $1.31.
Maynard
City of London Investment (CLIG)
Publication of 2019 annual report
The annual report was published during September 2019. I have only now got round to reading the small print.
Here are the points of interest:
1) Management commentary:
The annual report did not contain any extra commentary beyond what was stated in the results RNS.
2) Employee and director pay
Fair enough, CLIG compares director pay to staff pay. But excluding the (sizeable) ‘other benefits’ from the calculations might distort any conclusion made from the accompanying table:
The execs were actually paid a total of £2,776k (vs £2,494k in the table). The non-execs were paid a total of £207k.
In total, staff and directors were actually paid £14,790k:
So the staff (excluding directors) were paid £14,790k less £2,776k less £207k = £11,807k. The earlier table says the staff (excluding directors) were paid £8,987k before ‘other benefits’.
The table says the staff were paid an average of £130k each, up 5%, and the average exec director was paid £624k, down 15%.
The accounting notes in fact indicate the average cost of an employee (staff and directors) was £203k, up 5%. Average wage was up 12% to £90k.
This table says the average staff wage in fact advanced 10%:
For perspective, the average employee cost has increased from £158k to £203k between 2012 and 2019. Meanwhile, gross fee income has declined from £34m to £32m, leaving gross fee income per employee at c£440k.
Arguably CLIG has not progressed that much during the last seven years, at least judging by the top line. Staff, however, have seen their pay and other benefits increase 28% and now take 46% of gross fee income (versus 36% for 2012).
Perhaps the extra employee costs are needed because each person (on average) looks after more funds under management (FUM). FUM per employee is now $74m versus $70m for 2018 and $58m for 2012.
All told, CLIG’s employees are costing shareholders more money and their productivity improvements (at least from fee income) are not obvious.
The director payments are shown below:
The chunky profit-share payments are based on a pre-defined slice of operating profit:
The outgoing Barry Olliff had collected 4.2% of operating profit during the previous five years, but last year collected ‘only’ 3.7%.
Not everyone is happy with the pay arrangements. A 16% protest vote was registered at the 2018 AGM:
In response, a bonus cap of ‘just’ 250% of salaries is to be employed:
The main executives also asked for their salary increases to be delayed:
The directors appraise themselves:
3) Client market value
Totals 169 clients. Same number shown at the preceding half-year (7 clients won, 7 clients lost during H2) and 1 less than for full-year 2018.
4) Largest clients
Top 10 clients represent 47% of FUM:
Previous proportions have been 48%, 47%, 50% and 48% for 2015, 2016, 2017 and 2018 respectively.
9 of the 10 listed clients for 2019 appeared within the 2018 list. Average value change of those 9 was just +1%, with variations ranging from -18% to +36%.
The 01-Dec-2010 client did not appear within the 2018 list, but was in the 2016 list. Client value up 61% during the intervening years.
5) Client inflows and outflows
This chart is always the most embarrassing for CLIG:
The yellow boxes are important. They represent client money coming in/going out — and they are generally tiny compared to existing FUM. Company does not seem able to attract meaningful new client money, although once attracted, client money tends to remain invested.
6) KPIs
Confirmation of the replacement KPIs:
Note the KPIs relate to the share price — so the target of 10% CAGR for five years will come on top of dividends received.
I am not sure how CLIG will judge the second KPI if the M1EF benchmark returns a negative value during the five-year assessment period.
7) Fee rate
Confirmation of the overall fee rate being chipped away as lower-cost non-Emerging Market (EM) funds grow in size:
I remain unsure as to whether my algebra — which suggests EM funds attract 90 basis point fees and non-EM funds attract 30 basis point fees — is accurate.
8) Fund performance
The performance of a benchmark CLIG fund is represented by the red circles:
Given this benchmark fund has regularly outperformed three index alternatives, I can never quite understand why inflows of new client money are so modest.
9) Staff employment longevity
Not often you see this chart in an annual report:
40% of employees have worked for CLIG for more than 10 years.
10) Risk management
No change from 2018. Key risk is loss of FUM:
11) Nomination committee
The board expects the new chief executive to maintain his predecessor’s “culture”:
12) Audit committee
Detailed and welcome insights into audit meetings:
Useful lives of certain equipment now 4-10 years (previously 4 years)
13) Audit report
Materiality of £569k equivalent to 5% of pre-tax profit (the general standard for quoted companies):
Audit Committee reporting at £10k is pleasingly low.
100% full-scope audit, too.
14) New accounting standards
a) IFRS 9
No material impact:
b) IFRS 15
No material impact:
c) IFRS 16:
Impact seems small, but I am not quite sure how the sums work.
Accounting small print suggests IFRS 16 will create an asset and a corresponding liability of £2.3m:
However, the present lease accounting indicates a £1.1m lease obligation:
Brownie points for anyone who works out what I have missed.
15) Interest receivable
Finance income is mostly gains from investments:
However, I can’t reconcile the £800k-plus investment gain within the P&L to the gains/losses elsewhere in the accounting notes (£572k and (£32k)):
More brownie points for anyone who works out what I have missed.
I note within that last table that CLIG’s current listed investments have lost more than half of their cost value.
16) Property and equipment
Despite the depreciation/useful-life policy change (point 11), the difference between capital expenditure and depreciation was only £217k and not material for valuation purposes:
17) Trade and other receivables
An interesting note:
Trade receivables represent revenue earned during the year but where invoice has yet to be paid. Accrued income represents revenue earned during the year but where the invoice has yet to be sent.
Often within businesses handling large and long contracts, hefty accrued-income balances could mean suspect accounting, as the company ‘guesses’ the contract revenue earned as the invoice has yet to be sent — let alone paid.
I doubt that is the case with CLIG. Over the last 5 years, working-capital cash movements have been positive — suggesting the revenue recognised was backed up by cash.
Trade receivables and accrued income represented 16% of revenue at the year end, in line with the 15% to 18% seen during the previous four years.
18) Trade and other payables
Another interesting note:
Trade payables represent payments owed by CLIG to suppliers. Accruals and deferred income represent i) P&L expenses incurred by CLIG but yet to be paid for, and ii) upfront customer payments for services yet to be delivered by CLIG.
I suspect the £5.5m entry represents mostly staff payments/bonuses, where the cost has been expensed in the P&L but not yet paid as cash.
The report included this new graphic:
Bonuses are paid throughout the year, with the largest (Q4) bonus paid in July — i.e. after the June year end.
19) Options and Employee Incentive Plan (EIP)
630,750 options represent 2.4% of the year-end share count:
The Employee Benefit Trust already holds 630,750 shares to cover those options and a further 901,798 shares to cover awards relating to the EIP:
During the last 3 years, CLIG has recorded a £1.5m P&L charge for the EIP and options. Actual cash to purchase EBT shares has been £2.4m, with the EBT receiving £2.3m from employees to exercise their options. So the actual net cash cost to CLIG (and therefore shareholders) of the EIP and past options has not been that bad of late.
This table suggests the EIP will incur a further £636k charge to the P&L, to take the entire EIP accounting cost to £2m:
Small print elsewhere confirms the cost of the EIP will fall into the existing bonus pool from July 2020:
The taxation note indicates CLIG enjoys a tax benefit from share options:
This tax-benefit entry is unusual. I must admit to not understanding how the benefit arises or is calculated.
More brownie points for anyone who can tell me.
Maynard
City of London Investment (CLIG)
Quarterly funds under management update Q2 and Presentation published 14 January 2020
Here is the full text interspersed with my comments:
————————————————————————————————————————————
City of London (LSE: CLIG), a leading specialist asset management group offering a range of institutional products investing in closed-end funds, announces that as at 31 December 2019, FuM were US$6 billion (£4.5 billion). This compares with US$5.4 billion (£4.3 billion) at the Company’s year-end on 30 June 2019. A breakdown by strategy follows:
The EM and International Developed strategies outperformed, driven by narrower discounts, positive country allocation and good NAV performance. The Opportunistic Value Strategy outperformed led by good NAV performance and significant discount narrowing. The Frontier strategy underperformed due primarily to negative country allocation and discount widening.
During the period under review, the Developed strategies recorded net inflows of $272 million. The EM strategies saw net outflows of $118 million. We have to date received notification of circa $200 million of net inflows in aggregate across all strategies, which we expect to fund over the next quarter.
With regard to business development, the Group continues to maintain an active pipeline across all of its major CEF offerings with an increased interest in the diversification CEF strategies.
————————————————————————————————————————————
These FuM numbers were impressive and a significant improvement on October’s Q1 update. FuM has only ever surpassed $6 billion once before, during March 2011. FuM during Q2 advanced 13%.
The general trend of inflows into non-EM strategies and outflows from EM strategies continued during Q2.
I calculate Q2 witnessed $148 million of client money added to non-EM strategies and $106 million of client money leaving EM strategies. Net outflows from EM strategies have occured during 7 of the last 8 quarters.
Non-EM funds now represent 26.4% of total FuM. Non-EM funds generally attract lower management fees, so their greater size will impact revenue and profit (see Operations below).
The total Q2 FuM movement was a positive $676 million, which after the net $42 million of new client money meant market movements created the other $634 million.
The market return during Q2 was 11.9% (versus a negative 3.5% during Q1).
During the last 12 months, net inflows of client money (both EM and non-EM) have come to $320 million. Total FuM 12 months ago was $4,623 million, so 6.9% extra client money is not actually that bad.
———————————————————————————————————————————
Operations
The Group’s income currently accrues at a weighted average rate of approximately 75 basis points of FuM, net of third party commissions.
“Fixed” costs are c£1.1 million per month, and accordingly the current run-rate for operating profit, before profit-share of 30% and an EIP charge of 5%, is approximately £1.8 million per month based upon current FuM and a US$/£ exchange rate of US$1.3257 to £1 as at 31 December 2019.
The Group estimates the unaudited profit before taxation for the six months ended 31 December 2019 to be approximately £6.3 million, which compares with £5.2 million for the equivalent period to 31 December 2018.
The Company is currently in a close period which will end with the publication of results for the six months ended 31 December 2019 on 17 February 2020.
———————————————————————————————————————————
The 75 basis-points rate was disclosed during October’s Q1 update. The fee rate has been chipped lower for some years now. Back in January 2017 the rate was 85 basis points.
———————————————————————————————————————————
Dividend
In recognition of the improved results and having regard to the current dividend cover policy the Board has decided to increase the interim dividend by 1p to 10p per share, which will be paid on 20 March 2020 to shareholders registered at the close of business on 6 March 2020 (2019: 9 pence).
———————————————————————————————————————————
This dividend lift is good news. When the H1 dividend was lifted from 7p to 8p per share two years ago, the final payout was lifted by a penny (to 18p per share) as well. Could the full-year payout therefore be 10p + 19p = 29p per share?
———————————————————————————————————————————
Template
Please see the attached graph which is based on the following assumptions and includes the estimated quarterly cost of the dividend:
http://www.rns-pdf.londonstockexchange.com/rns/6507Z_1-2020-1-13.pdf
———————————————————————————————————————————
I never pay too much attention to this template because FuM bobs higher and lower and often makes the ‘retained earnings’ prediction somewhat academic.
Still, the projection for 2020/21 retained earnings of £5.2 million suggests total earnings could be £12.1 million (or 46p per share) given a 28p per share dividend would have a cash cost of close to £6.9 million.
Within the assumptions, I welcome confirmation of the Employee Incentive Plan (EIP) being absorbed into the main bonus pool from 2020/2021 (point 19).
CLIG’s new projections for 2020/2021 are not too radical — a net FuM increase of $250 million and overheads (mostly staff costs) up 3%.
Maynard
City of London Investment (CLIG)
Funds under management update
FUM during January and February decreased by a significant $707m, or 12%, to $5,315m:
FUM is back to where it was at the end of September.
Using the exchange-rate/FUM table shown in the blog post above, but applying a fee rate of 75 basis points as per this comment, I arrive at earnings of £9.43m or 35.5p per share with client money at $5,315m and £1 buying $1.29.
Maynard