18 October 2019
By Maynard Paton
Results summary for FW Thorpe (TFW):
- “Ongoing economic uncertainty” caused by Brexit led to flat sales and lower profit.
- Talk of a “healthy order book” provides hope that trading won’t deteriorate into 2020.
- Comments concerning new products imply slowing LED growth and a plucky move into non-lighting applications.
- Accounts boast enormous £57m cash hoard that could be used for acquisitions — or (fingers crossed) further special dividends.
- Underlying P/E of 19 seems optimistic given recent progress. I continue to hold.
Contents
- Event link and share data
- Why I own TFW
- Results summary
- Revenue, profit and dividend
- Divisions
- Financials
- Product development
- Valuation
Event link and share data
Event: Preliminary results for the twelve months to 30 June 2019 published 19 September 2019
Price: 280p
Shares in issue: 116,160,658
Market capitalisation: £325m
Why I own TFW
- Manufactures commercial lighting systems with a long-established reputation for high product quality, leading technical innovation and top customer service.
- Board led by veteran executive and assisted by family non-execs that steward a 50%/£163m shareholding.
- Conservative accounts showcase sturdy asset-flush balance sheet, respectable margins and illustrious dividend history.
Further reading: My TFW Buy report |All my TFW posts | TFW website
Results summary
Revenue, profit and dividend
- First-half figures that showed revenue down 1% and profit down 10% had already suggested these annual results would not be spectacular.
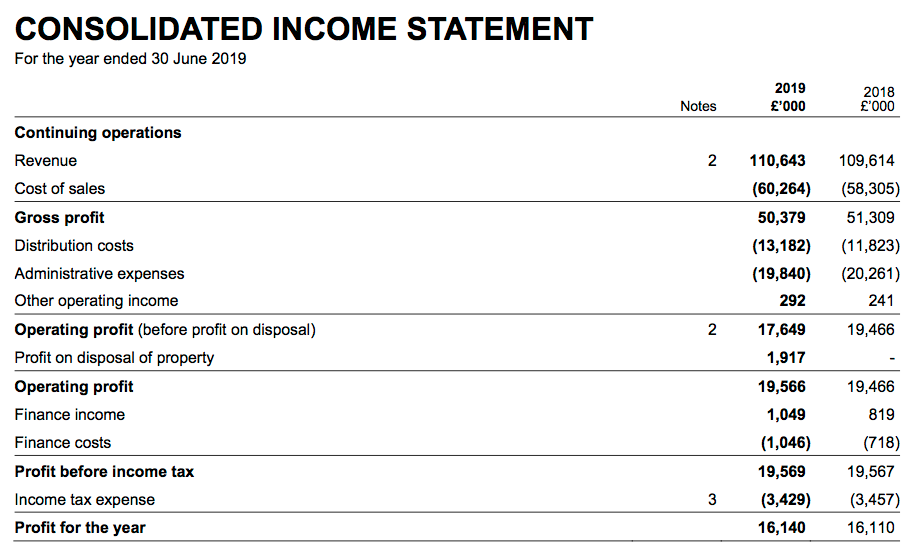
- In the event, the 2019 statement revealed full-year revenue up 1% and operating profit down 10%.
- Revenue attained a new record for the sixth consecutive year, although operating profit is now back to pre-2017 levels:
| Year to 30 June | 2015 | 2016 | 2017 | 2018 | 2019 |
| Revenue (£k) | 73,544 | 88,946 | 105,448 | 109,614 | 110,643 |
| Operating profit (£k) | 13,718 | 15,959 | 18,189 | 19,225 | 17,357 |
| Net finance income (£k) | 727 | 75 | (249) | 101 | 3 |
| Other items (£k) | (303) | 235 | 411 | 241 | 2,209 |
| Pre-tax profit (£k) | 14,142 | 16,269 | 18,351 | 19,567 | 19,569 |
| Earnings per share (p) | 9.90 | 11.24 | 12.54 | 13.91 | 13.91 |
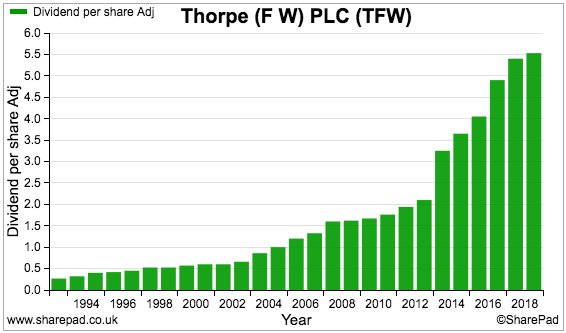
| Dividend per share (p) | 3.65 | 4.05 | 4.90 | 5.40 | 5.53 |
| Special dividend per share (p) | - | 2.0 | - | - | - |
- The performance was assisted by the first full-year contribution from Famostar, a Dutch firm purchased during December 2017.
- The results RNS did not divulge the exact Famostar contribution, but did claim the subsidiary had recorded an “excellent” performance after “increasing its own profits considerably and making a real impact on the overall figures”. (Note: TFW’s preceding interim figures did divulge Famostar’s first-half contribution.)
- The 2018 annual report said Famostar’s 2017 profit before tax was €1.3m — or perhaps approximately £1.2m before tax.
- Full-year operating profit may have dropped by 13% or more had Famostar not been acquired.
- A “significant general downturn in [UK] market conditions” — blamed on Brexit — was cited for the subdued group performance.
- A more concerning remark about the lack of growth was “customer interest in LED luminaire technology has peaked because of the smaller improvements in LED chip performance; in particular, short-payback retrofit projects are fewer.” (See Product development below.)
- At least TFW “entered the new financial year with a healthy order book”.
- The annual dividend was lifted 2% — TFW’s 17th consecutive payout increase:
Divisions
- TFW’s divisions delivered mixed performances.
- Thorlux generated 56% of revenue and 66% of operating profit for the entire group during 2019 — the lowest proportions since the division’s contributions were first disclosed ten years ago.
- Thorlux’s revenue and profit dived 4% and 15% respectively during the year. However, the second-half did witness revenue up 5% and profit fall by ‘only’ 10%:
| Thorlux | H1 2018 | H2 2018 | FY 2018 | H1 2019 | H2 2019 | FY 2019 | |
| Revenue (£k) | 32,298 | 32,347 | 64,645 | 28,442 | 33,862 | 62,304 | |
| Operating profit (£k) | 5,948 | 7,663 | 13,611 | 4,659 | 6,919 | 11,578 |
- Thorlux’s £11.6m profit was the division’s lowest for four years.
- TFW claimed Thorlux had suffered extra costs following a factory closure and “reduced efficiency due to managing the slowdown followed by a sudden ramp-up of production”. The division apparently enjoyed an “excellent recovery in orders in the second half”.
- Thorlux’s 18.6% full-year operating margin was the division’s thinnest for at least ten years. The second-half margin improved to 20% following the 16% H1 effort.
- Progress improved at Dutch subsidiary Lightronics during the second half. Following a mixed H1, full-year revenue and profit gained 11% and 15% respectively:
Lightronics| H1 2018 | H2 2018 | FY 2018 | H1 2019 | H2 2019 | FY 2019 |
| |
| Revenue (£k) | 10,210 | 10,650 | 20,860 | 11,869 | 11,285 | 23,154 | |
| Operating profit (£k) | 1,102 | 948 | 2,050 | 1,066 | 1,291 | 2,357 |
- Lightonics’s profitability now matches its 2017 peak.
- TFW’s eight smaller operations — which include Famostar — delivered aggregate full-year revenue and profit up 4% and 7% respectively.
| Other | H1 2018 | H2 2018 | FY 2018 | H1 2019 | H2 2019 | FY 2019 | |
| Revenue (£k) | 10,662 | 13,447 | 24,109 | 12,358 | 12,827 | 25,185 | |
| Operating profit (£k) | 782 | 2,625 | 3,407 | 1,220 | 2,441 | 3,661 |
- All of this ‘Other’ progress was achieved during the first half, with 5%-7% revenue and profit declines recorded during the second.
Enjoy my blog posts through an occasional email newsletter. Click here for details.
Financials
- The weaker Thorlux performance left the wider group margin at 15.7% — the lowest since 2005:
| Year to 30 June | 2015 | 2016 | 2017 | 2018 | 2019 |
| Operating margin (%) | 18.7 | 17.9 | 17.2 | 17.5 | 15.7 |
| Return on average equity* (%) | 27.6 | 26.2 | 27.2 | 26.5 | 24.0 |
(*Adjusted for cash, various investments and Lightronics/Famostar earn-outs)
- Return on equity was also chipped lower as profit fell while the asset base expanded.
- The five-year incremental return on equity is a worthwhile 13% (additional earnings of £6m were produced from additional shareholder equity of £45m).
- TFW’s balance sheet remains robust.
- Cash in the bank and fixed-term accounts ended the year at a record £57m, while debt remains at zero.
- Despite the enormous cash/investment position and lack of borrowings, finance income of £1,049k was almost entirely counterbalanced by financing costs of £1,046k.
- Financing costs have previously consisted mostly of a “share appreciation right distribution” — which reflects the dividends associated with the earn-out payable to the former owners of Lightronics and Famostar.
- The 2019 cash flow statement did not refer to a “share appreciation right distribution”, and the 2018 annual report does not make clear whether the entry will one day become a real-life payment or is simply the ‘bookkeeping cost’ of the earn-out. The forthcoming 2019 annual report may shed some extra light on the matter.
- Balance-sheet assets also include a £2m investment property, a £4m share portfolio and £4m of loan notes.
- TFW’s major liabilities are the Lightronics and Famostar earn-outs that total up to £13m.
- Cash flow was assisted by a £3.8m property disposal and the £2.6m receipt from a loan note (point 17).
- Working-capital movements released £2.2m, which supported total cash generation of £19m. Dividends of £6.4m left approximately £13m to be added to the cash position.
| Year to 30 June | 2015 | 2016 | 2017 | 2018 | 2019 |
| Operating profit (£k) | 13,718 | 15,959 | 18,189 | 19,225 | 17,357 |
| Depreciation and amortisation (£k) | 2,772 | 3,800 | 3,999 | 4,595 | 5,022 |
| Cash capital expenditure (£k) | (4,892) | (4,307) | (7,286) | (7,819) | (5,473) |
| Working-capital movement (£k) | (3,151) | (909) | 1 | (241) | 2,234 |
| Cash (£k) | 28,534 | 33,205 | 41,659 | 43,958 | 57,290 |
- Total capital expenditure once again exceeded the deprecation and amortisation charged against earnings.
- However, past differences have been due to TFW purchasing property— which should not lose its value in the way other plant and equipment would.
- During the last five years, TFW has spent £11m acquiring freehold assets — representing the difference between the aggregate capex expense and the associated depreciation and amortisation charge.
- In total, some £24m has been added to the cash position since 2014.
- Net cash and investments is arguably £57m (cash) plus £10m (loans/shares/investment property) less £13m (acquisition earn-outs) = £54m, equivalent to 47p per share or 17% of the current market cap.
- Management has never really explained why such a huge level of cash is needed.
- Acquisitions still appear the most likely reason — the results RNS claimed “numerous acquisition opportunities have presented themselves”. The purchase of Lightronics and Famostar have cost the group £13m to date.
- Surplus cash could also reassure customers and suppliers that, during recessions, orders will still be completed and bills will still be paid.
- Could another special dividend be declared?
- Special payouts were distributed during 2014 (1.5p per share) and 2016 (2p per share), when net cash and investments stood at £33m.
- A 2p per share special dividend would cost £2.3m.
- A £54m net cash/investment hoard is by no means the worst problem to handle in the stock market.
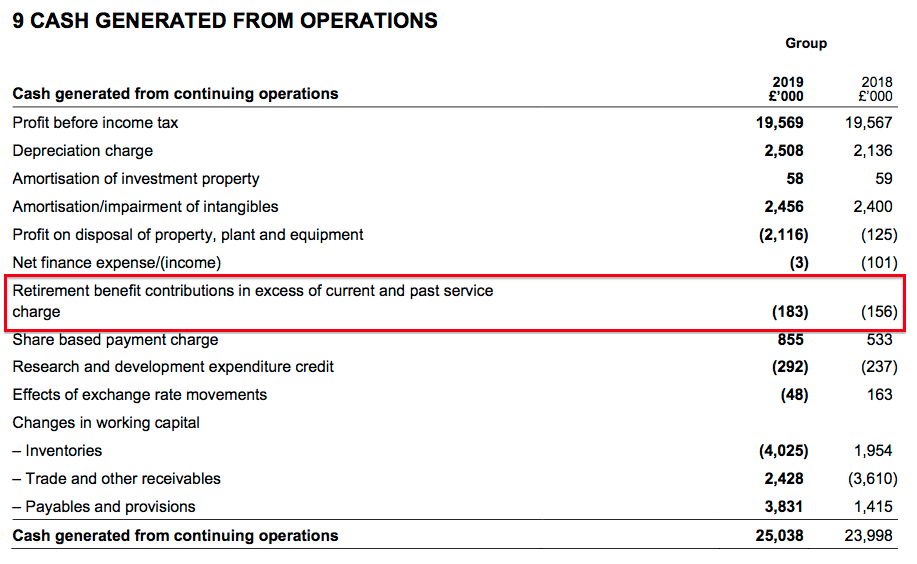
- TFW’s defined-benefit pension scheme remains in surplus, although a £183k cash contribution by-passed the income statement.
Product development
- The results RNS admitted: “Customer interest in LED luminaire technology has peaked because of the smaller improvements in LED chip performance.”
- The remark suggests previous years had enjoyed an LED tailwind that will not be repeated.
- TFW claimed LED lighting now uses up to 70% less power than its predecessors, and “systems now need to provide greater benefits in addition to energy saving alone”.
- Future products may one day provide “data and status information… for example, users’ presence-detection profiling to determine operational efficiency improvements, and automatic emergency lighting testing to provide health and safety compliance.”
- TFW also mentioned “warehouse dock door monitoring and solar panel energy logging”.
- Developing systems that oversee non-lighting devices may cause TFW to stray outside its circle of competence. The benefits of linking warehouse dock doors and solar panels to a lighting system are not obvious.
- Mind you, Thorlux has installed 909 photovoltaic panels on its factory roof, so perhaps the solar panel link actually has some merit:
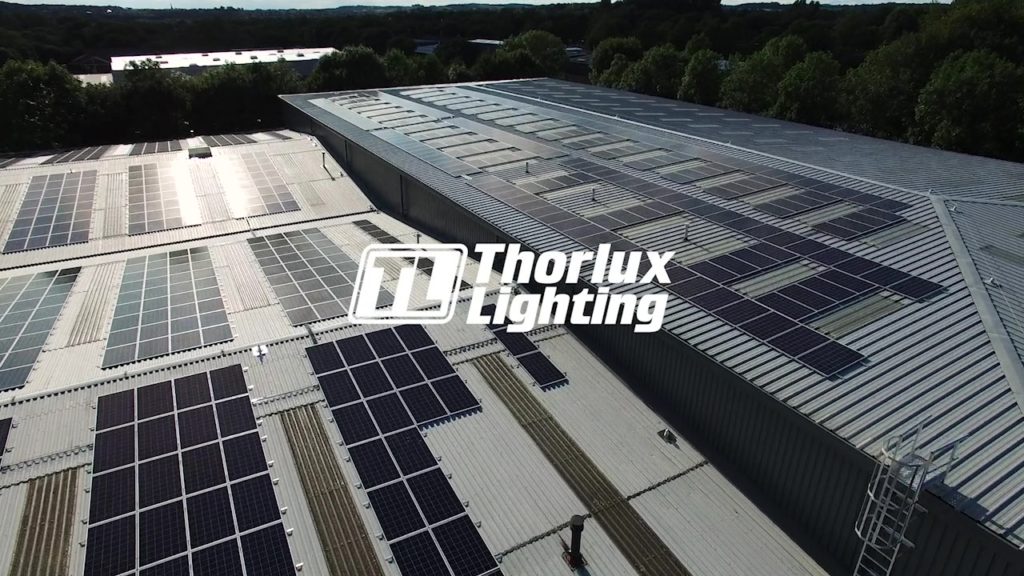
- Maybe TFW’s recent leadership change has sparked the interest in non-lighting applications. Long-time boss Andrew Thorpe became a non-exec earlier this year.
- TFW was optimistic the new products could work:
“If we can help people be more efficient and provide an environment in which they can be more productive, through good quality lighting, then that can deliver a return on investment more quickly than energy savings ever did.”
- A new range called Flex System — which boasts a “radical approach to lighting” — has recently commenced full production:
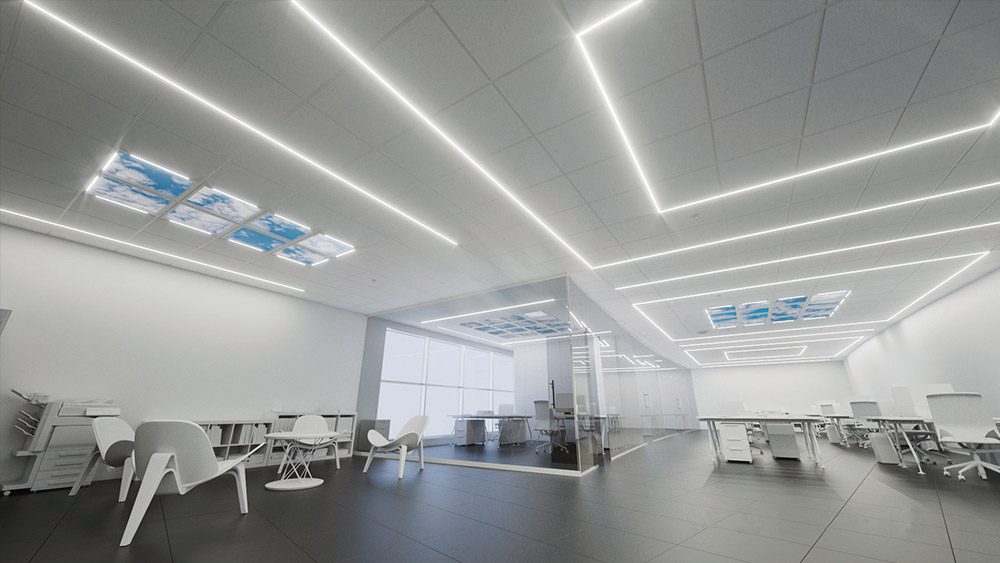
- The Thorlux website claims:
“The Flex System breaks with convention and takes the lighting outside of the ceiling tile aperture offering freedom and flexibility of scheme design. It is possible to light spaces with fewer luminaires than a conventional scheme. Fewer luminaires means fewer items of costly control gear keeping capital costs low and with fewer power connections labour costs are reduced too.”
- TFW’s SmartScan emergency-lighting product is set to be launched within Lightronics and Famostar. SmartScan sales doubled during 2018 to represent 13% of group revenue (point 1).
Valuation
- TFW did not appear too optimistic about the year ahead:
“We are, at this moment, however, subject to unpredictable economic conditions, particularly in the UK, with the threat of a disorderly exit from the EU and the Government in disarray. Whilst we have some plans in place to mitigate these impacts, current uncertainty only serves to weigh on our customers’ confidence to invest in capital projects. We can only hope that, whatever the outcome over the next few months, any downturn in some sectors will be offset by some reinvigoration in government-led investment.”
- I am hopeful TFW’s 2020 operating profit can match the £17.6m level recorded for 2019.
- If so, and using the 18% tax applied in these results, earnings could be £14.6m or 12.5p per share.
- Subtract the 47p per share net cash and investments from the 280p share price, and the underlying P/E could be 19.
- The valuation appears optimistic given revenue has stalled and profit has reversed.
- The 5.53p per share full-year dividend provides a 2.0% income.
Maynard Paton
PS: You can receive my blog posts through an occasional email newsletter. Click here for details.
Disclosure: Maynard owns shares in FW Thorpe.

FW Thorpe (TFW)
AGM statement
Here is the full text from November:
——————————————————————————————————————
At the Annual General Meeting of FW Thorpe Plc to be held at 3.15pm today, Chairman, Mike Allcock, will make the following statement:
“I am pleased to report that this summer’s trading, at our main division Thorlux Lighting, was significantly improved on the same period last year, and its order book has remained healthy throughout the autumn.
There are varying trading conditions across the Group, but generally order levels are good. The improved order book comprises some large one-off projects and we have experienced some margin pressure as a result.
Whilst we have had an encouraging start, the political and economic uncertainty make it difficult to predict trading for the full year and we remain focused on sustainable, long-term growth for the Group.”
——————————————————————————————————————
The tone appears a fraction more optimistic that what was said at the full-year stage.
Maynard
FW Thorpe (TFW)
Publication of 2019 annual report
Just catching up with this annual report, published last October.
Lots to go through here. Note that some of the additional management commentary has been overtaken by recent events.
1) Thorlux
Similar to last year, problems within the construction sector held back TFW’s largest division:
The division was targeting healthcare and logistics customers, which might now be useful during the pandemic.
Nice reference to patents about the new Flex System.
SmartScan revenue up 50% is very encouraging — this lighting system represents 20% of total revenue. SmartScan revenue was £7m for 2017 and £14m for 2018 and now more than £22m.
I am not exactly sure what “punching capacity” is, but it has increased and ought to mitigate further increases to employee costs (see point 12 below).
Encouraging to read TFW’s claims of Thorlux’s rivals not doing as well.
2) Portland
I am not sure Portland’s high margin will be sustained during 2020:
The subsidiary supplies lighting to high street retailers.
The margin for 2019 was 26%:
3) TRT
A new product called Optio may assist TRT following subdued demand for the division’s tunnel-lighting services during the last year or two:
The Optio product was showcased well in the annual report:
4) Lightronics
Main issue at the larger Dutch subsidiary remains how to cross-sell Thorlux products into Europe:
Sales of £0.4m generated for Thorlux does not sound great. The division’s outlook for 2020 appeared wobbly, too.
5) Famostar
Famostar’s first full year within TFW was better than expected:
6) Business model and market place
A reminder that TFW competes on product quality and long-term value for money:
Another reminder that healthcare and logistics are important markets:
Confiormation that lighting controls now include other sensors:
LED sales now represent 90% of group revenue.
7) Risks
No change to the Risks from last year’s annual report.
The risk of ‘price erosion’ has apparently increased, but the risk level remains Medium:
8) Corporate governance
TFW is only partially compliant on two of the ten points of the QCA code.
No audit committee:
No formal board evaluation:
One TFW private investor I know says the main board decisions are made at the Thorpe family’s kitchen table.
9) Audit
No issues. Materiality is a typical 5% of pre-tax profit while scope is acceptable at 91% of revenue:
PWC has signed off the books for at least 20 years.
10) IFRS 15
Adoption of IFRS 15 — revenue recognition of customer contracts — had no financial effect:
However, the implementation did prompt a new revenue ‘Services’ segment:
Such ancillary service income is small at present:
11) IFRS 16
Adoption of IFRS 16 — leases — for next year should not have a great effect on earnings:
12) Employees
I am impressed revenue was maintained at £110m as staff numbers were reduced by 7.5%:
Revenue per employee was £166k last year, a useful level for most businesses and a new high (the pervious peak was £165k for 2017). The cost per employee was £47k, up from £42k, to represent 29% of revenue per head (28% for 2018). Employee cost per head has been impressively consistent between 26% and 29% of revenue for the last 15 years.
The aforementioned additional “punching capacity” may keep a lid on employee costs during 2020.
Total options represent a modest 1.4% of the share count.
13) Director pay
TFW’s directors do like a bonus.
Last year (point 8) chunky bonuses were paid when I estimated operating profit gained an underlying 2%.
This year operating profit fell 9% and yet some useful bonuses were still declared:
14) Loan notes
Financial assets at amortised cost represent various loan notes:
The loan owed by former subsidiary Mackwell under IFRS 9 is now considered to be “underperforming”:
The subsidiary was sold more then eight years ago. Mackwell’s owner, Mr N Brangwin, is I am sure related to Mr C M Brangwin, who owns a 6.5%/£23m TFW shareholding. So the family ought to be good for the loan.
The loan relating to another disposal was repaid:
15) Equity portfolio
TFW’s equity portfolio fell 4% during 2019:
I remain unsure why the FD is dabbling with (high yield) shares.
16) Finance income and expenses
The share portfolio collected dividends of £225k:
I reckon the yield on the equity portfolio was therefore 6% at the 2019 year end.
Net rental income of £224k suggests the investment property book value of £2,006k is undervalued. The investment properties are a fishing site by the River Wye (used I understand for customer entertainment) and a woodland in Monmouthshire (used for corporate tree planting).
Share appreciation rights relate to payments to the former owners of Lightronics and Famostar. The higher payments presumably reflect improved divisional performances.
17) Intangibles
Nothing too untoward with TFW’s intangible assets:
The £0.5m difference between capitalised development costs of £2.4m and the associated amortisation charge of £1.9m is not substantial when operating profit was £17m. During the last five years, the aggregate difference has been a trivial £0.1m.
Capitalised development costs have a useful life of only three years:
18) Tangibles
Nothing too untoward with TFW’s tangible assets:
The figures are distorted by TFW’s freehold expenditure, which has totalled a net £11m or so during the last five years. Expenditure on plant and equipment has totalled £9m — which is equal to the total five-year depreciation charge. I would like to think TFW’s freeholds will not lose their value over time, so the overall tangible-asset accounting adds up.
Note that the freeholds have not been revalued for at least 20 years, so the £16m book value understates their true value:
19) Inventories
Stock levels climbed higher, but not almmringly so:
Average stock levels for the year represented 21% of revenue, within the tight 20%-22% range witnessed since 2011.
20) Trade and other receivables
Always encouraging to see trade receivables decline when revenue has advanced (albeit very slightly):
Average trade receivables represented 19% of revenue, within the range of 17% to 22% witnessed since 2006.
Past due receivables remain small.
21) Trade and other payables
Non-current liabilities is the main entry here:
Non-current liabilities are mostly owed ‘earn-outs’ to the previous owners of Lightronics and Famostar.
The FD’s commentary reminded me the change to these Non-current liabilities is reflected in the income statement:
So the better the Dutch divisions perform, the greater the earn-out charge.
22) Pension scheme
No issues here:
The scheme shows a £2m surplus that, due to accounting rules, is not recognised on the main balance sheet.
A 3% return from assets of almost £41m plus contributions of £606k should easily be able to pay annual benefits of £1.7m. (Read Some Thoughts On Pension Deficits). Scheme contributions for 2020 will decline a fraction.
Maynard