01 January 2022
By Maynard Paton
Happy New Year!
I trust you enjoyed the festive break and are now ready to battle the market for another twelve months!
This 4,609-word post provides a ‘year in review’ of my current holdings. I recap how each business performed during 2021 as well as provide a few remarks about valuation.
These reviews are very useful to write, not least because they help ensure I am still invested for the right reasons. Any upsets I will suffer during 2022 will most likely be caused by the shares I already own rather than any new shares I will buy.
I undertook the same annual review at the start of 2015, 2016, 2017, 2018, 2019, 2020 and 2021.
My portfolio gained 24.5% during 2021. This other post explains that performance in more detail and clarifies how my portfolio begins 2022.
I have covered each of my holdings below in order of size within my portfolio. I have accompanied each review with a SharePad chart to show how each company has progressed over the longer term.
Of course my calculations, logic, assumptions and charts may have little bearing on the future… so please do your own research and form your own conclusions!
Contents
- System1
- Tristel
- Mountview Estates
- S & U
- FW Thorpe
- M Winkworth
- Bioventix
- City of London Investment
- Mincon
- Andrews Sykes
- Tasty
- Summary
Disclosure: Maynard owns shares in Andrews Sykes, Bioventix, City of London Investment, Mincon, Mountview Estates, S & U, System1, Tasty, FW Thorpe, Tristel and M Winkworth. This blog post contains SharePad affiliate links.
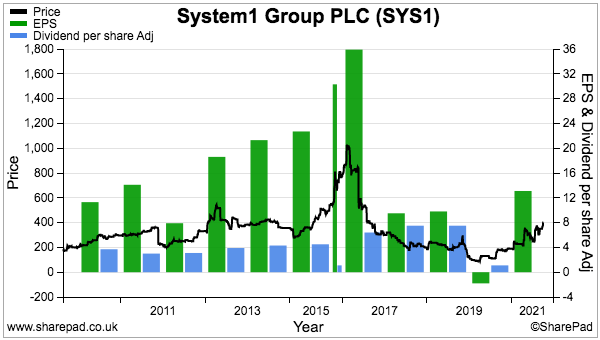
1) System1 (SYS1)
- Bid-price: 390p
- Market cap: £50m
- Portfolio weighting: 26%
SYS1 was my big investment idea of 2020… and also my big investment idea of 2021. I increased my holding by 40% during Q2 at 242p and today the share is by some distance my largest holding.
My purchase takes my average buy price to 212p after buying at 325p during 2016, 238p during 2018 and 183p during 2020. I have never sold, and I plan to sit tight during 2022 following last year’s bold management commentary.
Overshadowing July’s full-year figures was the board’s (public!) ambition of attaining a £1 BILLION valuation — which implied the then £40m market cap could in time rally 25-fold. Supporting the enthusiastic projection was SYS1’s transition from bespoke advert consulting to offering ‘scalable’ ad-data services.
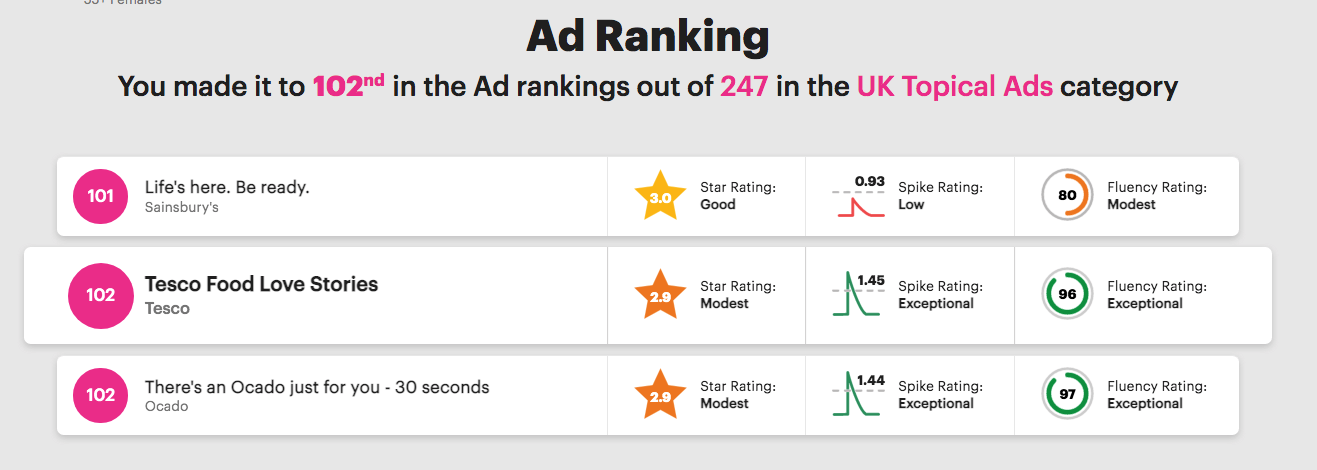
The transformation seems to be working, with ad-testing data income zooming from zero to 45% of revenue within the last 18 months. Management reckons global market share during the next decade can be lifted from 1% to 10% and has set a medium-term goal of quadrupling revenue to £100m-plus.
The executives are clearly not short on ambition. And tie-ups with ITV and now LinkedIn — alongside a raft of blue-chip customers that include Sky, Carlsberg and Kellogg’s — go a long way to validate the optimism. Hints of an operational moat are meanwhile supplied through the board’s use of “pioneering“, “proprietary“, “unique” and “largest“.
But SYS1 is not a guaranteed winner. The transition from consultancy to data involves greater costs and the 10% margin within November’s H1 results did not endorse an obviously powerful business.
The traditional consultancy work appears to be falling away faster than expected, too, and my earlier guess of a £3.6m annual profit for 2022 has been toned down to £2.6m.
Niggling away in the background are downgraded option targets, which do not sit well with that £1 BILLION ambition, and raised director pay, which feels wrong after SYS1 collected government pandemic assistance.
An outside risk is SYS1’s founder/executive president/23% shareholder using his creative/marketing skills to exaggerate his company’s potential. My investment will suffer badly if that is the case.
My SYS1 buy report | All my SYS1 posts
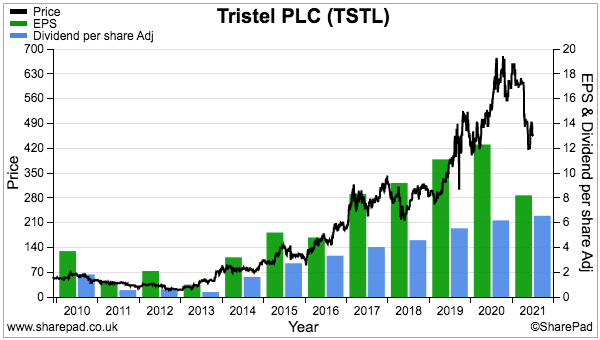
2) Tristel (TSTL)
- Bid-price: 445p
- Market cap: £215m
- Portfolio weighting: 11%
This time last year I wrote I was “likely to refrain from top-slicing [TSTL] during 2021“.
But top-slicing did cross my mind. My review of TSTL’s H1 figures at 600p indicated a stratospheric 48x P/E and even following a sales warning during April, the shares held up at the same level during the summer.
Then came October’s full-year results, which confirmed H2 revenue and profit had dived 15% and 36% respectively on the preceding H1. Progress was curtailed by NHS outpatient clinics postponing appointments and orders for TSTL’s medical-device disinfectants then drying up. The shares are now 445p having traded as low as 410p.
TSTL’s seven-year run of sales and profit growth ought to resume when the pandemic subsides and outpatient examinations return to previous levels. December’s AGM revealed hospitals had “gradually returned to normal service” and TSTL’s £15m revenue prediction for the upcoming H1 results broadly supports that claim.
I bought TSTL at a 46p average during 2013 and 2014, which makes it (almost!) a ten-bagger. But I sadly sold 75% during 2014, 2015, 2016 and 2017 at 79p, 100p, 123p and 289p.
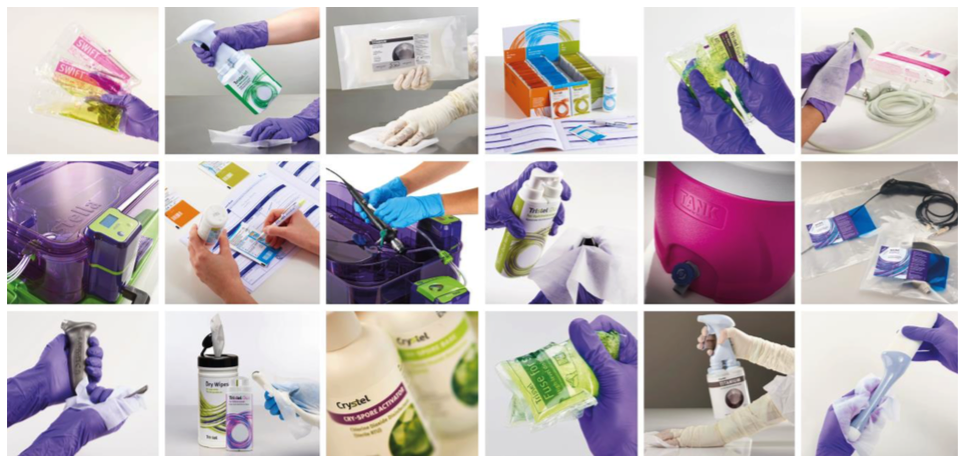
Dissuading me from further top-slices is a moat based upon product patents, scientific testimonies and manufacturer approvals. Then there’s TSTL’s growth potential overseas, particularly in the United States. An industry competitor recently implied the US market just for disinfecting ultrasound probes is $180m — a large sum when TSTL’s total international sales are presently £19m.
Following various submission mishaps, TSTL last year encouragingly set a 30 June 2023 target for regulatory product approval in the States. Throw in further sales opportunities in Europe, a healthy c20% margin plus management options that pay out in full if the shares hit 750p, and the stubbornly elevated P/E seems understandable.
For 2022 I trust sales can pick up following the Covid disruption and a product application is submitted to the US regulator. Longer term my fingers are crossed that single-use medical devices (which do not require any disinfection) do not derail TSTL’s business.
My TSTL buy report | All my TSTL posts
Enjoy my blog posts through an occasional email newsletter. Click here for details.
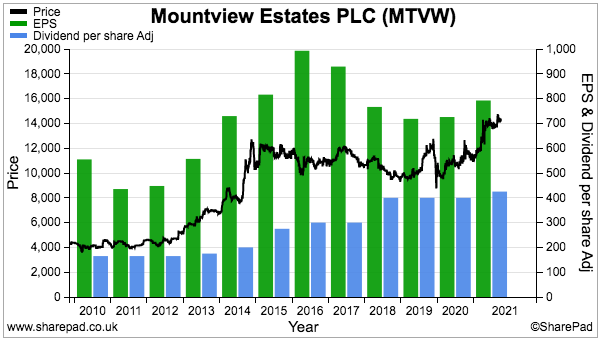
3) Mountview Estates (MTVW)
- Bid-price: £142
- Market cap: £554m
- Portfolio weighting: 10%
Maybe the MTVW board does listen to shareholders.
The regulated-tenancy landlord commendably hosted a traditional AGM during August, and questions were asked about the scale of reinvestment opportunities and whether surplus cash flow should now support higher dividends.
Sure enough MTVW announced within its November interims a 275p per share special payout — equivalent to 61% of the annual 450p per share ordinary dividend and quite possibly MTVW’s first ever one-off distribution.
The special payment may be signalling the start of the group’s ‘run off’ phase as it slowly heads towards the end of its “finite life“. But maybe MTVW’s life will be cut short. Management remarks at the AGM intriguingly noted the company may “get to the day when someone comes along and says I will take the whole [property] portfolio”.
Certainly a sale would settle the ongoing shareholder pressure; the minority faction of the founding Sinclair family (ownership 24%) disagrees strongly with the majority faction (ownership 50%) about the latter’s board stewardship, governance and pay. The chief exec is 75 years old and no obvious Sinclair family succession plans are in place.
MTVW’s board does remain deaf to calls for a formal estate valuation. Seven years ago the group revealed its properties could be worth £666 million versus their then £318m book value, but a follow-up revaluation has not been forthcoming. I have estimated MTVW’s property estate could be worth more than £200 per share — much higher than the £142 share price and £102 per share NAV.
I trust MTVW’s reliable financial history will be extended during 2022. Since the current chief exec took charge during 1990, NAV has rallied 18-fold (+10% per annum average) while the dividend has jumped 37-fold (12% per annum average). November’s results showed property sales (of £55m) running at pre-pandemic levels, but purchases (of £9m) running at their lowest since 2010. Were that performance to be repeated this year, MTVW’s net debt (of £16m) could be cleared entirely.
I first bought MTVW shares during 2011 at £42. I then topped-up at £98 during 2018 and 2019, and have never sold.
My MTVW buy report | All my MTVW posts
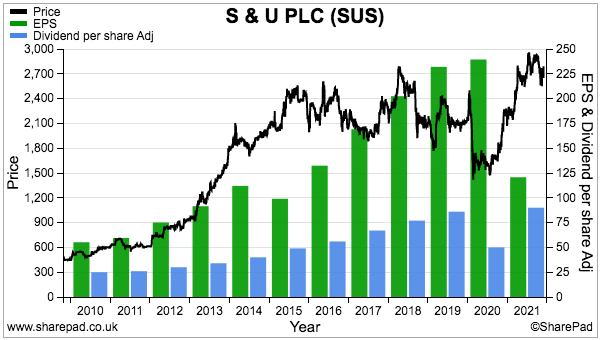
4) S & U (SUS)
- Bid-price: £27
- Market cap: £329m
- Portfolio weighting: 8%
Newsflow from this motor-finance lender gradually improved throughout 2021.
Annual results during March were predictably blighted by the pandemic. Lowlights included extra write-offs of almost £20m, profit diving 50% and the group’s first dividend cut since at least 1987.
But SUS’s veteran family board sounded a confident tone for recovery (“the skies are definitely brightening“) and sure enough, talk of “profit running ahead of expectations” was issued during May while trading was “ahead of expectations in terms of profitability, collections and book debt quality” during August.
The upbeat messages were underlined by a record H1 performance within September’s interims.
“Lower than normal” H1 loan write-offs implied SUS had been a tad cautious with its earlier provisioning, and led to a reassuring 50% dividend rebound. Collection rates and repayment punctuality meanwhile stood at multi-year highs and indicated commendable management of the ‘non-prime’ loan book.
An update the other week revealed collection rates improving further and suggested a recovery to pre-pandemic profit could occur sooner rather than later.

SUS’s return to form can be explained by the board’s “steady, sustainable” approach to long-term growth. With a £160m-plus shareholding at risk, the executives have consistently mitigated the downside by keeping loan quality high and balance-sheet gearing under control.
Those executives have enjoyed a 40-year tenure, and an appointment last year signalled the next generation of family leadership that ought to see the company through to its 2038 centenary and beyond.
For now I am hopeful that the commendable collection rates mixed with various projects to attract higher-quality customers could lead to better returns on capital. Past ROCE has never been spectacular at c15%, which has meant the market cap has rarely traded at a premium multiple.
The £27 shares are close to their pre-pandemic high and already seem to expect a full earnings revival. The 4%-plus dividend yield may therefore provide the bulk of 2022’s returns.
I first bought SUS during 2017 at £21 and bought more during 2019 at £19 and again during 2020 at £17. I have yet to sell.
My SUS buy report | All my SUS posts
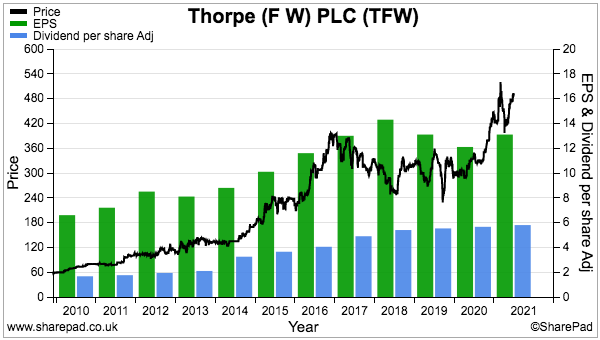
5) FW Thorpe (TFW)
- Bid-price: 482p
- Market cap: £564m
- Portfolio weighting: 8%
Last year was better than I had anticipated for TFW.
The lighting manufacturer had talked earlier of an impending “global recession” leading to a “downturn in orders“, but March’s H1 statement sounded a more optimistic tone.
A “healthy” order book alongside “better than expected” trading ensured a “resilient” performance that hoisted first-half profit by 2%. The small uplift was achieved despite a factory fire at a Dutch subsidiary.
October’s annual results were satisfactory, and included a record H2 and a special payout to complement the 19th consecutive annual dividend lift. TFW said the pandemic uncertainty had prompted customers to seek “tried and tested” manufacturers, which ought to have favoured this 85-year-old business.

The founding Thorpe family remains a 45%-plus shareholder and insists on a bumper cash hoard to ensure stability and sustain innovation.
At the last count the £76m net cash position was equivalent to an enormous five years’ annual earnings, but how much of that cash was actually needed to support the company was not really clear… until two acquisitions late last year.
TFW has spent an aggregate £27m buying a 63% stake in a Spanish lighting group and a 50% stake in a Dutch manufacturer of electric-vehicle chargers. Potential earn-outs and previous European deals will bring total overseas investment to approximately £75m… which is unquestionable evidence of a significant strategic change when the prior 20 years saw just £5m spent buying a handful of small UK outfits.
The European acquisitions ought to bolster TFW’s return on equity, which has sat at a modest 11% of late due to minimal income from that bumper cash pile. A 19% margin at the Spanish purchase may help improve the group’s 16% margin, too.
TFW’s new ‘buy and build’ mindset, the ongoing success of lighting system SmartScan, significant ESG attractions through energy-saving products and seasoned long-term management perhaps explain why the shares trade at a premium 30x earnings.
TFW is my longest-held share after I first bought during 2010 at 69p. I bought more during 2011 at 80p and during 2012 at 89p, but sold 25% at 234p during 2016 on (unfounded) valuation worries.
My TFW buy report | All my TFW posts
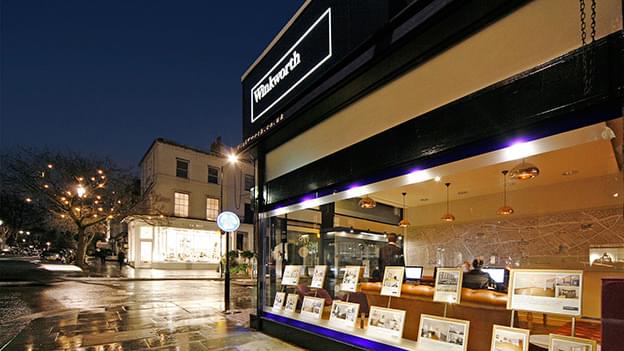
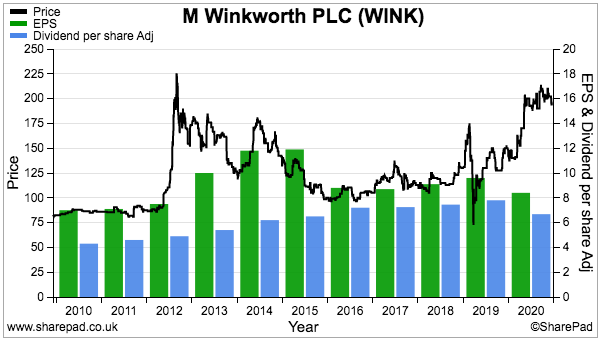
6) M Winkworth (WINK)
- Bid-price: 186p
- Market cap: £24m
- Portfolio weighting: 8%
WINK was the second of the two shares I bought during 2021. I increased my holding by 10% at 178p during Q2 after reading these promising yearly figures alongside the declaration of a record quarterly dividend.
This estate-agency franchisor is very much a textbook Respectability At a Modest Price (RAMP) share. Attractions include seasoned family directors who reward shareholders through durable payouts, and some classy financials that showcase 20%-plus margins alongside a cash-flush balance sheet. The P/E appeared modest when I topped-up at 11-14x.
Having proved surprisingly resilient during the lockdowns of 2020, WINK last year capitalised on an “extraordinarily active” London housing market that was fuelled by temporary stamp-duty reductions and changing commuting patterns.
September’s first-half statement showed revenue surging 107% that in turn quadrupled H1 profit to £2m — a level that exceeded WINK’s record full-year profit of £1.8m from 2014.
WINK said during November that 2022 ought to see “a return to more normal conditions“, although progress could be a little better than the cautious directors anticipate. The same November statement revealed trading during H2 had remained “strong” and that 2021 earnings would be “materially higher than expectations“.
WINK’s fledgling strategy of buying estate-agency branches — alongside acting as a franchisor — appears to be a good use of the group’s surplus cash. The company currently co-owns two branches and the 2020 numbers suggested one investment was conducted on a P/E of 3.
The board commendably answered my emailed AGM questions about the co-owned branches, and claimed the group’s “main focus” will remain franchising and that a healthy level of cash would always be retained. But my sums indicate one of the co-owned branches may now represent a sizeable 12% of group profit.
Events at prominent London rival Foxtons (FOXT) should be monitored this year. Notable non-executives (here and here) have beefed up its board to presumably help recapture market share previously lost to the likes of WINK.
Last year’s top-up followed my initial WINK buy at 90p during 2011 and sale of 70% of my holding during 2013 and 2014 at 173p. I rebuilt my stake at an average 116p during 2016 and 2017.
My WINK buy report | All my WINK posts
So you have UNDER-PERFORMED during 2021? What now? Read more.
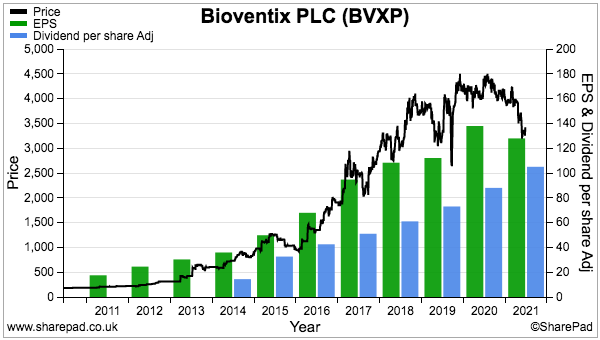
7) Bioventix (BVXP)
- Bid-price: £33
- Market cap: £172m
- Portfolio weighting: 8%
BVXP started 2021 as my second largest holding and finished the year as my seventh largest.
A 22% price decline was prompted by i) the pandemic reducing the frequency of routine blood tests in hospitals, and; ii) investors realising long-term upside had become more dependent on R&D projects that won’t reach commercialisation until 2025 at the earliest.
Results from this antibody specialist were not awful. H1 figures during March showed underlying profit down 2% while the full-year statement during October revealed H2 underlying profit up 14%.
The progress highlight was newish antibody troponin doubling its sales to 6% of the group total. Income from BVXP’s other top antibodies were broadly flat.
The expiry of product income representing 12% of total revenue is likely to hinder the FY 2022 performance unless troponin sales double once again. Note that troponin has a finite financial life; BVXP’s income from this antibody expires during 2032 and my (optimistic) guess of a £34m lifetime-earnings contribution is not huge versus the recent £172m market cap.

The languishing share price could be transforming BVXP into an income stock. Total ordinary/special dividends last year came to 143p per share and presently support a 4%-plus income after the annual payout was lifted 19% and a special payment was declared for the sixth consecutive year.
BVXP’s liking for special dividends reflects the exceptional economics of collecting royalties and licence fees from successful antibodies. Margins surpass an incredible 70% in part because the company requires only 17 employees and a small laboratory to operate. The inherently low costs then leave plenty of spare cash for shareholders.
Although income growth may be muted for the next few years — the combined ordinary/special payout was lifted just 1% last year — BVXP should offer some predictability. Once in general use, diagnostic antibodies tend not to face much interference from new competition. Sector leader Roche reckons the wider antibody market has grown at 4% per annum during the last decade.
I bought BVXP during 2016 at £11 and the price has since tripled. I have never top sliced, and hope a suitable buying opportunity arises to prompt a further purchase.
My BVXP buy report | All my BVXP posts
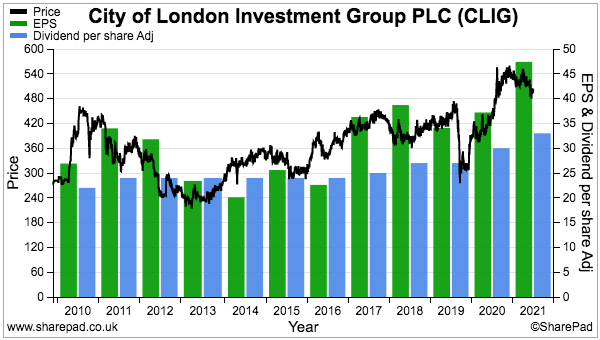
8) City of London Investment (CLIG)
- Bid-price: 498p
- Market cap: £252m
- Portfolio weighting: 6%
“I look forward to collecting the 7% income during 2021” was how I rounded off last year’s CLIG review.
My income was in fact 7.7% on the year’s 431p starting price after CLIG’s annual payout came in 10% higher than I had predicted.
Buoyant markets, the merger with Karpus Investment Management and record $11b funds under management supported the dividend advance. And the yield is still a juicy 6%-plus for 2022.
The high income is due to this fund manager i) deliberately paying out an average 80% or so of earnings as a dividend, and; ii) offering inherently modest growth prospects.
The limited prospects are due to new client money being frustratingly low. Somewhat astonishingly, 2021 witnessed clients withdraw $752m to almost entirely negate the net client money of $758m received during the previous five years.
CLIG said the withdrawals were due to clients “rebalancing” their portfolios, but CLIG’s funds look to have collectively underperformed the MSCI World index between 2016 and 2021. CLIG’s own projections for 2022 indicate new client money will increase funds under management by just 3%.
The annual report small-print owned up to the company still using paper payslips and fax machines, and I just wonder if this business has become stuck in its ways. Prior to the Karpus merger, almost half the workforce had served at CLIG for more than ten years and may have become a little too comfortable investing in the same old way.
Perhaps Karpus founder George Karpus can galvanise proceedings via his non-executive position and 36% CLIG shareholding. Mind you, the main board is staffed by ten other directors so swift decision making could be hard going.
CLIG’s accounts are some of the best in my portfolio; margins are a startling 49% while super cash conversion has allowed net cash to pile up to a chunky £26m. A tantalising thought is how the financials could look if CLIG ever won large new mandates and enjoyed even greater economies of scale.
I invested at a 281p average between 2011 and 2013, and sold 42% during 2015 at 335p.
My CLIG buy report | All my CLIG posts
9) Mincon (MCON)
- Bid-price: 112p
- Market cap: £238m
- Portfolio weighting: 3%
Does MCON enjoy a competitive moat? That was the question I asked throughout 2021 and I did not derive a clear answer.
I invested at 45p during 2015 based on the drill manufacturer’s “superior designs, unique processes and the highest engineering standards“. Margins at the time were a healthy 19% and implied a good operational advantage. Founder family management owning 57% of the business was another crucial attraction.
The management is still in place but the margins have since reduced. For 2020 the operating margin was 14% and for H1 2021 the margin was 11%. True, the pandemic has disrupted proceedings while shipping and material costs have risen. But the levels of profitability do not really underline claims of “the highest engineering standards”.
My questions at the (online) AGM prompted the executives to explain MCON had evolved from operating as a niche, high-margin drill supplier with perhaps modest growth prospects to becoming a wider, middle-margin drill supplier with possibly better growth prospects.
The wider drill range means MCON can now bypass intermediaries and go direct to mining customers and secure greater profits through large supply contracts. Good progress has been made selling to construction companies, too, with the sector now representing 30% of revenue versus zero five years ago.
Mix in ambitious product developments (notably the ‘Greenhammer’ project that management claims could deliver “significant incremental profitability“) with the long-term mindset of the board (the controlling family established MCON in 1977), and perhaps shareholders just need to be patient for the moat-type financials to emerge.
MCON in the meantime operates with less-than-ideal accounts. In particular, numerous bolt-on acquisitions, notable capital expenditure, capitalised Greenhammer R&D and substantial working-capital demands have led to very low cash generation. The group’s €49m flotation war chest from 2013 has in fact shrunk to net debt of €8m.
The shares were remarkably steady last year and did not present an obvious buying opportunity at 20 times my last earnings guess. I have never top-sliced my holding, but am willing to buy more on speculation a moat may one day emerge.
Tellingly, the family management did not sell any shares at the 2013 float and has not sold any since.
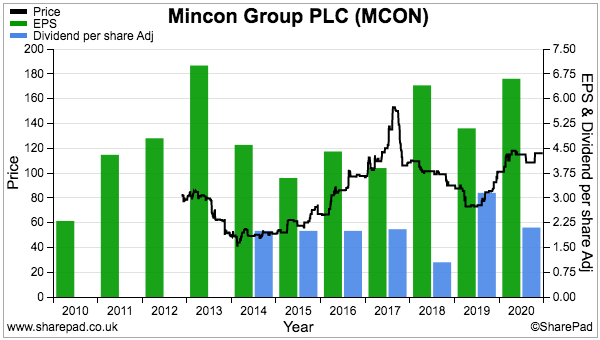
My MCON buy report | All my MCON posts
Reader offer: Claim one month of free SharePad data. Learn more. #ad
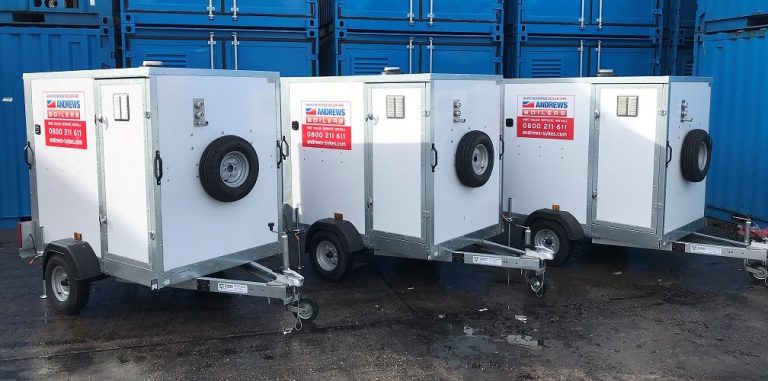
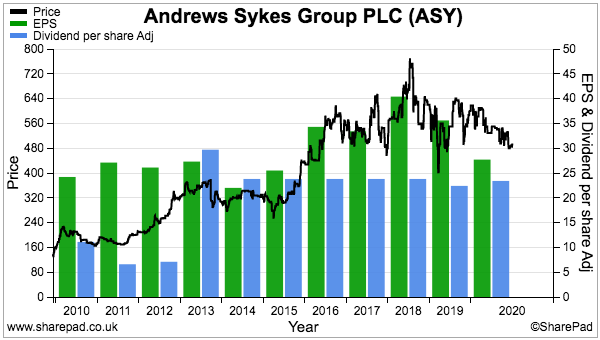
10) Andrews Sykes (ASY)
- Bid-price: 470p
- Market cap: £198m
- Portfolio weighting: 2%
This coming year should mark a milestone for my ASY investment. I purchased the holding at an average 233p during 2013 and subsequent dividends have reached 230p — teasingly close to recouping my entire outlay through payouts alone.
The dividend proved reasonably resilient during 2021 despite the equipment-hire company reporting its weakest yearly performance since 2016. The final payout was trimmed 3% from ASY’s standard 11.9p per share even though H2 profit dived 37%. Pandemic restrictions and a mild winter (less demand for ASY’s temporary heaters and boilers) were blamed for the shortfall.
Improved progress was happily reported within September’s interims. Lifted restrictions especially in Europe helped H1 profit gain 14% and the dividend was returned to its usual level. The accounts remained in good shape, too, with margins topping 20% and net cash in excess of £20m. ASY’s blog has been kept busy of late with water-pump projects and even reports the group’s air-filtration machines helping limit the spread of Covid-19.
My hefty dividend return reflects the group’s 90% family owners and their liking for income. ASY has in fact distributed approximately 85% of its reported earnings to shareholders since I joined the register.
The payout is admittedly the same as it was back in 2014, which may not bode well for future dividend growth and therefore makes the starting yield for today’s buyers all the more important. I presently collect a 10% income on my original purchase; today the shares yield nearly 5%.
The 10% free float deters many investors from ASY, and ‘fiefdom’ risk is a persistent worry as the day-to-day executives perhaps focus on pleasing the 90% owners to the detriment of the other 10%. My emailed AGM question to the board received no response, which is a bad sign, although the subject matter did pre-date the appointment of both the present MD and FD.
I asked how ASY could state “In the UK, approximately 50% of our employees are furloughed” during the early phase of the pandemic but the associated results then showed UK revenue unchanged at £20.9m. Just how UK sales kept steady when half the workforce was at home remains a mystery.
My ASY buy report | All my ASY posts
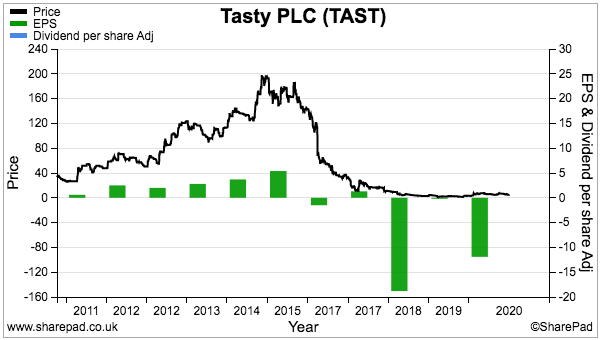
11) Tasty (TAST)
- Bid-price: 5p
- Market cap: £7m
- Portfolio weighting: 1%
The receipt of a £1.25m bank loan during January was the signal this struggling restaurant chain might not go under last year.
Barclays would only grant the loan if TAST’s future was “assured“, and while I would not say TAST’s future is now bright, the group has not gone broke just yet.
Covid-19 guaranteed TAST’s 2020 results would be terrible, although H2 2020 did witness a tiny profit supported by reduced pandemic restrictions, furlough benefits and the Eat Out to Help Out scheme.
September’s H1 statement then revealed a £1.5m loss after the restaurants were shut for the first three months of 2021. TAST said net cash was effectively £4.2m, which might be enough to ensure survival after early H2 sales exceeded expectations. Supportive negotiations with landlords and TAST dropping its CVA warning are other positive omens.
I can’t say I am keen to buy more TAST. Yes, the pandemic will eventually subside, TAST’s 50 or so sites might then earn revenue close to £40m and the present £7m market cap could then look bonkers cheap.
But will the company ever develop superior financials? I am not convinced, although I am willing to hold on as the chain emerges post-Covid with cheaper rents, operational efficiencies and a new takeaway service. You never know, the pandemic’s silver lining could be long-lasting enhanced economics for the entire restaurant sector.
TAST proves that significant family shareholdings do not always lead to great investments. The Kaye family owns at least 32% of this business and has built and sold successful restaurant chains before, but this time could not cope with greater competition, rising staff costs and the resultant margin squeeze.
The Kayes have all now departed TAST’s board, which I trust will leave the chief exec free to lead his own strategy.
I first bought TAST at 50p in 2011 and again at 98p in 2014. I sold 15% during 2016 at 179p — and of course regret not selling the rest with the shares now at 5p. Instead I bought more at 45p during 2017 and even more during 2018 at 15p. Today I need an 8-fold recovery just to breakeven.
My TAST buy report | All my TAST posts
Summary
Last year I kept with the same 11 shares and my holdings mostly exhibit the traits outlined in How I Invest:
- Capable, owner-aligned management;
- Decent accounts;
- Respectable track records, and;
- Reasonable prospects.
I admit TAST no longer meets that criteria (if it ever did), but TAST’s shares have long since passed their sell-by date and a 1% position won’t do much harm even if the worst does happen.
The plan for 2022? I am hopeful my returns will remain positive as I build further higher-conviction holdings. My portfolio has a 8% cash position to deploy, and potential top-up candidates include ASY, BVXP, CLIG, MTVW, SUS and WINK. My SharePad articles could of course identify some suitable alternatives.
I trust you found this annual review informative. I certainly found it useful to write.
Please click here to examine my portfolio’s 2021 performance in more detail.
Until next time, I wish you safe and healthy investing!
Maynard Paton
PS: You can receive my blog posts through an occasional email newsletter. Click here for details.

Hi Maynard
Congratulations on a very good 2021.
The only holding we have in common is S & U, which had a better 2021 than I thought it would. I think the interesting points with S & U are (a) Graham Wheeler and (b) Aspen Bridging.
Hiring Wheeler as CEO was a huge win because he brings so much experience and ability. Hopefully he’ll stick around long enough to make a real difference over the next decade or so.
As for Aspen Bridging, obviously the lockdown property madness helped, but this startup is growing very fast and really leverages S & U’s expertise in more complex lending situations.
Also, I hold Close Brothers and the potential for a takeover of S & U has cropped up a couple of times in presentations. Personally, I think CB would only be interested in Aspen, but you never know.
Hi John,
Many thanks for the comment.
Yes, Graham Wheeler has come across well on those InvestorMeetCompany webinars and seems to have initiated a few new growth projects, including one with affinity partners. The ambition there is to improve the group’s loan book by capturing ‘almost-prime’ customers that are not too far from making the cut with the mainstream dealers. The idea feels promising to me.
GW was appointed just before Covid struck, so I don’t think his experience has yet to show through in the accounts.
I did not know SUS was a target for anyone! Not sure the Coombs family is looking for an exit, and the younger Coombs who helps run Aspen is now a board executive. So succession planning now looks in place for the longer haul.
Among my other shares, City of London Investment is a high yielder that I don’t think will provide much disappointment income-wise — although growth may be modest. But I recognise specialised fund managers are not for everyone, as I see from your comment on Ashmore :-)
Bioventix is also interesting for income if you take the combined ordinary and special payouts.
Maynard
Maynard,
Happy New Year and nice to see your portfolio growth in 2021
All the best
David
Thanks David! Best wishes for the year ahead.
Maynard