24 February 2021
By Maynard Paton
Results summary for City of London Investment (CLIG):
- Very buoyant markets alongside the Karpus merger helped funds under management (FuM) reach a record $10.9b and lift the dividend by 10%.
- Client ‘rebalancing’ led to FuM withdrawals and, despite fledgling strategies attracting new money, overall fund flows remain frustratingly low.
- Recent leadership retirements have not led to any dramatic changes and shareholder information has remained reassuringly comprehensive.
- The Karpus merger has raised the group margin to an astonishing 55%, but future bonus-pool arrangements could reduce such profitability.
- The possible P/E is 11 and near-term yield might top 7%, although the shares have been valued modestly for years and a sustained re-rating remains very elusive. I continue to hold.
Contents
- Event links, share data and disclosure
- Why I own CLIG
- Results summary
- Revenue, profit and dividend
- Funds under management and EM capacity
- Fund net flows
- FuM fee rates
- Management
- Employee Incentive Plan
- Financials
- Valuation
Event links, share data and disclosure
Event: Interim results and presentation for the six months to 31 December 2020 published 15 February 2021, and webinar hosted 18 February 2021.
Price: 520p
Shares in issue: 50,679,095
Market capitalisation: £264m
Disclosure: Maynard owns shares in City of London Investment. This blog post contains SharePad affiliate links.
Why I own CLIG
- Fund manager that employs a lower-risk strategy of buying investment trusts at wide discounts through a “team approach to investing“.
- Accounts showcase very high margins, net cash and ability to distribute majority of earnings via dividends.
- P/E of 11 and yield of 7% offer re-rating potential should sizeable new mandates ever bolster funds under management.

Further reading: My CLIG Buy report | All my CLIG posts | CLIG website
Results summary
Revenue, profit and dividend
- These H1 results were the first to include a contribution from Karpus Management, a US investment company that joined CLIG last year through a £102m merger.
- A Q1 statement issued during October and a Q2 statement issued during January had already heralded a positive first half.
- The level of CLIG’s revenue and earnings are inherently linked to the ups and downs of the group’s funds under management (FuM).
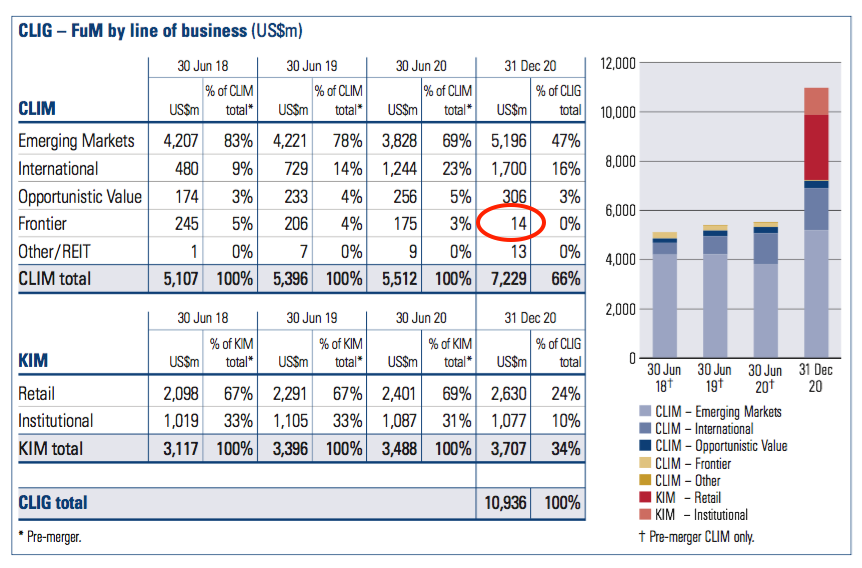
- Excluding Karpus, FuM at CLIG’s City of London Investment Management subsidiary (CLIM) climbed 8% during July, August and September to $5.9b, and then surged 22% during October, November and December to $7.2b.
- The additional FuM was generated entirely by investment returns rather than through extra client money (see Funds under management and EM capacity).
- Karpus brought extra FuM of $3.6b, which at the time of the merger improved CLIG’s total FuM by 66% to $9.5b.
- Both FuM at CLIM ($7.2b) and Karpus ($3.7b) stood at record levels at the half-year end.
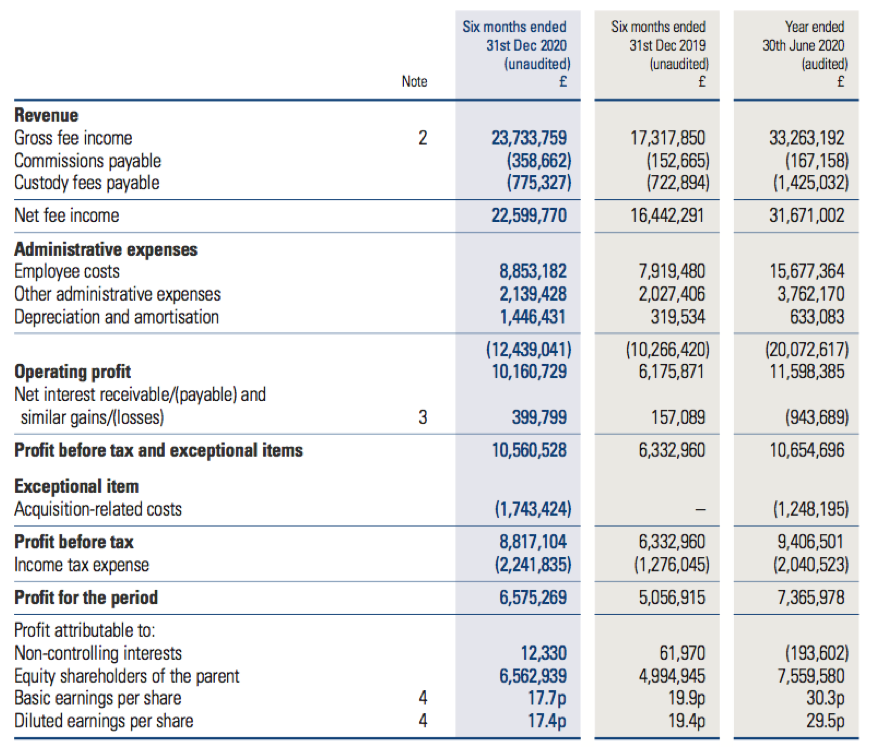
- CLIM’s rising FuM plus the Karpus merger caused total revenue to advance 37% and reported operating profit to jump 65%.
- CLIG revealed Karpus contributed H1 net fee income of £5.1m and H1 pre-tax profit of £3.4m, and described that contribution as “robust”:
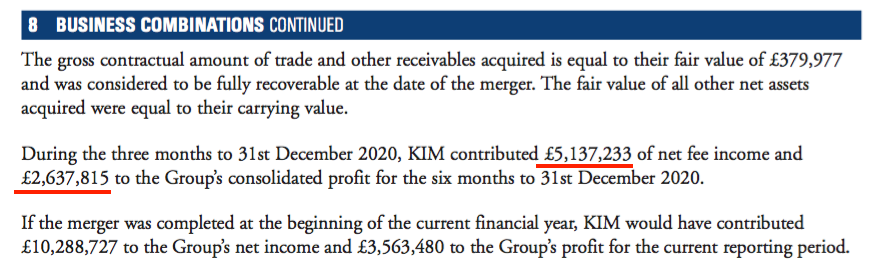
- Excluding the Karpus contribution, net fee income gained 6% to £17.5m and adjusted pre-tax profit improved 26% to £7.8m.
- Net fee income gaining 6% at CLIM compares with average CLIM FuM for the six months climbing 14%.
- CLIG claimed fee growth (6%) was less than average FuM growth (14%) because of a weaker USD compared to GBP (1.30 versus 1.26) and a lower fee margin (74 basis points versus 75, see FuM fee rates).
- These H1 figures showed a £1.7m exceptional item relating to the Karpus merger. Including earlier merger costs of £1.2m and share-issue expenses of £1m taken directly to the balance sheet, total exceptional Karpus charges now match CLIG’s predicted £4m.
- Reflecting management’s “cautious optimism”, the interim dividend was lifted a penny to 11p per share.
- CLIG’s Covid-19 problems did not seem major:
“To foster interaction between colleagues, and to combat any feelings of professional isolation as the remote working environment moves towards a full calendar year, we have contracted with a third-party vendor to provide a series of virtual “team connection events” during the winter and spring.”
Funds under management and EM capacity
- CLIM’s FuM can be divided into two main categories:
- Emerging Markets (EM), and;
- non-EM, which covers frontier markets, developed markets, REITs and other themes.
- Both categories apply CLIG’s long-standing ‘value’ approach of buying investment trusts at wide discounts.
- Karpus meanwhile manages a mix of US equities, including investment trusts, and fixed-income securities.
- At the half-year, CLIM’s EM FuM stood at a record $5.2b and non-EM FuM stood at a record $2.0b:
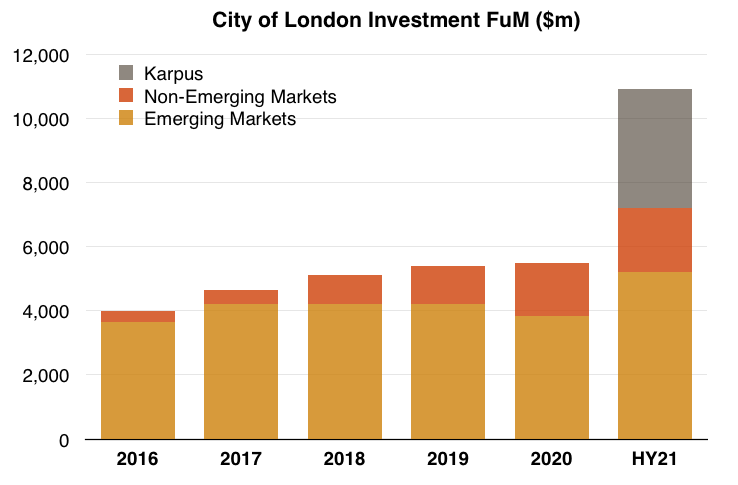
- Both EM and non-EM FuM were propelled by very buoyant markets — investment returns surpassed 30%:
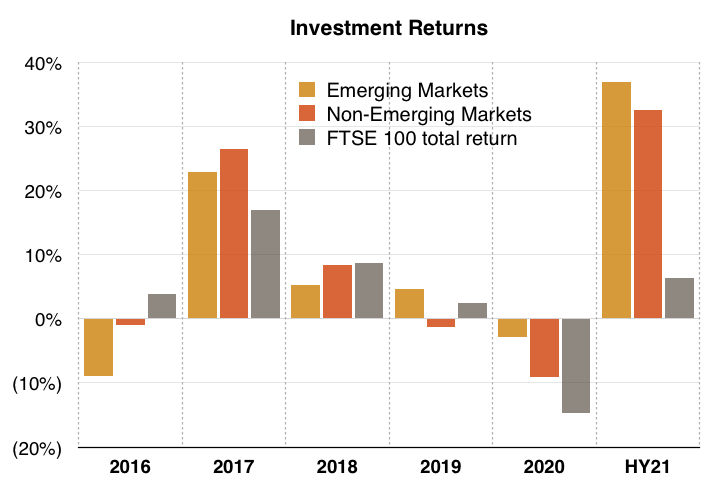
- I calculate Karpus FuM enjoyed a 7.5% return following the merger at the start of Q2.
- CLIG mentioned “capacity” was an issue within the preceding FY 2020 results:
“Our overriding objective when considering capacity and raising assets is our ability to generate alpha for our clients on a sustainable basis. In this regard we will not jeopardise long-term performance, and with it, long-term client relationships.”
- At the time CLIG claimed EM FuM had a $4b capacity:
“Our objective is to keep the EM strategy assets around current levels (US$4 billion) whilst the International strategy has paused active marketing following a two-year period of very strong asset growth. We will reappraise capacity at year end 2020.”
- CLIG did not mention capacity within these results, despite EM FuM standing at 30% above the supposed $4b capacity.
- Management stated on the webinar that EM capacity in fact moves in tandem with the market, and EM capacity therefore now exceeded $5b. The directors claimed during the webinar they were “coping just fine” with EM FuM, albeit such FuM is seemingly very close to full capacity.
- Management claimed on the webinar that the non-EM strategies had “ample capacity” for new clients.
Enjoy my blog posts through an occasional email newsletter. Click here for details.
Fund net flows
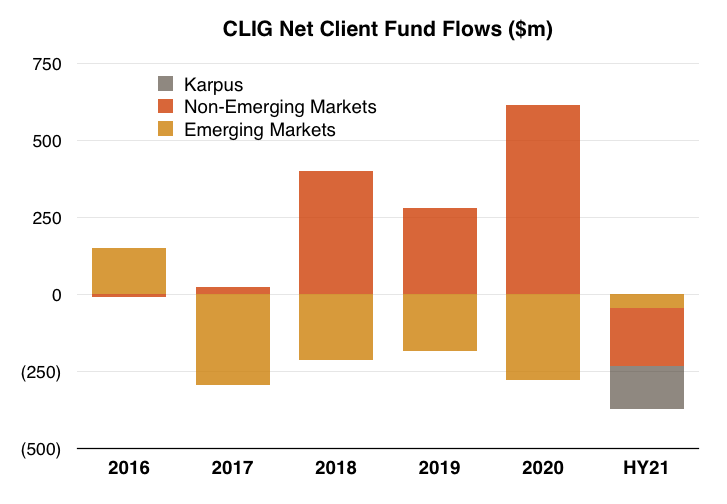
- My FY 2020 results write-up remarked upon the very low levels of new client money that CLIG attracts.
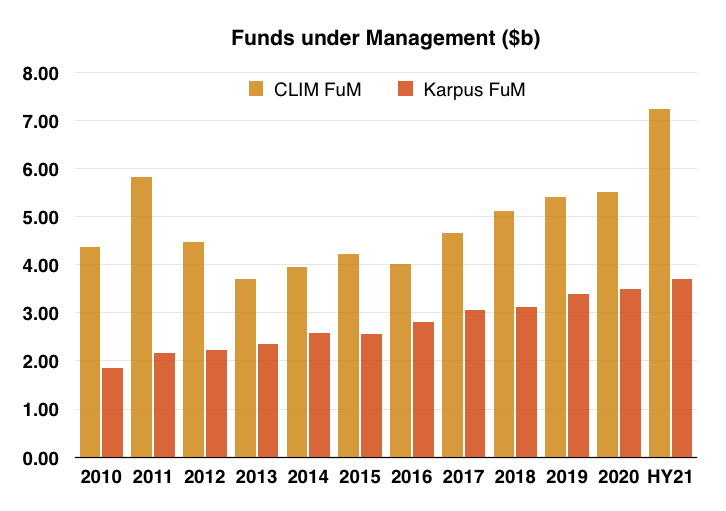
- My chart below puts such ‘fund net flows’ (red bars) into perspective against existing FuM (yellow bars):
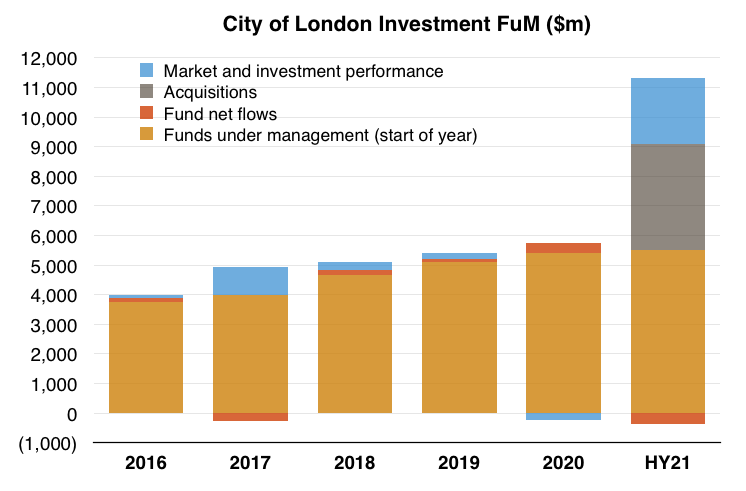
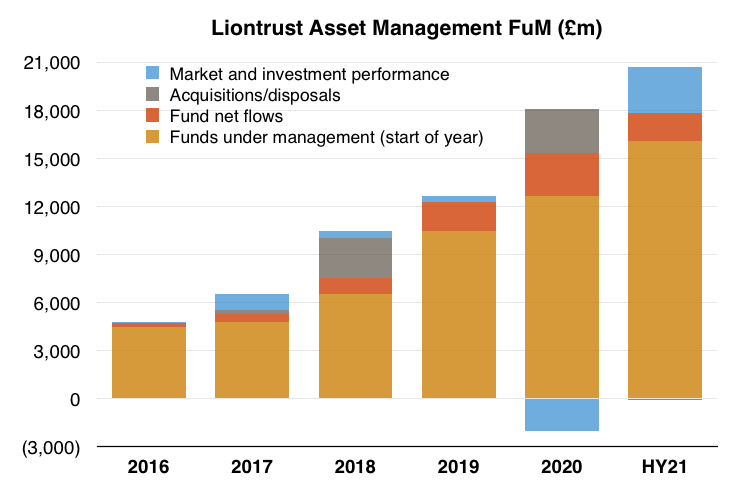
- Contrast CLIG with Liontrust Asset Management (LIO), where fund net flows (red bars) are much larger:
- Annual new client money at CLIG represented an average of 2% of year-start FuM between 2016 and 2020.
- Annual new client money at LIO meanwhile represented an average of 12% of year-start FuM (including acquired FuM) between 2016 and 2020.
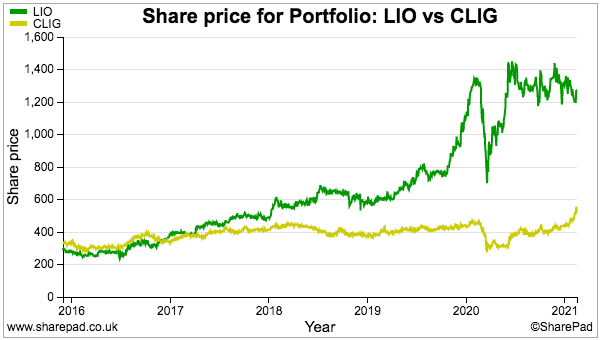
- LIO’s shares have unsurprisingly outperformed CLIG’s shares over the same time:
- Mind you, CLIG has made good progress attracting new money within its non-EM division.
- The International and Opportunistic Value approaches have expanded from $219m to $2b FuM since 2017…
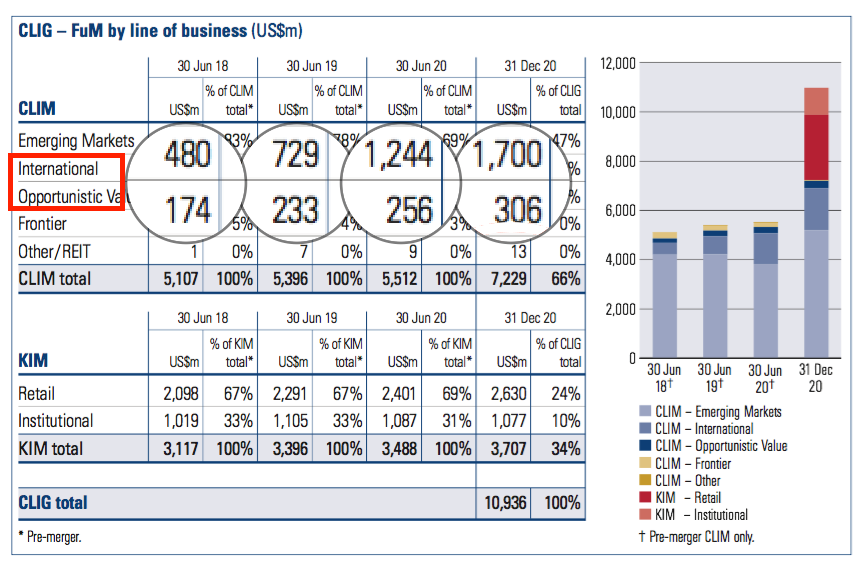
- …and the associated red bars representing new fund flows have been much larger:
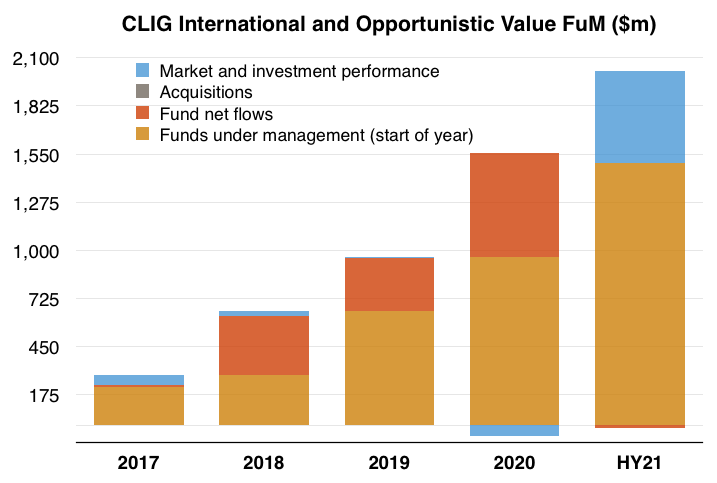
- That said, the International and Opportunistic Value approaches represent only 18% of total FuM — and may take “many years” before their levels of new client money become meaningful at a group level.
- CLIG admitted as such within the Karpus merger document:
“However, organic diversification is a slow process, requiring many years to establish teams able to generate a superior track record that will attract new fund flows.”
- CLIG experienced net client withdrawals during this H1:
- CLIG said:
“After a period of strong absolute and relative performance, clients rebalanced in order to meet asset allocation targets.”
- Having clients withdraw money during a rising market is disappointing for any fund manager (and their shareholders).
- The chief exec also said:
“In the 2020 Annual Report & Accounts, I highlighted that we expected future outflows from the CLIM Frontier strategy post financial year end; these outflows have now occurred, as the strategy lost US$169 million over the six months.”
- A $169m withdrawal looks to be terminal for the Frontier strategy, as the approach has been left with only $14m to manage:
- CLIG’s small REIT fund has been going for two years, and may not attract significant new money until 2024. (CLIG has previously admitted “most institutional investors want to see a five-year return history before investing”).
- Clients at Karpus withdrew $140m following the merger — perhaps not the early customer reaction CLIG’s management had expected. Management claimed on the webinar the Karpus withdrawals reflected “legacy” pension funds closing down.
- CLIG reckons new client money of $385m can be obtained during the 18 months to June 2022:
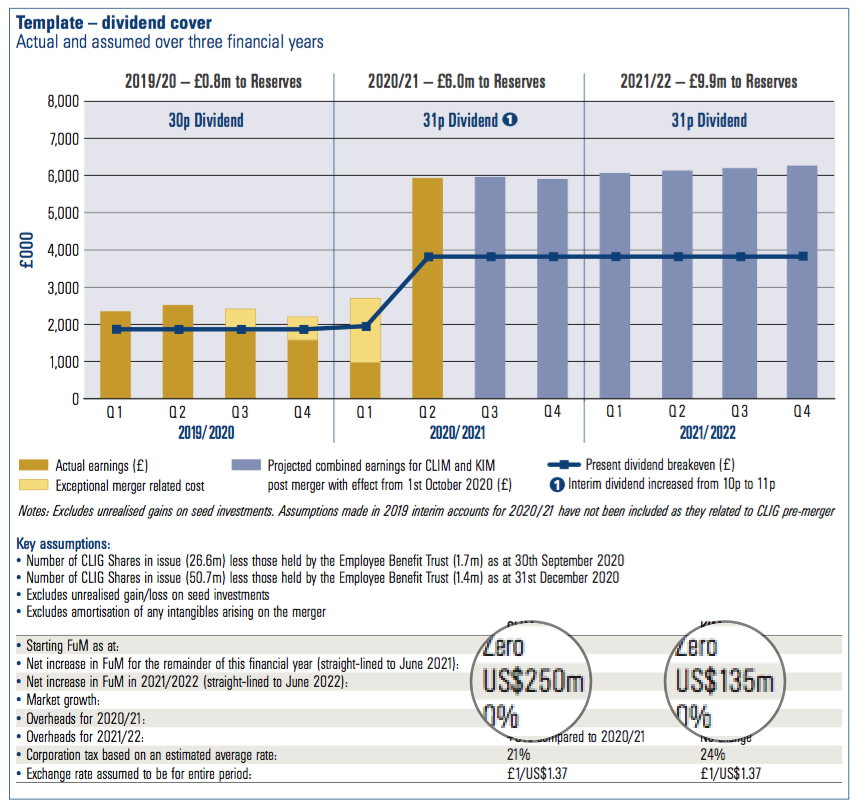
- An extra $385m is equivalent to only 3.5% on current FuM of $10.9b.
- The extra $250m for CLIM suggests:
- New EM money remains difficult to attract, and/or;
- New non-EM money remains relatively small.
- The extra $135m expected for Karpus does not cover the $140m withdrawn following the merger.
- For a longer-term perspective, combined FuM at CLIM and Karpus has grown from $6.2b to $10.9b since 2010 — equivalent to an average annual growth rate of 5.5%:
FuM fee rates
- The fee rate CLIM collects as a proportion of FuM continues to decline.
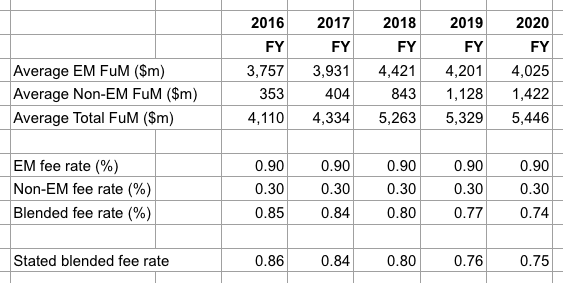
- The proportion was 74 basis points (0.74%) durning this H1, versus 75 basis points for H1 2020, 77 basis points for H1 2018 and 85 basis points for H1 2016.
- CLIG claims the fee-rate collapse since 2016 has been due to the group’s greater proportion of non-EM funds, which levy lower charges.
- CLIG has never disclosed the exact fee rates charged on its EM and non-EM funds.
- However, my past algebra suggests EM fees are applied at 90 basis points and non-EM fees are applied at 30 basis points to arrive somewhere close to the overall fee rates CLIG has declared:
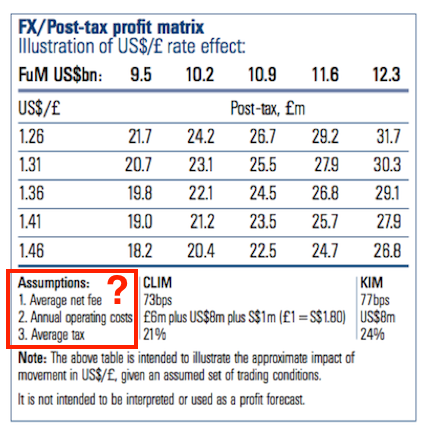
- The declining fee-rate trend looks set to continue. These H1 results provided a revised FuM/exchange-rate table that indicated CLIM’s fee rate was now 73 basis points:
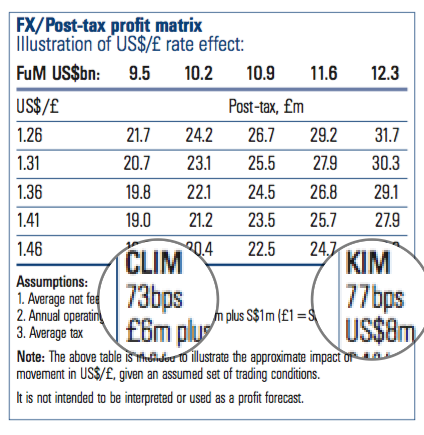
- The fee rate at Karpus has dropped lower, too.
- The merger document (point 5) claimed Karpus enjoyed a “fairly stable” rate of 80 basis points.
- The revised FuM/exchange-rate table above shows Karpus fees at 77 basis points.
- I asked at CLIG’s 2016 AGM about lifting client fees and subsequently received a letter suggesting such action would lead to withdrawals.
- My questions to management about fee rates were not asked during the results webinar.
Quality UK investment discussion at Quidisq. Visit forum.
Management
- The purchase of Karpus was announced less than six months after CLIG founder Barry Olliff retired from an executive role to become a non-exec. Mr Olliff will leave CLIG following this year’s AGM in October.
- The founder of Karpus, George Karpus, retired to become a CLIG non-exec on the day of the merger.
- I had thought this ‘changing of the guard’ might influence the way CLIG operates.
- So far, nothing dramatic has occurred. Indeed, the information provided to shareholders remains reassuringly comprehensive.
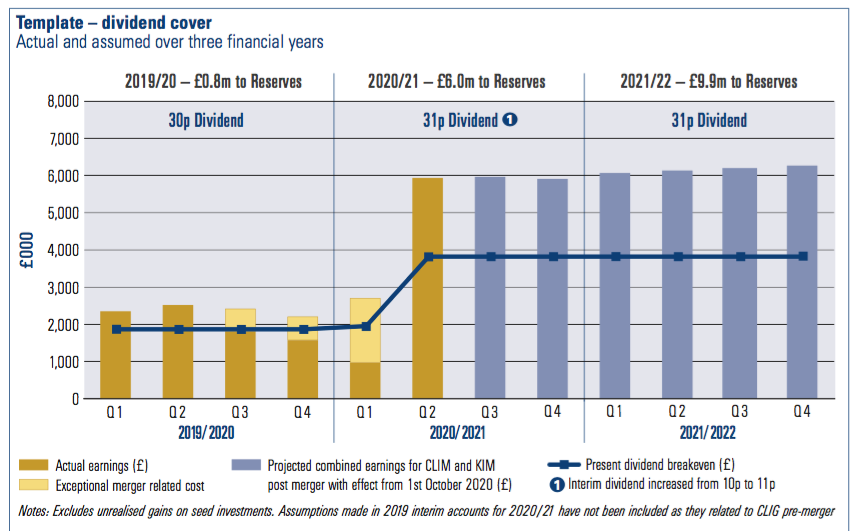
- Of particular note is CLIG’s useful dividend-cover template, which has made a welcome return following its withdrawal during the Karpus transaction due to City takeover rules:
- Furthermore, the aforementioned FuM/exchange-rate table has been updated to include Karpus.
- Similar to past remarks from Mr Olliff, the new-ish chief exec claimed the group’s employees — and their “collegiate culture” — underpin CLIG’s competitive advantage:
“Current events have emphasised the need for companies in the financial service industry to effectively work remotely. While the technology enables robust and secure remote working capabilities across the organisation, the collegiate culture of my CLIG colleagues is the secret sauce that pulls it all together.”
- One change on the cards concerns a KPI. CLIG said:
“Due to the ongoing diversification of the CLIG business away from the original Emerging Markets strategy, the management team at CLIG is reviewing the appropriateness of our second KPI.”
- The KPI in question is “Our share price to double the cumulative return of the M1EF” over rolling five-year periods.
- The M1EF is the MSCI Emerging Market Index and the KPI has not been met:
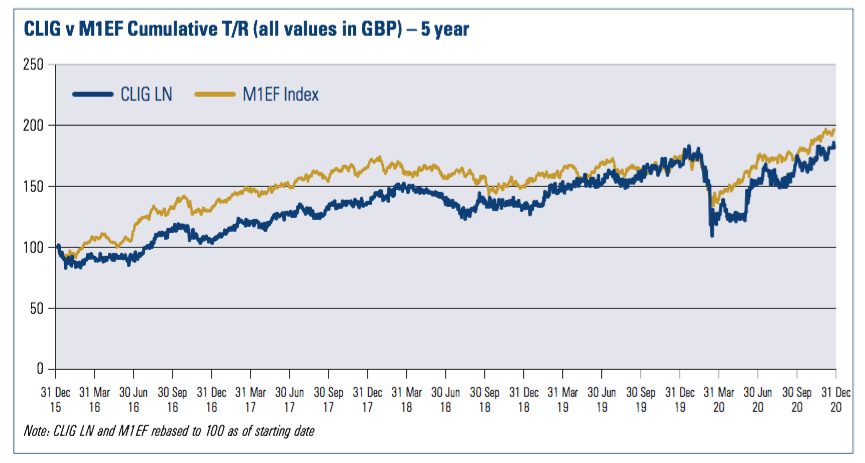
- CLIG’s share price only matching the M1EF is disappointing, and perhaps tells us something about how that lack of new client money (see Fund net flows) impacts the share-price rating (see Valuation).
- The M1EF KPI was introduced only two years ago (point 3).
- CLIG claims a composite of its EM funds has outperformed the M1EF over five years:
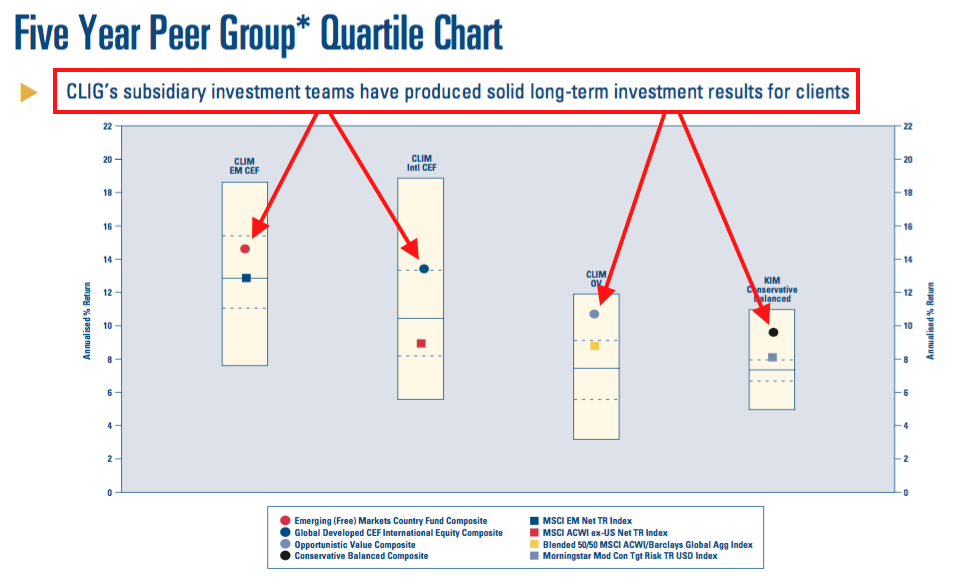
- I remain frustrated how CLIG’s investment outperformances have led to so little new client money. I presume the aforementioned EM “capacity” issue is partly to blame.
- CLIG mentioned Mr Olliff’s intended share sales:
“Subject to being in an open period, Barry Olliff’s, Founder and Director, present intention is to sell 250,000 shares at each of 475p, 500p and 525p. In addition, the Company will no longer provide trading intentions for Mr. Olliff post 30th June 2021, which is the Company’s year-end.”
- Mr Olliff was previously set to sell at 475p and 500p only. The introduction of a 525p sale ‘target’ was first declared within the earlier Q2 update when the shares traded at 470p.
- The share price first closed above 500p on 8 February 2021.
- Mr Olliff sold nearly 600k shares after these results at 504p. He retains almost 1.3 million shares representing less than 3% of the share count.
- CLIG’s largest shareholder is presently George Karpus with a 32%/£83m stake. The merger document (point 3) indicated Mr Karpus could reduce his holding to $10m following a one-year lock-in.
- I would like to think Mr Karpus will have more board involvement than CLIG’s other non-execs, given he has:
- £83m riding on the share price, and;
- 30-plus years experience of running Karpus.
- I trust this thank-you video means Mr Karpus will not want to see his (former) clients treated poorly within CLIG:

Employee Incentive Plan
- CLIG devised an Employee Incentive Plan (EIP) during 2016.
- The performance of the business back in 2016 did not (in my view) suggest the staff deserved an extra incentive scheme.
- But during the subsequent four years (2017 to 2020) — when the staff bonus pool was expanded to cover the EIP — CLIG’s FuM, revenue and profit all gained 30%-plus.
- I am not sure whether the EIP did indeed incentivise employees, or whether broad market movements simply bolstered FuM and therefore earnings.
- I am not surprised the EIP is being extended to Karpus staff:
“Once again, an encouragingly high level of participation in the Employee Incentive Plan (EIP) served to further align the interests of shareholders and employees while access to this Plan will be extended to KIM employees for the first time in the current year.”
- From the current year, the EIP will be included within the original bonus pool of 30% of pre-bonus profit.
- Whether Karpus employees will participate in any form of profit share/bonus pool beyond the EIP was not made clear within the H1 statement or webinar.
- My questions to management about the profit share were not asked on the webinar.
- For reference, the FuM/exchange-rate table within the 2020 annual report mentioned the 30% profit share:
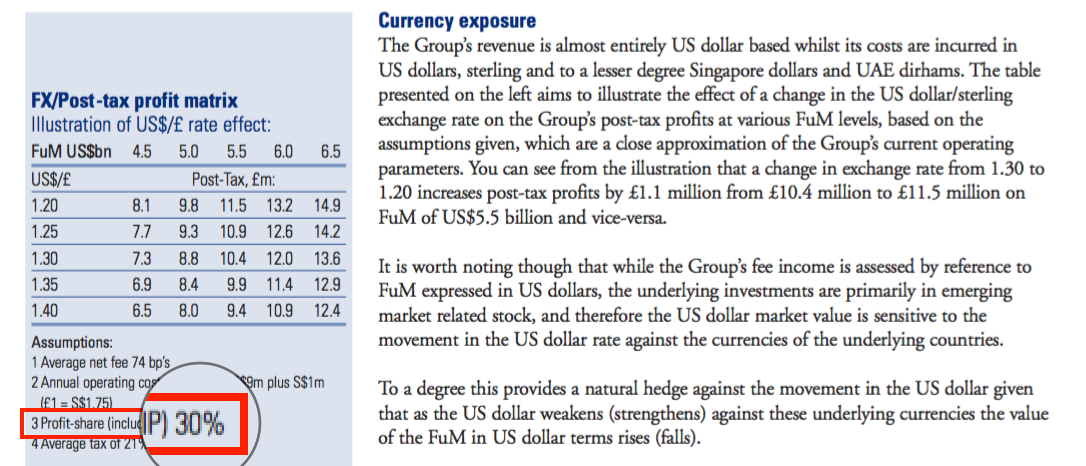
- But theFuM/exchange-rate table within these H1 results did not:
- The results presentation did highlight the profit-share cost:
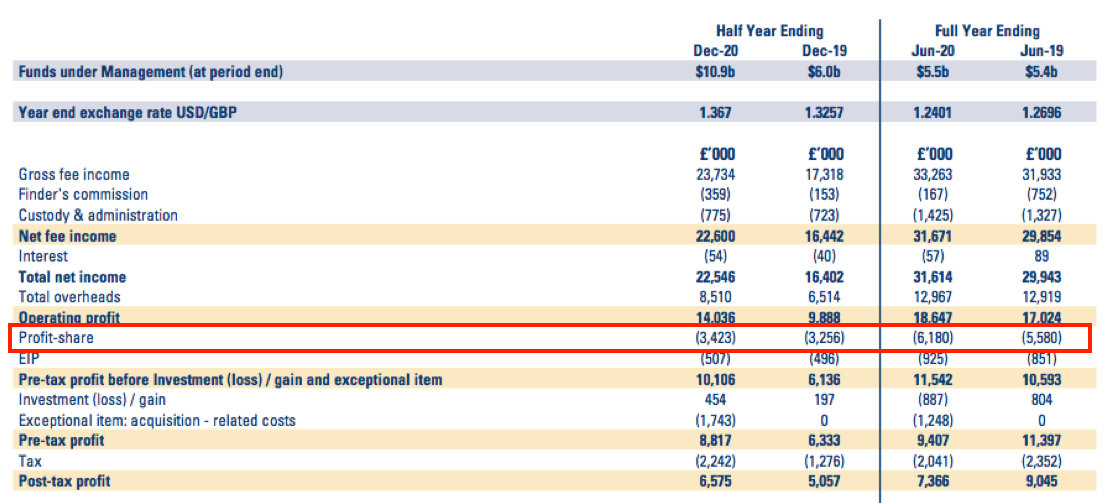
- According to the presentation, profit share as a proportion of pre-profit-share operating profit was 24% for H1 versus 33% for both FY 2019 and FY 2020.
- The 24% suggests Karpus employees do not participate in the 30% bonus pool (or at least not yet).
- But the very high margins at Karpus would certainly be able to fund extra staff costs (see Financials).
- The profit-share figures for FY 2019 and FY 2020 within the H1 presentation differ to those declared within the 2020 annual report:
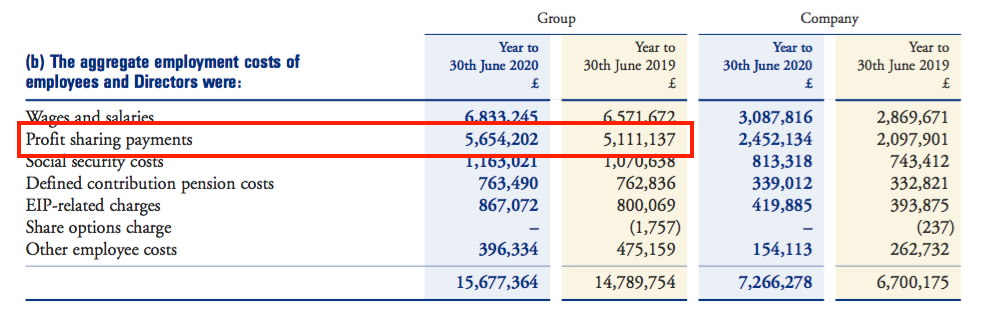
- The figures within the 2020 annual report represent the correct 30% of pre-profit-share operating profit.
Financials
- CLIG’s accounts remain cash-rich and free of conventional bank debt.
- During this H1 the cash position improved by £3.0m to £17.6m, equivalent to 35p per share.
- Operating cash flow of £12.0m minus tax of £1.7m minus Karpus exceptionals of £1.8m minus option/other costs of £0.4m left £8.1m for shareholders, of which £5.0m was paid as the FY 2020 final dividend.
- Other financial assets — mostly listed investments alongside a stake in the firm’s own REIT fund — stood at £4.3m, or 8p per share.
- This company document indicates regulatory capital was £2.1m, or 4p per share, at September 2020.
- The Karpus merger created significant goodwill and intangible assets:
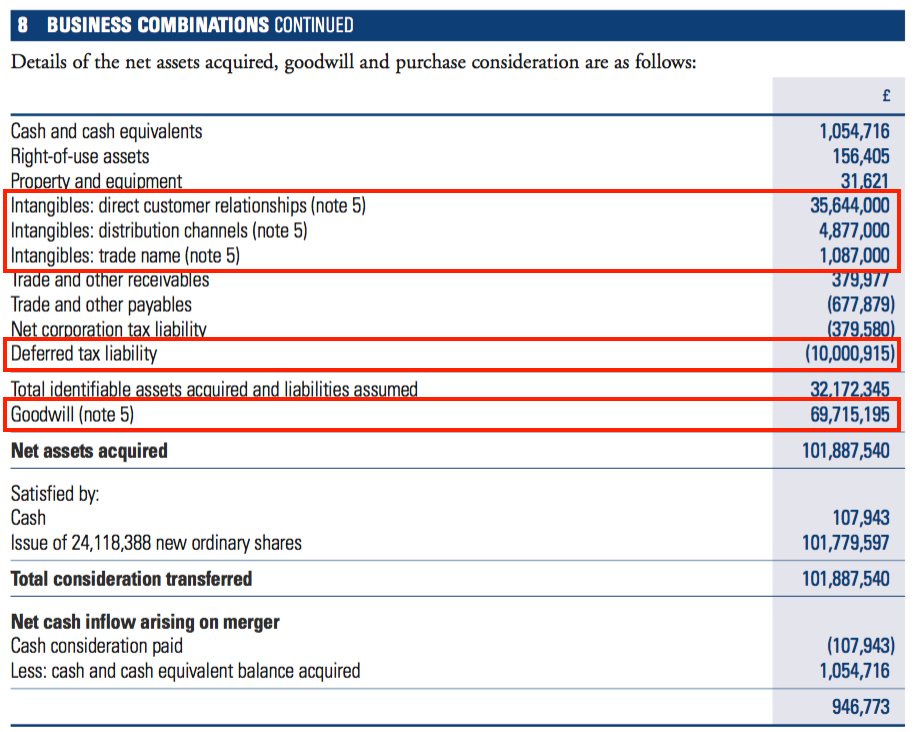
- Total intangibles created came to £41m, which led to a deferred-tax entry of £10m. Balance-sheet ratios that adjust for intangible assets ought to adjust for this deferred tax as well.
- Annualising the amortisation of the acquired ‘customer relationships’ indicates a ten-year useful life — implying Karpus clients will on average be retained for ten years:
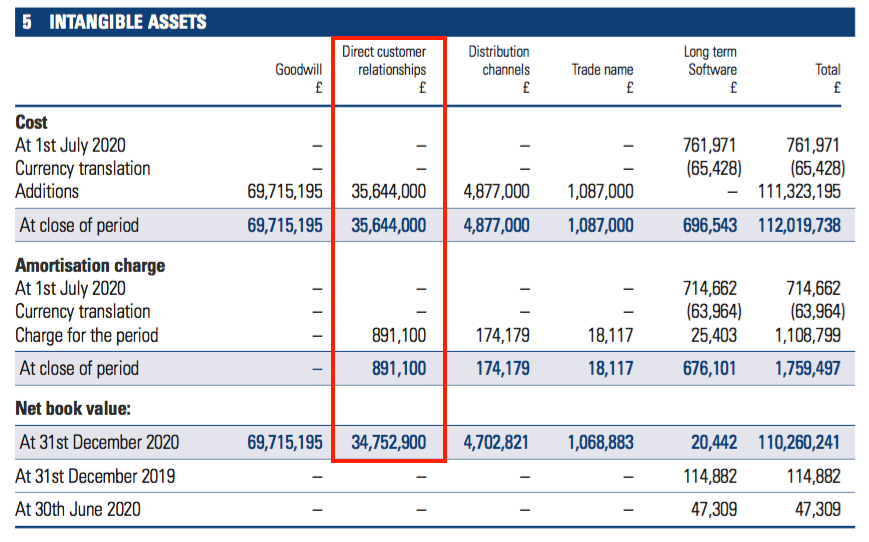
- Karpus was established during 1986 and the merger document (point 5) said nearly 75% of Karpus FuM had been held on behalf of clients for more than five years. A ten-year average client term therefore seems reasonable.
- CLIG’s operating margin has become very attractive following the Karpus merger.
- Excluding the exceptional Karpus costs and the amortisation of acquired intangibles, H1 operating profit of £13.0m represented an astonishing 55% of the H1 £23.7m revenue.
- Karpus is an extremely profitable business. The aforementioned “robust” contribution from the new subsidiary showed pre-tax profit (£3.4m) representing 67% of net fee income (£5.1m).
- CLIG’s accounts remain free of defined-benefit pension obligations.
Reader offer: Claim one month of free SharePad data. Learn more. #ad
Valuation
- CLIG’s revised FuM/exchange-rate table suggests earnings could be running at £24.5m, equivalent to approximately 48p per share:
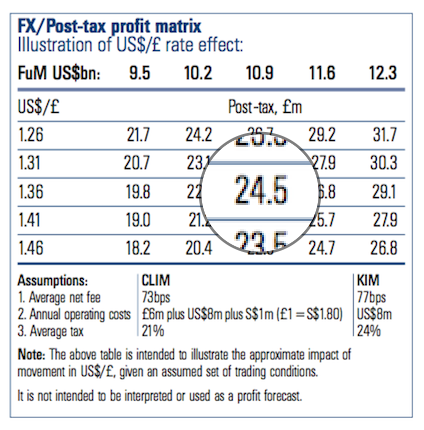
- The £24.5m projection corresponds to the dividend-cover template:
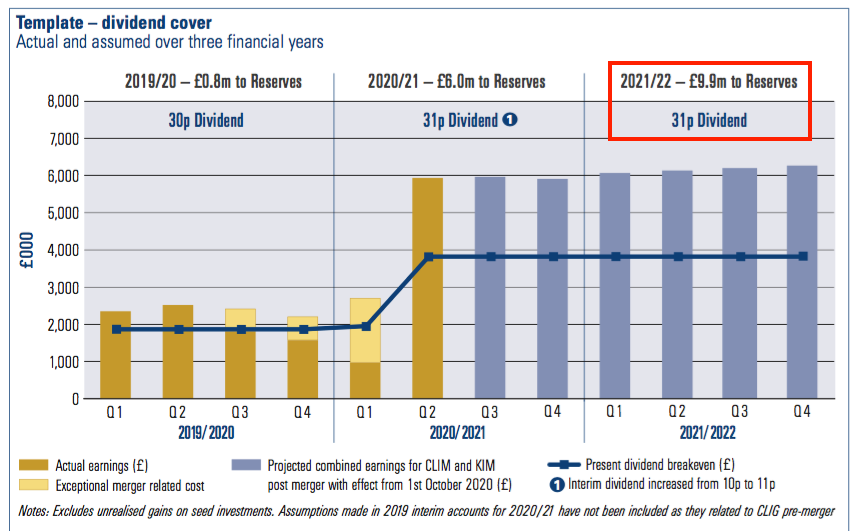
- 49.3m shares (adjusted for Treasury shares) and a 31p per share dividend gives a £15.3m dividend payment. Add on the £9.9m of projected retained earnings then gives possible FY 2022 earnings of £24.2m.
- Applying the FuM/exchange-rate assumptions separately to CLIM FuM of $7.2b and Karpus FuM of $3.7b leads to CLIM earnings of £14.6m, Karpus earnings of £11.5m and combined earnings of £26.1m with GBP buying 1.36 USD.
- I presume the difference between the £24.5m cited in the FuM/exchange-rate table and my £26.1m calculation relates to the uncertain position of the profit share and the EIP.
- The balance sheet has regularly carried a sizeable cash position, which may be needed to reassure clients and/or employees, and might therefore not be surplus to requirements for valuation purposes.
- CLIG declared a £3.4m special dividend two years ago (point 1) when the cash position was £19m, which implies the group likes to keep approximately £16m (or more) in the bank.
- A 520p share price and possible earnings of 48p per share leads to a P/E of 11.
- CLIG’s dividend-cover policy is 1.2x over rolling five-year periods. Cover for the five years to FY 2020 was 1.24x.
- Annual dividend cover of 1.2x with earnings reaching 48p per share implies a payout of 40p per share and a potential 7.7% income at 520p.
- The rating does not look expensive, but CLIG’s trailing P/E has frequently been less than 12 and trailing yield has almost always offered more than 6%:
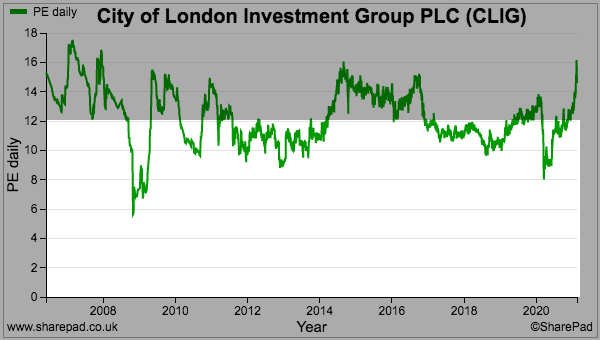
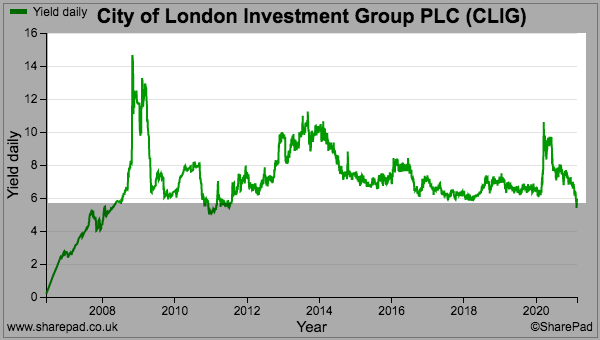
- I believe the shares will continue to trade on a modest rating until the level of new client money improves significantly.
Maynard Paton
PS: You can receive my blog posts through an occasional email newsletter. Click here for details.

City of London Investment (CLIG)
Q3 Funds under Management published 20 April 2021
Nothing of great significance here. Funds under Management (FuM) remain flat as modest market gains counterbalance further client withdrawals.
Here is the full text:
———————————————————————————————————–
City of London (LSE: CLIG), a leading specialist asset management group offering a range of institutional and retail products investing primarily in closed-end funds, announces that on a consolidated basis, as at 31 March 2021, FuM were US$11.1 billion (£8.0 billion). This compares with US$11.0 billion (£8.0 billion) as at 31 December 2020. A breakdown by strategy follows:
Strong investment performance across CLIG’s investment strategies was largely a result of good NAV performance.
During the period under review, CLIG flows were negative as clients continued to rebalance following significant equity market gains, with net outflows of circa US$278 million across the Group’s strategies.
With regard to business development, the Group continues to maintain an active pipeline across all of its major products.
Operations
Despite the ongoing restrictions imposed by the COVID -19 pandemic, important progress has been achieved in harmonising the infrastructure of both operating subsidiaries, CLIM and KIM, in the first two quarters of the post-merger period, particularly in the finance and IT areas.
The Group’s income currently accrues at a weighted average rate of approximately 73 basis points of CLIM’s FuM and at approximately 77 basis points of KIM’s FuM, net of third party commissions. “Fixed” costs are c.£1.6 million per month, and accordingly the run-rate for operating profit, before profit-share is approximately £3.3 million per month based upon current FuM and a US$/£ exchange rate of US$1.3783 to £1 as at 31 March 2021.
Dividend
An interim dividend of 11 pence per share was paid on 19 March 2021. The Board will announce the final dividend on Tuesday 13 July 2021 in its pre-close trading update.
———————————————————————————————————–
I wrote in the blog post above:
“Having clients withdraw money during a rising market is disappointing for any fund manager (and their shareholders).”
That trend continued into Q3, which means CLIG has now seen net client withdrawals for all three quarters of FY 2021. The withdrawals total $651m, of which $147m was from Karpus. I look forward to clients ‘rebalancing’ back into CLIG’s funds when the market turns for the worse.
I calculate the group’s Q3 investment return was 3%, which follows 18% for Q2 and 9% for Q1. So far during FY 2021, investment gains have exceeded withdrawals by a mighty $1,976m — the majority of which occurred during Q2.
I am pleased fee rates have not been trimmed further and remain at 73bps for CLIM and 77bps for Karpus.
With total FuM barely changing, I am not minded to fine tune my valuation sums for now. July’s summary results may finally shed some light on the pay arrangements at Karpus.
Maynard
City of London Investment (CLIG)
PRE-CLOSE TRADING UPDATE for the year to 30 June 2021 published 13 July 2021
No great surprises here. Funds under management improved 3.5% during Q4, with an overall investment return of 4.7% counter-balancing further client withdrawals. The shares at 520p remain priced at 10-11x possible earnings with a 6%-plus yield.
Here is the full text interspersed with my comments:
——————————————————————————————————————
City of London (LSE: CLIG), a leading specialist asset management group offering a range of institutional and retail products investing primarily in closed-end funds (“CEF”), provides a pre-close trading update for its financial year ended 30 June 2021. The numbers that follow are unaudited.
On a consolidated basis, Funds under Management (FuM) were US$11.4 billion (£8.3 billion) at 30 June 2021. This compares with US$5.5 billion (£4.4 billion) at the Group’s year end on 30 June 2020, which was before the merger with Karpus Management Inc. (“KIM”) on 1 October 2020 (the “Completion Date”). A breakdown by strategy follows:
Strong investment performance across CLIG’s investment strategies resulted from strong NAV performance at the underlying closed end funds and positive discount effects.
At year end, both CLIG operating subsidiaries hit all-time FuM highs following the significant equity market gains of recent months and strong relative performance. This was tempered by the high levels of client rebalancing and liquidations, leading to net outflows of circa US$774 million across the Group’s strategies.
With regard to business development, the Group continues to develop an active pipeline across all of its major CEF offerings.
——————————————————————————————————————
Net outflows of $774m for the year indicate Q4 saw client withdrawals of $123m after Qs 1, 2 and 3 witnessed net outflows of $83m, $290m and $278m respectively.
Four consecutive quarters of net outflows is not great and does re-emphasise the main drawback to CLIG — the company finds attracting new client money difficult, and the share price will struggle to be re-rated until significant mandates are won. CLIG cites “high levels of client rebalancing” for the withdrawals, but I am not clear at what point clients will rebalance the other way.
The $774m outflow for 2021 offsets the $338m, $96m and $185m inflows from 2020, 2019 and 2018 respectively. 2017 saw outflows of $272m.
My sums suggest EM funds gained 48% during 2021, with non-EM funds up 45% and Karpus funds up 15% since the 01 October merger. So the investment returns have not been awful. The bulk of the gains were recorded during Q2 (Oct-Dec), when global markets rallied after news of various Covid vaccines.
——————————————————————————————————————
Operations
The Group’s income currently accrues at a weighted average rate of approximately 74 basis points of FuM, net of third party commissions.
The Group’s overheads for the year to 30 June 2021 are expected to be £16.8 million (2020: £13.0 million). “Fixed” costs are c.£1.6 million per month, and accordingly the run-rate for operating profit, before profit-share and amortisation of intangibles is approximately £3.3 million per month based upon current FuM and a US$/£ exchange rate of US$1.3831 to £1 as at 30 June 2021.
For the year to 30 June 2021, the Group estimates that the unaudited profit before amortisation of intangibles, exceptional merger costs and taxation to be approximately £27.2 million, including non-controlling interest (“NCI”) profit of nil (2020: £10.7 million, NCI loss of £0.2 million).
Profits after an anticipated tax charge of £5.3 million (representing 22% of profits before exceptional merger costs and taxation) will be approximately £17.0m (2020: profits of £7.6million after a tax charge of £2.0 million, representing 19% of profits before exceptional merger costs and taxation). Basic and fully diluted earnings per share are expected to be 39.4p and 38.8p respectively (2020: 30.3p and 29.5p).
——————————————————————————————————————
Fees at 74 basis points sounds about right. The Q3 update said the EM/non-EM CLIM funds accrued fees at 73bps while Karpus fees were 77bps. CLIM/Karpus funds ending Q4 at 66%/34% of FuM gives the declared 74bps.
The £3.3m per month run-rate for operating profit, before profit-share and amortisation of intangibles is the same as per the Q3 update.
Adjusted pre-tax profit of £27.2m implies £16m for H2 and a run-rate perhaps of £32m. H1 tax was 21%, so perhaps adjusted earnings (before amortisation/merger costs) are now £25m or c50p per share.
——————————————————————————————————————
Dividend
The Board is proposing to recommend a final dividend of 22p per share (2020: 20p), subject to approval by shareholders at the Company’s Annual General Meeting to be held on 18 October 2021. This would bring the total dividend payment for the year to 33p (2020: 30p). Rolling five-year dividend cover equates to 1.29 times (2020: 1.24 times).
——————————————————————————————————————
The final dividend has been lifted 10% to 22p to match the 10% lift to the H1 payout. CLIG’s policy is to cover the dividend at 1.2x on a rolling five-year basis, so 1.29x suggests a little headroom for possible payout increases were earnings to stagnate.
——————————————————————————————————————
Dividend cover template
Please see dividend cover template attached here.
The dividend cover template shows the quarterly estimated cost of dividend against actual post-tax profits for last year, the current year and the assumed post-tax profit for next financial year based upon specified assumptions.
——————————————————————————————————————
This latest template shows possible 2022 earnings increasing a fraction from CLIG’s half-year template.
49.1m shares (adjusted for Treasury shares) and a 33p per share dividend now lead to a £16.2m dividend payment. Add on the £8.8m of projected retained earnings then gives possible 2022 earnings of £25m. That sum matches the £25m calculated from the pre-tax profit number above, and compares to £24.2m I calculated in the blog post above.
The template continues to show expected new client money of $385m for 2022.
CLIG has also published a City presentation, which does not contain any great revelations.
Maynard