23 March 2021
By Maynard Paton
Results summary for FW Thorpe (TFW):
- “Resilient” figures that showed both profit and dividend up 2% despite the pandemic, Brexit and a factory fire.
- Management’s previously gloomy tone has improved and the second half is now expected to witness a “steady” performance.
- Expectations seem pinned on TFW’s Dutch divisions, where profit gained a remarkable 15% and progress generally within the group has been positive.
- The cash hoard improved further to a record £65m, but the group margin still languishes below the healthy 18%-plus level of the past.
- A P/E of 22-29 feels generous, although might reflect TFW’s operational reliability, opportunities for market-share gains and/or potential growth beyond lighting systems. I continue to hold.
Contents
- Event link, share data and disclosure
- Why I own TFW
- Results summary
- Revenue, profit and dividend
- Thorlux
- Netherlands and Other
- Financials
- Valuation
Event link, share data and disclosure
Event: Interim results for the six months to 31 December 2020 published 18 March 2021
Price: 328p
Shares in issue: 116,551,808
Market capitalisation: £382m
Disclosure: Maynard owns shares in FW Thorpe. This blog post contains SharePad affiliate links.
Why I own TFW
- Manufactures commercial lighting systems with a long-established reputation for high product quality, leading technical innovation and first-class customer service.
- Board led by a veteran executive and assisted by family non-execs who steward a 50%-plus/£191m-plus shareholding.
- Conservative accounts showcase enormous cash reserves, consistent working-capital management and illustrious dividend.
Further reading: My TFW Buy report | All my TFW posts | TFW website
Results summary
Revenue, profit and dividend
- This H1 performance was very acceptable given the pandemic disruption.
- The statement’s highlight was the management outlook, which has improved notably since the preceding FY 2020 update.
- September’s annual results had carried this gloomy warning:
“It seems inevitable, however, that there will be a global recession, and that the UK, against a backdrop of Brexit uncertainly and the intense lockdown enforced by the Government, could be affected worse than many countries.
It is difficult to predict anything other than a downturn in orders at the end of the 2020 calendar year.“
- But the board toned down the pessimism at November’s AGM:
“We plan for the future carefully, but at this present time we remain cautious about the Group’s second-half performance.”
- The chairman then turned optimistic for this H1:
“Supported by the Group’s healthy order book, I foresee a steady second-half performance better than expected at the start of the pandemic.”
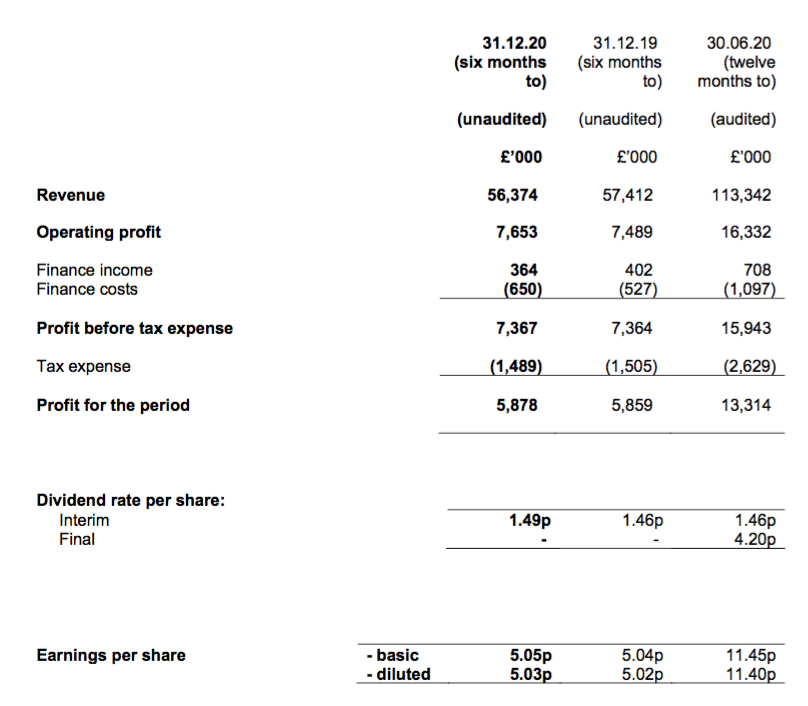
- During this H1, revenue fell 2% while profit gained 2% — a performance TFW described as “resilient“. (The comparable half-year was not influenced by the pandemic.)
- Non-Covid disruptions to this H1 included Brexit “presenting some barriers to export sales” and a fire at the primary manufacturing facility within the Netherlands.
- Despite the “resilient” progress, operating profit remained below the £7.9m H1 level struck during 2018:
| Group | H1 2019 | H2 2019 | H1 2020 | H2 2020 | H1 2021 | ||
| Revenue (£k) | 52,669 | 57,974 | 57,412 | 55,930 | 56,374 | ||
| Operating profit (£k) | 7,019 | 10,630 | 7,489 | 8,843 | 7,653 |
- The lower profit compared to H1 2018 is due in part to the receding LED boom.
- The H1 dividend was raised 2% to match the rate of payout uplifts witnessed during the last two years.
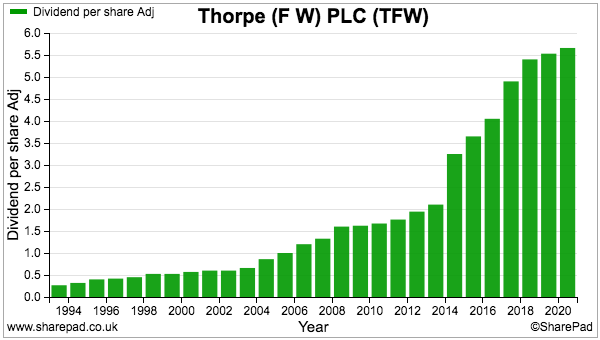
- The dividend lift should extend TFW’s run of consecutive annual payout improvements to 19 years:
Enjoy my blog posts through an occasional email newsletter. Click here for details.
Thorlux
- TFW’s largest division — Thorlux — represents approximately 60% of the group and manufactures a range of commercial lighting equipment:
- Thorlux reported revenue up 3% and profit up 2% for this H1 to underpin the wider company performance:
| Thorlux | H1 2019 | H2 2019 | H1 2020 | H2 2020 | H1 2021 | ||
| Revenue (£k) | 28,442 | 33,862 | 32,363 | 33,252 | 33,470 | ||
| Operating profit (£k) | 4,659 | 6,919 | 4,839 | 5,311 | 4,918 |
- Note that H1 profit at Thorlux was £1m lower than that declared for H1 2018 (due in part to the receding LED boom).
- TFW did not provide any narrative to Thorlux’s H1 performance.
- But the 2020 annual report (point 6) did reveal the division last year enjoyed:
- Good trading within healthcare and rail markets;
- SmartScan revenue climbing 18%;
- Improved overseas sales, particularly in Germany and Ireland, and;
- The appointment of a new managing director.
- Of course these benefits must have been offset by various weaknesses to have left Thorlux’s revenue up just 3% during this H1.
- TFW also said Thorlux’s performance had been supported by “some large project orders“. Such large orders could mean Thorlux’s sales have become ‘lumpy’ and perhaps more unpredictable.
Netherlands and Other
- TFW’s Dutch businesses — Lightronics and Famostar — represent approximately a quarter of the group, while a handful of ‘Other’ UK operations represent approximately an eighth.
- These non-Thorlux subsidiaries collectively produced a mixed performance, with revenue down 9% but profit up 3%:
| Non-Thorlux | H1 2019 | H2 2019 | H1 2020 | H2 2020 | H1 2021 | ||
| Revenue (£k) | 24,227 | 24,112 | 25,049 | 22,678 | 22,904 | ||
| Operating profit (£k) | 2,360 | 3,711 | 2,650 | 3,532 | 2,735 |
- The best performer appeared to be Famostar, given Dutch profit improved 15%…
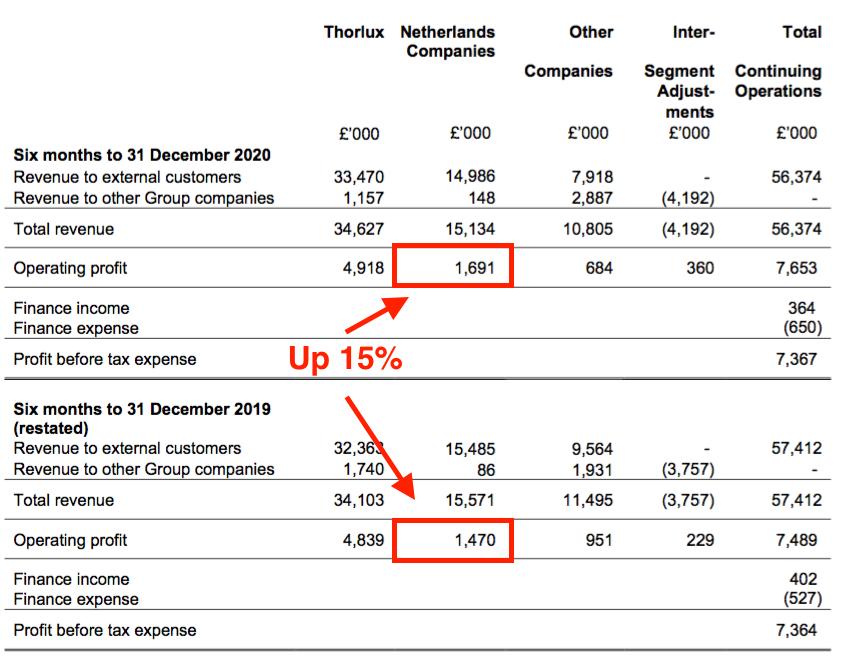
- …and the aforementioned fire halted manufacturing at Lightronics for a few weeks.
- TFW did not explain why Famostar’s emergency exit lighting (apparently) remained so popular during the six months.
- I am surprised a Dutch managing director has not been appointed to the main board (point 14):

- The main board presently includes the managing director of the Philip Payne subsidiary, which has revenue of less than £3m. Dutch sales by comparison run at £31m.
- A Dutch board appointment might be able to assist Thorlux’s sales within the Netherlands, which remain very low (point 9).
- The Dutch businesses seem to have flourished within TFW.
- Prior to TFW taking ownership:
- Lightronics reported revenue of €14m and profit of €1.4m, and;
- Famostar reported revenue of €8m and profit of €1.2m.
- Since then, with GBP:EUR at the average 1.125 seen during 2020:
- Total Dutch revenue has climbed from €22m to €35m, and;
- Total Dutch profit has climbed from €1.6m to €4.6m.
- TFW’s Other divisions predictably suffered a difficult H1, with their aggregate profit diving 28% to less than £700k.
- The Other performance was no doubt influenced by the Portland subsidiary, which manufactures lights for shops and pubs.
- The 2020 annual report (point 7) admitted Portland had lost money during the initial lockdown and had been “in steady decline for a number of years“.
Quality UK investment discussion at Quidisq. Visit forum.
Financials
- TFW has submitted a £3.9m insurance claim following the Lightronics fire:
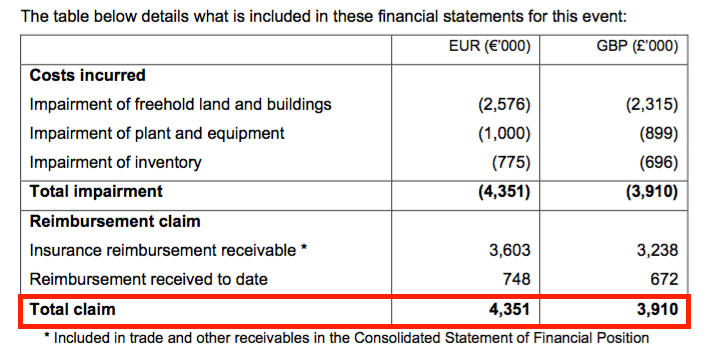
- The cash flow statement contained entries relating to the incident:
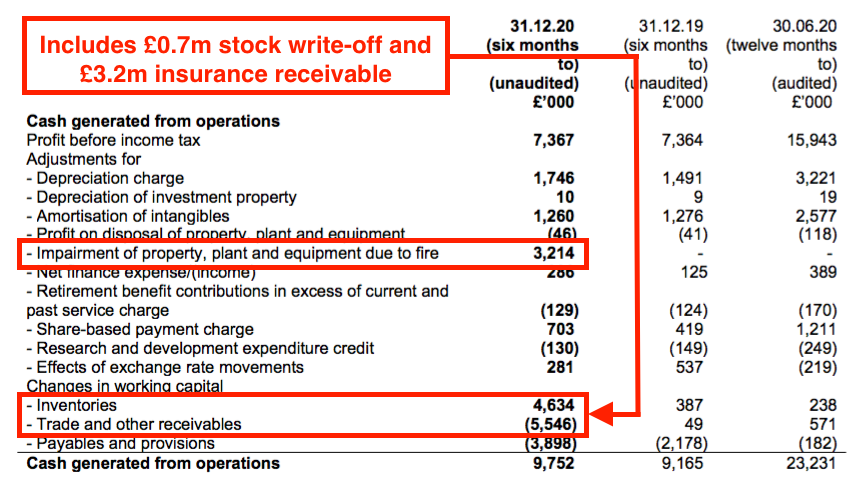
- Assets with a £3.9m book value were written off, while the creation of a £3.2m “reimbursement receivable” explains the receivables cash movement.
- Assuming the insurer pays the full £3.9m claim, the net effect on earnings from the fire ought to be zero — although earnings will not be compensated from the ‘consequential loss’ to Lightronics’ sales.
- TFW’s cash-flush balance sheet allowed the group to handle the fire without any knock-on financial implications:
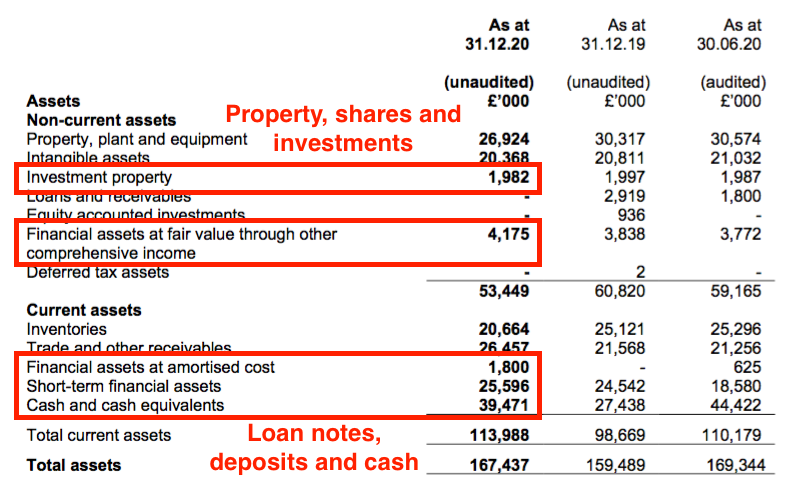
- Cash and term deposits ended the half at a record £65m. Other assets include investment property of £2m, loan notes of close to £2m plus an equity portfolio and associate investment of more than £4m.
- Conventional debt remains at zero.
- Free cash flow of £5.9m plus £1.3m from loan-note/option proceeds funded the £4.9m FY 2020 final dividend and left £2.1m to be added to the cash reserve after currency movements.
- Note the 2020 annual report (point 34) reveals almost £16m is earmarked as deferred considerations for the former owners of Lightronics and Famostar:
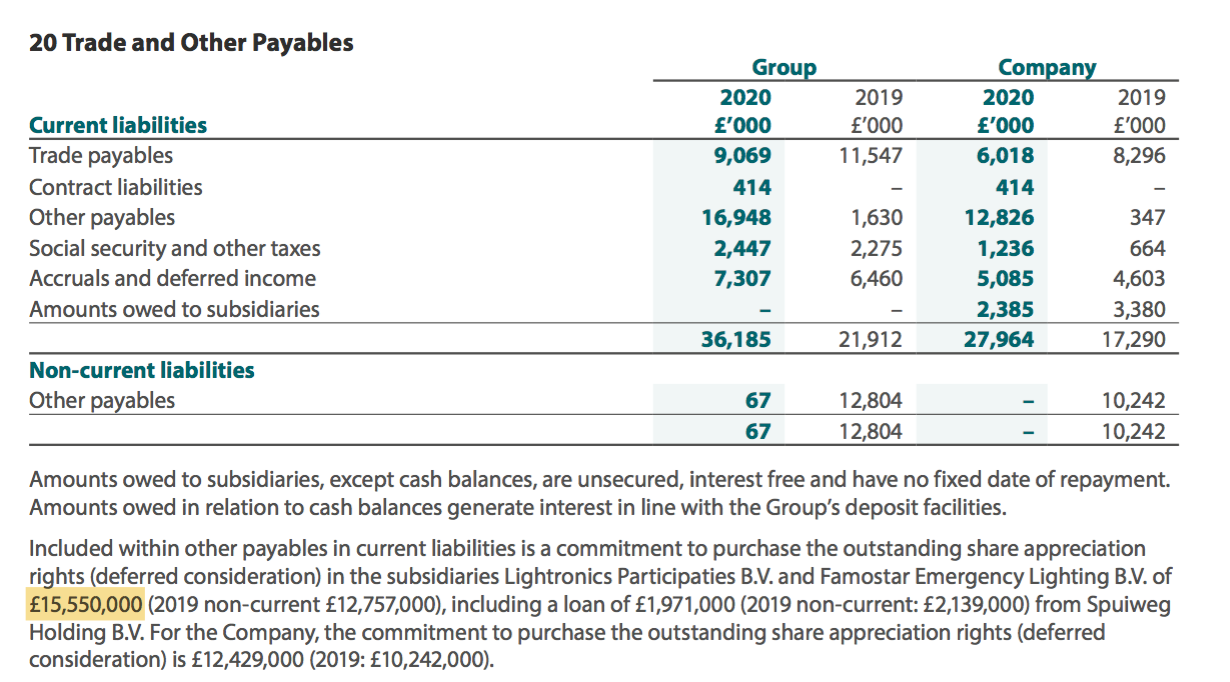
- These deferred considerations are due to be paid on or before 30 June 2021.
- Cash plus the various investments less the deferred considerations come to £57m or 49p per share.
- TFW’s healthy asset position must have reassured customers and suppliers that, during the pandemic, orders would still be delivered, servicing would still be completed and bills would still be paid.
- Perhaps that is why TFW could refer to a “strong order performance” for this H1 and claim a “better than expected” start to the second half.
- The £57m net cash and investments are equivalent to more than four times trailing reported earnings and nearly nine times the trailing dividend.
- The 2020 annual report (point 2) stated “customers come to us for peace of mind“. Maybe the cash hoard is to give shareholders similar “peace of mind“.
- Stock levels at £20.7m were the lowest since FY 2016:
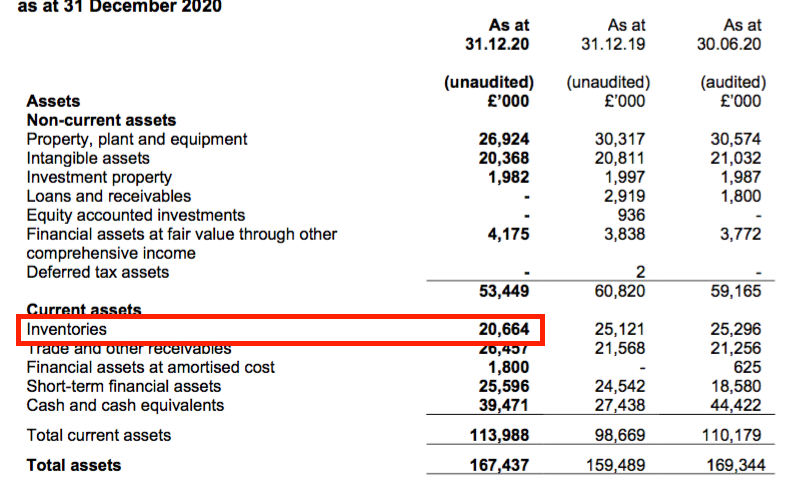
- TFW typically carries stock worth approximately 20% of revenue, but this H1 finished with stock at 18% of revenue — the lowest proportion for at least ten years.
- Whether the reduced stock position reflects a timing issue, greater operational efficiency or something else was not explained.
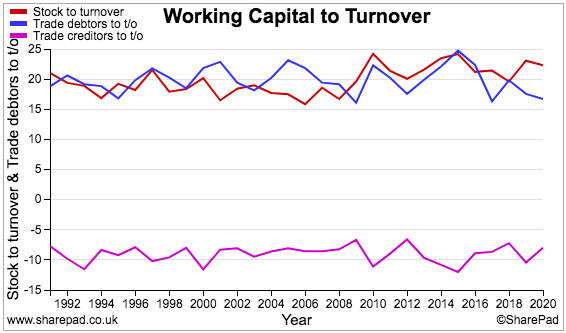
- TFW’s stock, trade debtors and trade creditors as percentages of revenue have been remarkably consistent over time:
- TFW’s operating margin remains reasonable but some way below the levels of yesteryear.
- The group margin for this H1 was 14%, with Thorlux at 15%, the Netherlands at 11% and Other at 9%.
- The group margin during FY 2018 was 18% with Thorlux that year at 21%:
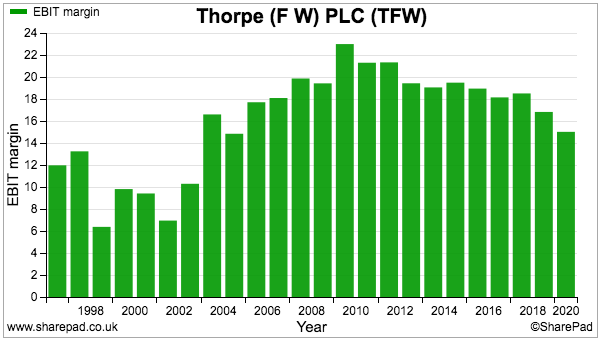
- TFW has in the past cited larger projects for the lower margin. Other explanations (aside from the pandemic and Brexit) may include:
- Greater competition/loss of technical advantages;
- Less profitable LED sales, and;
- Higher SmartScan/new product investment.
Which is best for stock-screening: Stockopedia or SharePad? See my verdict.
Valuation
- TFW’s positive outlook could mean the upcoming H2 2021 performance exceeds the comparable H2 2020 performance.
- H2 2020 covered January to June 2020 and therefore included the initial lockdown period from March 2020.
- Assuming a repeat of the pandemic-affected H2 2020 for H2 2021 gives a £16.5m operating profit for FY 2021.
- But a repeat of the pandemic-free H2 2019 for H2 2021 would instead give an £18.3m operating profit for FY 2021.
- Those projections translate into earnings of 11.5p and 12.7p per share after standard 19% UK tax.
- Subtract the 49p per share net cash and investments from the 328p share price, and the underlying P/E might be 22 or 24.
- The P/Es then rise to 26 and 29 if the cash and investments are in fact essential to the business and not really ‘surplus to requirements’.
- The 22-29x rating appears generous given TFW’s modest progress during recent years.
- Mind you, investors may be willing to apply a premium multiple because of TFW’s:
- Operational resilience displayed during the pandemic;
- Potential to capture market share as competitors “struggle to recover as economies restart” (point 1), and/or;
- Opportunities beyond lighting systems through the fast-growing SmartScan product.
- The 5.69p per share trailing dividend meanwhile provides a modest 1.7% income.
Maynard Paton
PS: You can receive my blog posts through an occasional email newsletter. Click here for details.
