01 January 2021
By Maynard Paton
Happy 2021! I hope you survived last year’s volatile market and you continue to find my blog useful.
A summary of my portfolio’s 2020:
- Total return of 16.9%*;
- Eleven holdings recorded a gain while one holding recorded a loss;
- Returns ranged from Daejan, up 43.5%, to System1, down 9.6%;
- Two shares were topped-up: S&U and System1, and;
- One share was sold entirely: Daejan.
(*Performance calculated using quoted bid prices and includes all dealing costs, withholding taxes, broker-account fees and paid dividends)
I publish a portfolio review after every quarter (Q1, Q2 and Q3), and this post recaps my October/November/December activity and my 2020 performance.
Contents
Disclosure
Maynard owns shares in Andrews Sykes, Bioventix, City of London Investment, Mincon, Mountview Estates, S&U, System1, Tasty, FW Thorpe, Tristel and M Winkworth.
Q4 share trades
I made two share trades during the fourth quarter. I bought more S&U and System1.
S&U
I increased my S&U investment by 20% at £17.20 including all costs.
Half-year figures from the motor-finance specialist were not that bad in the circumstances. The main ‘highlight’ was additional pandemic write-offs representing a manageable 5% of the pre-lockdown loan book. Other positives included collection rates recovering well and the declaration of a dividend (albeit reduced). I calculated the shares might deliver double-digit returns should earnings return to 2019 levels during the next few years. Read more.
System1
I increased my System1 investment by 225% at 173p including all costs.
The advert-testing specialist reported a remarkable turnaround from Q1 loss to Q2 profit within its interim statement. Of major significance was an earlier agreement with ITV, which validated the merits of System1’s unique ad-testing data and appears to have attracted new clients. I felt an estimated P/E of 8 bolstered by substantial net cash provided ample upside opportunities. Read more.
Q4 portfolio news
As usual I have kept watch on all of my holdings. The Q4 developments are summarised below:
- Intriguing higher gross margins at Mountview Estates.
- A remarkable return to profit at System1.
- Predictably awful results from Tasty.
- A satisfactory-given-the-circumstances update from S&U.
- An encouraging Q3 report and dividend reinstatement from Mincon.
- The important re-introduction of the dividend-cover template by City of London Investment.
- A less pessimistic update from FW Thorpe.
- A promising dividend declaration from M Winkworth.
- No significant announcement from Andrews Sykes.
I have written a full review of all the shares I held during 2020 — simply click here for the complete run-down.
Full-year review
I always study my portfolio’s performance at the start of every year.
I am keen to discover where my gains and losses occurred during the previous twelve months, and check whether my portfolio decisions have become consistently good, bad or indifferent.
Enjoy my blog posts through an occasional email newsletter. Click here for details.
2020 performance
The chart below compares my portfolio’s weekly 2020 progress (in green) to that of the FTSE 100 total return index (in blue):
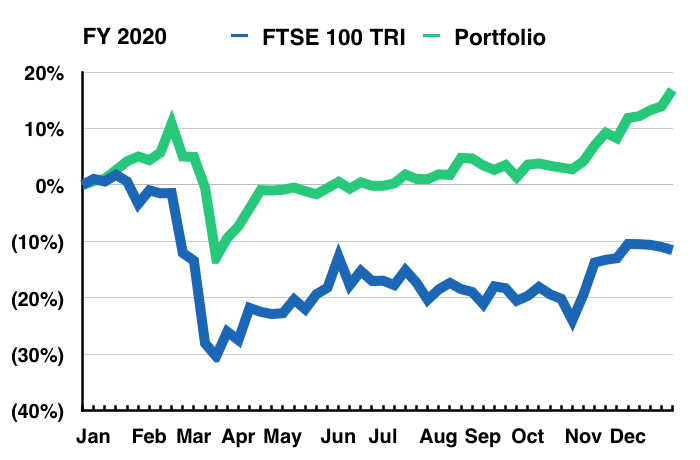
I finished up 16.9% versus an 11.5% loss for my benchmark. My 2020 outperformance was due to:
- Not panic selling: An emergency portfolio review in March helped prevent impetuous exits during the pandemic crash.
- Avoiding major calamities: My portfolio (amazingly) did not suffer a catastrophic profit warning.
- Balance-sheet strength: A preference for cash-rich companies limited dividend reductions and sidestepped rights issues.
- Significant portfolio cash: Assisted by a takeover, my portfolio averaged a 21% cash position during the year.
- Owning a Covid beneficiary: My largest holding fortunately manufactured hospital disinfectants.
I am sure the pandemic will eventually retreat and in turn lead to some notable recoveries within my portfolio.
I am particularly hopeful that Andrews Sykes, S&U, System1, FW Thorpe and M Winkworth can rebound strongly as they capture greater market share from weakened rivals.
In the meantime I am convinced that investing in respectable businesses that offer decent accounts, capable managers and modest valuations remains a sensible long-term approach.
2015-2020 performance
The next chart compares my portfolio’s monthly progress to that of the FTSE 100 total return index. The chart commences at 2015, which coincides with me becoming a full-time-ish investor:
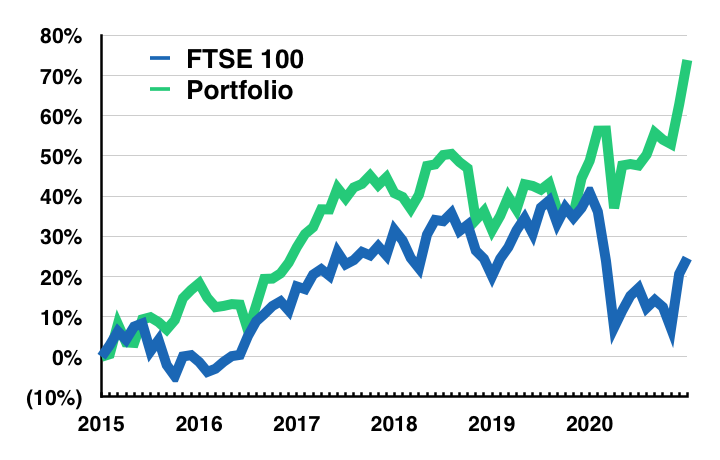
I am pleased I am ahead of the FTSE 100 on this six-year view — up 74% versus up 25%. But I have underperformed the FTSE 100 during three of the last six years (2016, 2017 and 2019):
During this time my gains were curbed by an awful investment in Tasty. My overall compound return between 2016 and 2019 would have doubled from 25% to 50% had it not been for owning (and buying more!) shares in the hapless restaurant chain.
I am optimistic my results for 2021 and beyond will continue to show an improvement.
Investment returns and portfolio contributions
Just to confirm, during 2020:
- I did not buy any new holdings;
- I sold one holding entirely (Daejan (Q1));
- I did not top-slice any holdings, and;
- I left nine holdings untouched (Andrews Sykes, Bioventix, City of London Investment, Mountview Estates, Mincon, FW Thorpe, Tasty, Tristel and M Winkworth).
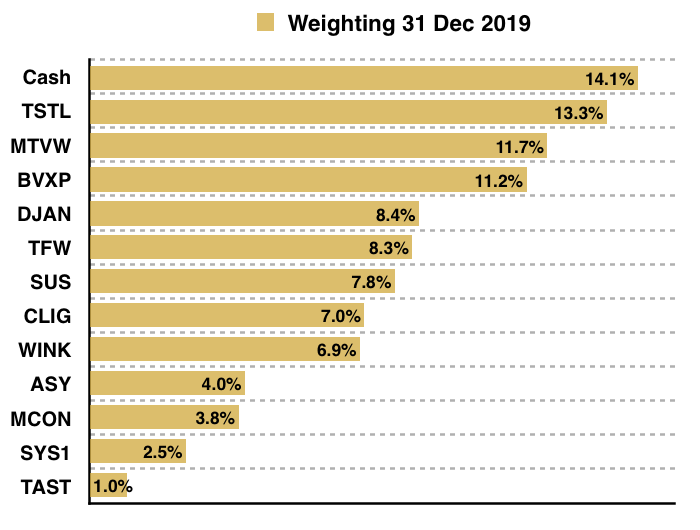
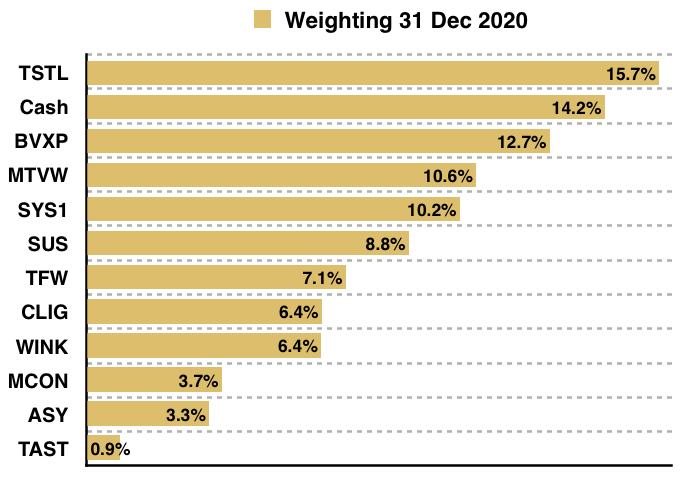
My portfolio started 2020 like this…
…and finished 2020 like this:
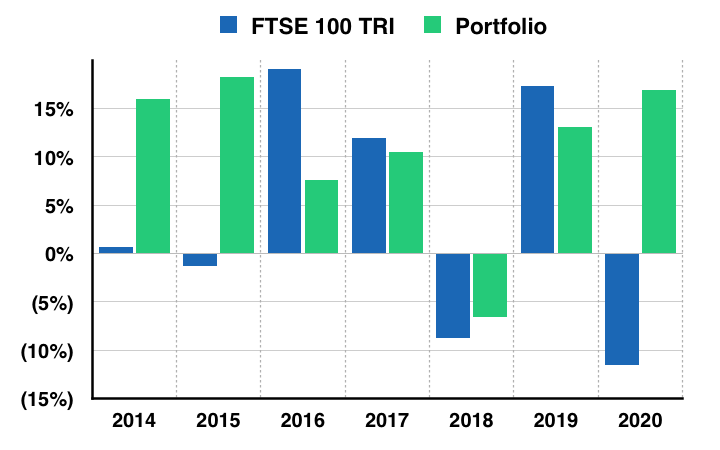
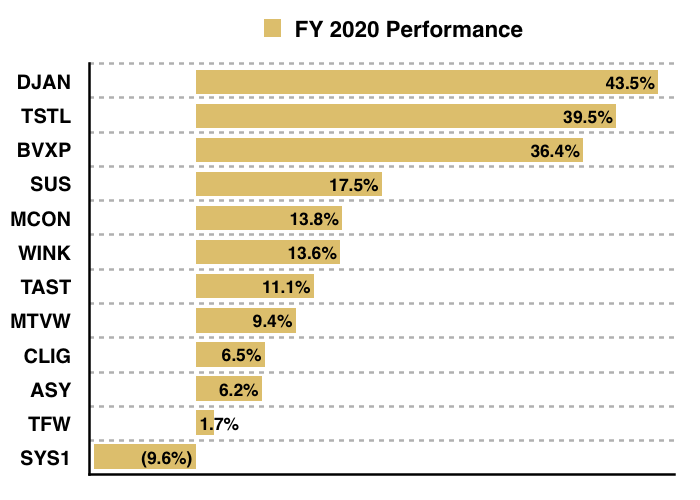
This next chart shows the total return (that is, the capital gain/loss plus dividends received) each holding produced for me during the year:
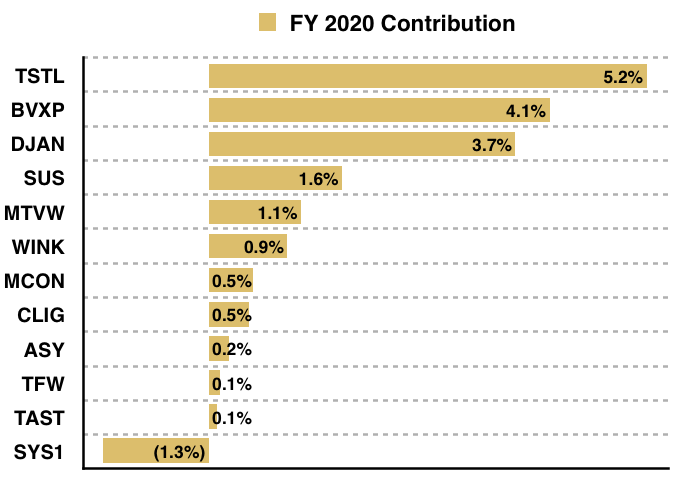
And this chart shows each holding’s contribution towards my overall 16.9% gain:
During an extremely difficult year for many shares, I am very pleased 11 of my 12 holdings recorded a positive total return:
I am stunned every one of my 12 positions outperformed the FTSE 100:
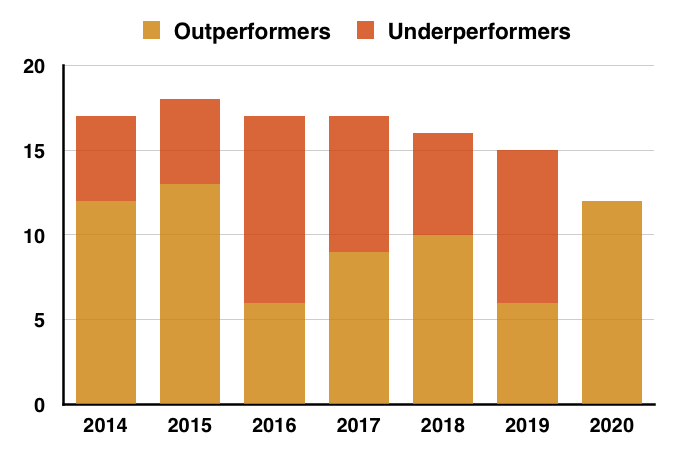
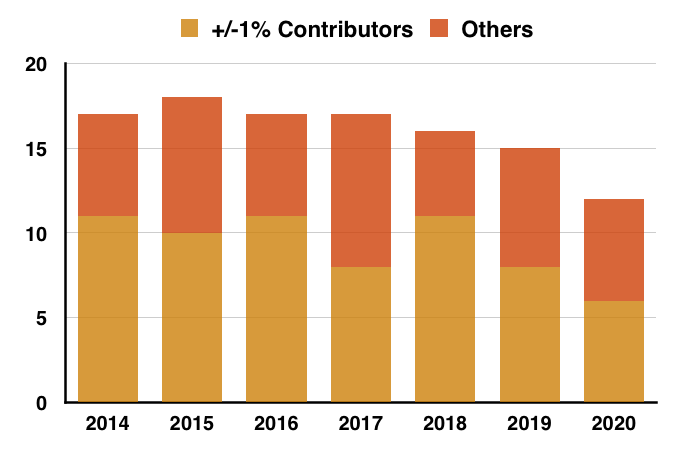
Each year my portfolio tends to exhibit only one or two large winners — and losers! — while most of the other shares do not really add much to the total performance.
For example, 6 of my 12 positions during 2020 contributed total portfolio returns of between -1% and +1%.
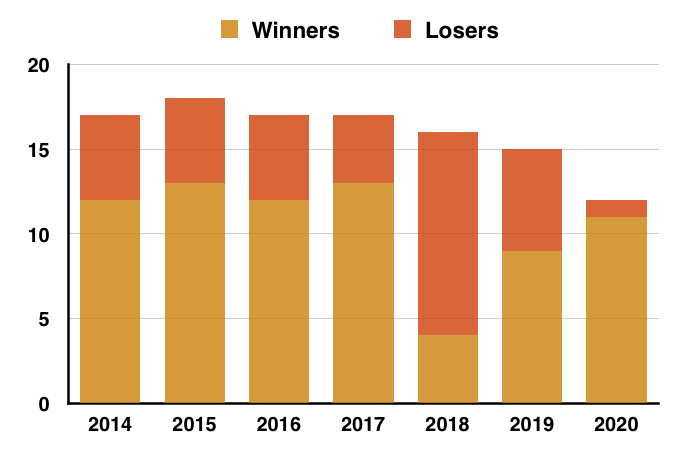
Previous years have also witnessed many of my shares contributing very little to my portfolio’s overall result:
I am hopeful this trend may reverse during 2021 if I can increase the concentration of my portfolio further.
My top five holdings currently represent 58% of my portfolio (2019: 53%) while my bottom five represent 21% (2019: 18%).
The higher concentration ought to give each holding greater influence over my portfolio’s total performance.
Reader offer: Claim one month of free SharePad data. Learn more. #ad
Portfolio turnover, dividends collected and trading costs
Some other stats you may find interesting:
- Portfolio turnover: I can never remember how to calculate this ratio properly. But during 2020 I:
- Sold shares equivalent to 12.5%, and;
- Bought shares equivalent to 12.1% of my portfolio’s year-start value.
- Dividends collected:
- Company payouts represented a so-so 2.90% of my portfolio’s year-start value;
- Portfolio income — including and excluding special dividends — fell 9% due to pandemic-related cuts and suspensions at Mincon, S&U, System1 and M Winkworth.
- Special dividends were received from Andrews Sykes and Bioventix.
- Trading costs:
- Dealing commissions, stamp duty plus account-management fees less interest received represented an aggregate 0.06% of my portfolio’s year-start value.
So here we go into 2021, with my current investments confirmed below:
As usual I have no idea what the market will do in the next twelve months. All I can say is that the FTSE 100 index and FTSE 100 total return index start 2021 at 6,461 and 6,175 respectively.
Until next time, I wish you safe and healthy investing.
Maynard Paton
PS: You can receive my blog posts through an occasional email newsletter. Click here for details.

Hi Maynard – well done on your return for 2020!
I was wondering can you generate any of the charts you show on the bottom half of the page from Sharepad?
I have a Sharepad subscription
Thanks,
John
Hi John,
You should be able to produce the portfolio/FTSE relative performance charts within SharePad. But a spreadsheet gives much more flexibility on the styling. The other charts I am afraid require a spreadsheet. I am not aware of any website/software that can produce such charts automatically. Would be useful if such software exists, as my process is manual and quite fiddly.
Maynard
hi Maynard
Happy New Year to you and many thanks for sharing your thoughts in your annual portfolio review which I found extremely interesting and most helpful.
Judging by your sizeable top up of SYS1 it seems that this is the standout share in your portfolio as regards your hopes for a strong recovery.
I had previously considered opening a position in SYS1 but the two main reasons I have not so far invested were 1) I struggled to really understand the business model and kept wondering if I was simply being duped by impenetrable management speak and 2) Making the mistake of watching the mind numbingly boring ‘Where The Lemons Bloom’ video by an extremely dull Orlado Bloom which appeared designed to drive investors away.
Maybe I need another look with a fresh mind?
Good luck with your portfolio in 2021 and I look forward to reading your future updates.
Kind regards
Peter Broughton
Hi Peter
Yes, I took some time to understand SYS1’s business model and matters were not helped by the growing shift from consultancy work to data work. But the overall concept — that the most effective adverts are those that resonate emotionally with the audience — I did finally twig and appreciate. I made the point about Mr Bloom here and SYS1’s CMO did respond by claiming such videos were not aimed at ad planners/researchers. Anyway, something has happened in Q2 to return this business to profit and whether that turnaround was due to Mr Bloom’s videos or the ITV deal or something else remains unclear for now.
Regards
Maynard
Hi Maynard,
Congratulations on the performance of the portfolio but even more for your presentation. You make it look so easy but that’s where all the hard work pays off.
I am still trying to find buy and hold candidates but each filter throws up candidates with appalling 10 year price profiles or instead has an acquisition history.
Your presentations spur us on – keep at it.
Regards
Colin Farrier
Hi Colin
Thanks for the kind words. In the current market you generally have to pay up for obvious buy and hold candidates. There are probably opportunities among those with poor price profiles, but you have to sift through the haystack to find the occasional possible gem. Tristel for instance had a very ropey headline history some years ago, but underneath did possess some attractive characteristics. I do think Covid may have created similar opportunities but sadly they only look really obvious in hindsight. Will keep at it!
Maynard