30 June 2018
By Maynard Paton
Happy Saturday! I hope you continue to enjoy my Blog… and that your shares have been sizzling higher during the recent hot weather!
My portfolio has been simmering nicely throughout the last three months. In particular, positive second-quarter contributions from Bioventix and Getech have now added to the decent first-quarter efforts of M Winkworth, Mincon and Tristel. However, System1 has sadly joined Tasty as a notable 2018 loser.
It has all meant that, half way through the year, I am up 6.7% versus the FTSE 100 returning 1.7%. I am glad to be in positive territory following a tricky Q1, and I trust I can maintain a gap to the market during the second half.
Recent RNSs from my shares have been broadly positive. Once again there was a mix of statements, ranging from very satisfactory to rather lacklustre, and I am very happy that no major horror stories emerged!
There was one underwhelming update, though, which prompted a disposal and my portfolio’s only Q2 activity. Let me explain what has happened.
How my portfolio has performed
I publish updates at the end of every quarter to explain what has happened within my portfolio, and this Blog post outlines my April/May/June activity. You can click here to read all of my previous round-ups.
The table below lists all of my shares. Alongside each holding is the portfolio’s weighting at the start of the year and at the end of the second quarter.
The table also shows the total return (that is, the capital gain/loss plus dividends received) each holding has produced for me so far during 2018. Each holding’s contribution towards my overall 6.7% gain is disclosed, too:
| Holding | Weighting 01 Jan 2018 (%) | Weighting 29 Jun 2018 (%) | Holding Return (%) | Portfolio Return (%) |
| Andrews Sykes | 3.9 | 3.3 | (5.8) | (0.2) |
| Bioventix | 8.8 | 9.8 | 20.6 | 1.8 |
| Castings | 6.4 | 5.5 | (7.3) | (0.5) |
| City of London Inv | 7.0 | 6.6 | 3.2 | 0.2 |
| Daejan | 6.3 | 5.7 | (3.2) | (0.2) |
| Getech | 2.9 | 4.6 | 65.2 | 1.9 |
| Mincon | 4.3 | 5.3 | 31.6 | 1.4 |
| Mountview Estates | 8.1 | 7.4 | 0.5 | 0.0 |
| Oleeo | 4.4 | 4.6 | 10.0 | 0.4 |
| Record | 6.2 | - | (4.8) | (0.3) |
| S & U | 4.4 | 4.8 | 16.0 | 0.7 |
| System1 | 1.5 | 1.1 | (21.0) | (0.3) |
| Tasty | 6.1 | 6.3 | (22.4) | (1.9) |
| FW Thorpe | 9.1 | 7.9 | (7.8) | (0.7) |
| Tristel | 9.0 | 10.9 | 29.2 | 2.6 |
| M Winkworth | 5.9 | 7.0 | 30.7 | 1.8 |
| Cash | 5.7 | 9.2 | - | - |
| TOTAL | 100.0 | 100.0 | 6.7 |
Frustrated by a lack of new clients and creeping extra costs
My only Q2 activity was selling Record. I disposed of my entire holding at 41.9p including all costs.
As I mentioned in my April company update, I should have sold out of the currency-trading specialist a lot earlier than I did.
I had become frustrated by a lack of new client mandates alongside the extra costs that had crept steadily into the business. I was also tired of RNSs that regularly mentioned lost customers, lower fee rates, so-so investment returns… and “engagement with prospective clients” that never led anywhere.
Similar to many companies operating within the financial-services sector, Record gave the impression it was run more for the benefit of its (well-paid) staff than for ordinary shareholders.
True, Record exhibited some very attractive financials. The operating margin was consistently in excess of 30%, returns on equity were often close to 50%, while cash flow was majestic and sustained a substantial bank balance without debt.
The board’s aim to pay chunky dividends also appealed.
Nonetheless, attractive books and sizeable dividends are always dependent on the underlying business — and Record’s lower-fee/rising-cost trend did not appear that favourable. In fact, the struggle to win new clients suggested the firm’s services were not actually that great.
I bought Record shares between December 2010 and July 2015 at an average of 19.8p, and sold between October 2012 and April 2018 at an average of 31.4p. I collected dividends of 3.1p per share along the way, making a total gain of 75%.
A variety of updates from 12 shares
As usual I have kept watch on all of my existing holdings — trying to seek out buying opportunities just in case.
Here is a summary of the statements issued during Q2:
* Very satisfactory figures from Andrews Sykes and Mincon;
* Acceptable results from Castings, Mountview Estates and S & U;
* A promising-in-the-circumstances update from Getech;
* Lacklustre progress from City of London Investment, Oleeo (formerly World Careers Network) and System1;
* Underwhelming developments at Record;
* A return of capital announcement from M Winkworth;
* The first US regulatory product approval for Tristel;
* Nothing of major significance from Bioventix, Daejan, Tasty and FW Thorpe.
Fingers crossed I can pinpoint a replacement
I was pleased I could continue my watch-list efforts during the quarter. I studied Best of the Best and skimmed over AIREA, Octagonal and Richoux.
Best of the Best looked to be an attractive business. But similar to every other appealing company right now, the valuation seemed to price in a lot of the qualities.
Among the other trio, I must admit bombed-out Richoux was my favourite — although the likelihood of the restaurant group raising further money has since tempered my speculative enthusiasm.
As before, I am keen to maintain my watch-list regime throughout the rest of the year. The current market is hardly conducive to finding quality bargains, but I hope by studying different businesses I can improve my returns over time.
At the moment my cash balance is relatively high at 9% following the aforementioned Record disposal. Fingers crossed I can pinpoint a decent replacement.
I view them as potential timebombs
Last year I used my Q2 and Q3 Portfolio Reviews to evaluate my portfolio on the theme of management.
Today I am continuing to evaluate my shares with some thoughts on company pension deficits. As I have stated in How I Invest:
“c. Low/no pension issues: I view final-salary schemes as potential timebombs. Nobody really knows the exact level of future contributions they require and I prefer to back companies without any ‘employee benefit liabilities’ whatsoever.”
Cash that might otherwise be paid as dividends
Let me start by saying these thoughts are not a definitive analysis of company pensions. Whole books can be written on what is a complex subject, and sadly I am not a company-pension expert.
Nonetheless, judging pension schemes should be important to investors — not least because the schemes can suddenly start absorbing extra cash that might otherwise be paid to shareholders as dividends.
I get the impression many companies trade on lowly ratings because investors worry about the associated pension schemes becoming financial ‘black holes’. You could say these shares are potential ‘value traps’.
Defined-contribution vs. Defined-benefit
Pension schemes fall into two basic categories — defined-contribution and defined-benefit.
Defined-contribution schemes ought to cause no problems for shareholders. Employers (and employees) simply pay into these schemes, and the eventual employee pension then depends on how much was paid in and how well the investments have performed.
Crucially, companies make no promise as to what level of pension will be paid from a defined-contribution scheme.
In contrast, defined-benefit schemes do promise what level of pension will be paid — and so cause all of the headaches for investors.
How much employees receive from their defined-benefit pension is based typically on their salary and length of employment — and may not be commensurate to what was paid in.
As such, defined-benefit schemes can be underfunded if the scheme (in hindsight) promised employees too much… and shareholders can be left to foot the bill.
The annual report will have full details
All companies have to disclose their pension arrangements within their annual reports.
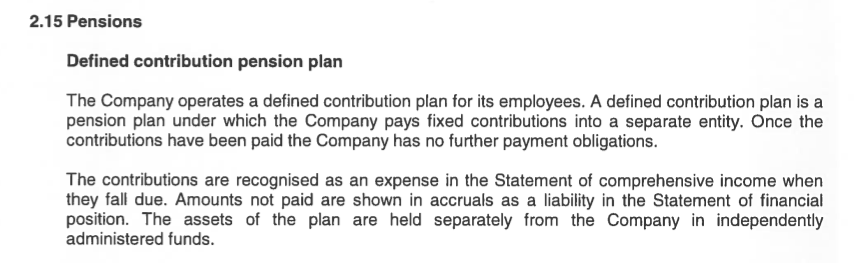
For companies operating only defined-contribution schemes, the disclosure can be as simple as this:
For companies operating defined-benefit schemes, the disclosure will be far more expansive. The annual report should refer to the defined-benefit scheme within the management narrative:
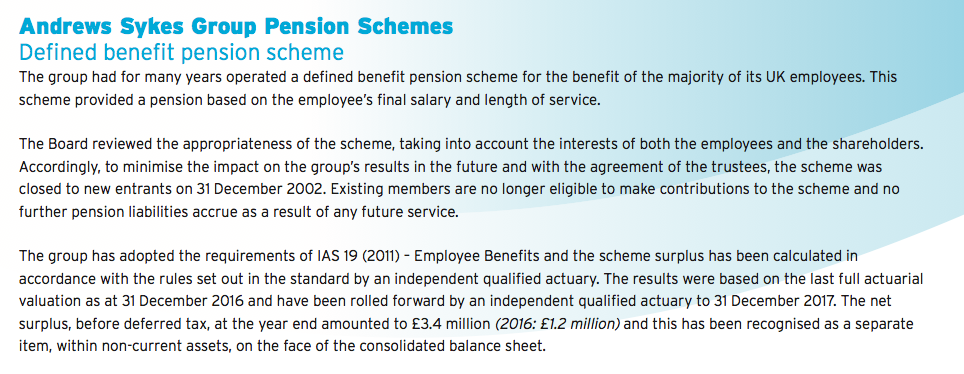
…and there will be a long accounting note detailing the scheme’s funding, movements and calculation assumptions. (Defined-contribution schemes require no such accounting note).
Assets less liabilities gives the surplus or deficit
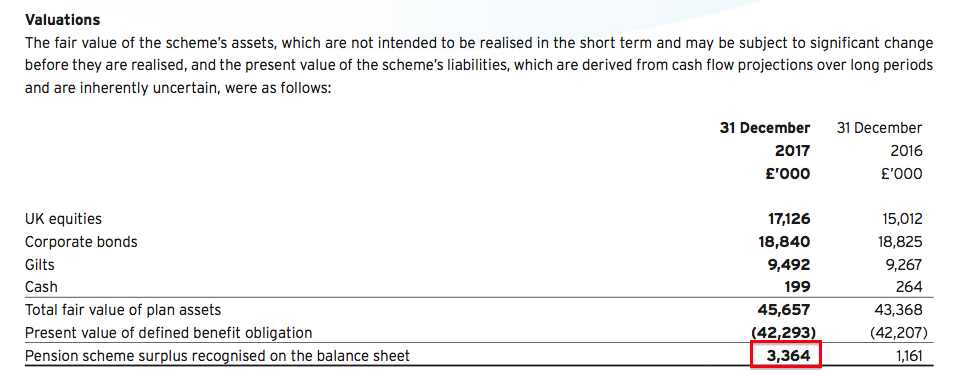
Within the accounting note for a defined-benefit scheme, you will find a summary highlighting the scheme’s assets, liabilities (or obligations) and the resultant surplus or (more likely) deficit.
The summary for Andrews Sykes shows a £3m surplus:
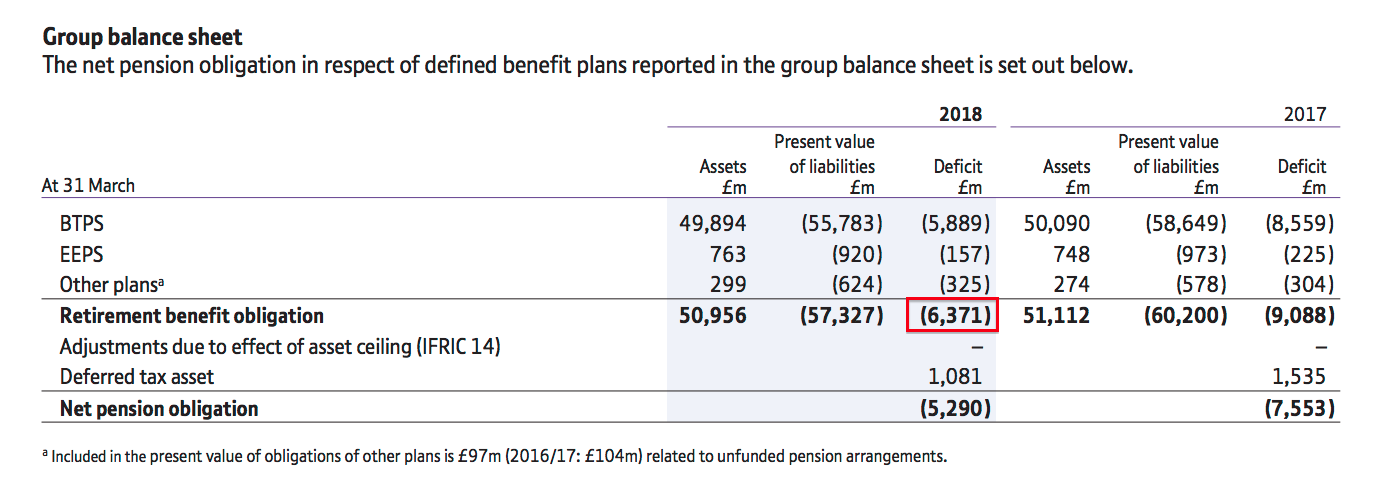
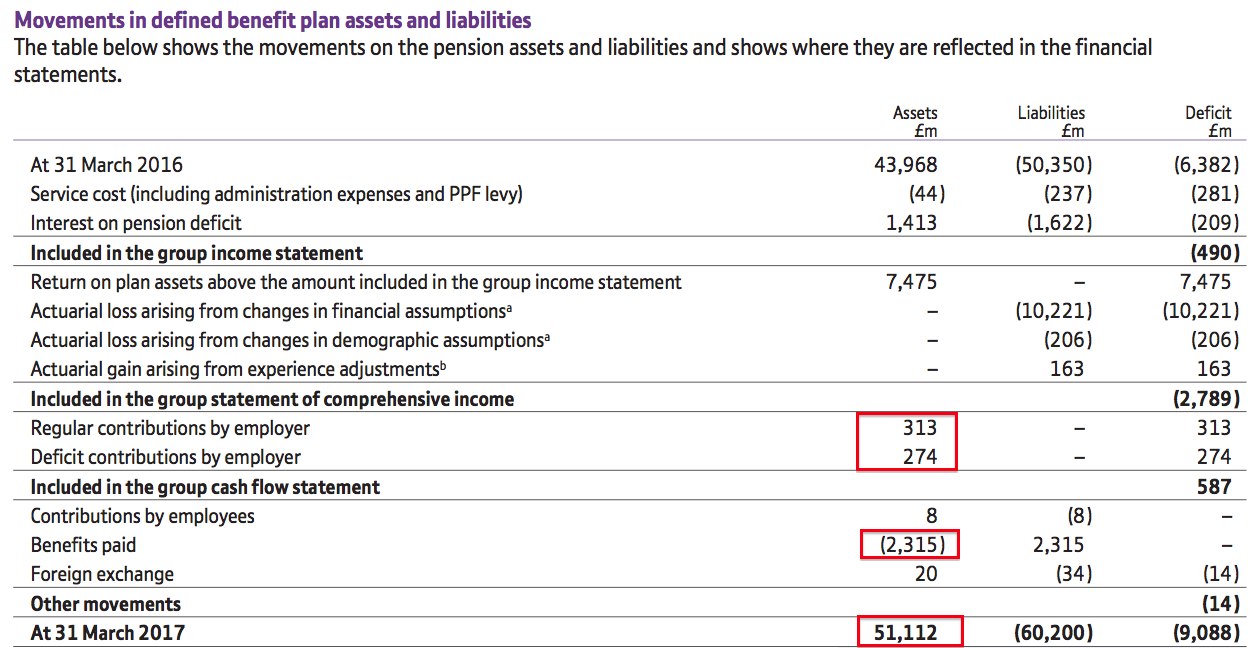
The summary for BT (BT.A) shows a £6,371m deficit:
Understanding scheme assets is simple enough — they reflect the value of the scheme’s various investments at the balance sheet date.
However, scheme liabilities are more convoluted — they reflect the estimated total payments to be made by the pension scheme discounted back to the balance-sheet date.
The liabilities calculation involves all sorts of assumptions about future salaries, inflation, employment tenure and life expectancy — and the assumptions are devised by the board with the help of its advisers.
Unfortunately, a scheme showing a pension surplus is not necessarily ‘funded’ and a scheme showing a deficit is not necessarily ‘underfunded’.
You see, complicating matters further is the fact that the calculated ‘accounting’ liabilities shown in the annual report are not used to determine the level of contributions needed for the scheme.
Instead, a ‘funding’ valuation has to be performed on behalf of the scheme’s trustees every three years, and it is this separate calculation — with the agreement of the company — that sets the necessary contribution level.
The trustees have demanded an extra £5.6b
BT shows what can go wrong with defined-benefit pension promises. BT’s scheme has shown an accounting deficit every year except 2008:
| Year to 31 March | Pension assets (£m) | Pension liabilities (£m) | Pension surplus/(deficit) (£m) |
| 2005 | 29,628 | (34,435) | (4,807) |
| 2006 | 35,640 | (38,187) | (2,547) |
| 2007 | 38,390 | (38,779) | (389) |
| 2008 | 37,448 | (34,669) | 2,779 |
| 2009 | 29,353 | (33,326) | (3,973) |
| 2010 | 35,429 | (49,293) | (7,864) |
| 2011 | 37,222 | (39,052) | (1,830) |
| 2012 | 38,541 | (40,989) | (2,448) |
| 2013 | 41,566 | (47,422) | (5,856) |
| 2014 | 40,113 | (47,135) | (7,022) |
| 2015 | 43,627 | (51,210) | (7,583) |
| 2016 | 43,968 | (50,350) | (6,382) |
| 2017 | 51,112 | (60,200) | (9,088) |
| 2018 | 50,956 | (57,327) | (6,371) |
An announcement in May revealed the group had agreed to pay greater contributions to try and eliminate the deficit.
Essentially BT had been planning to pay £7.6b into the scheme between 2018 and 2030. Now the trustees have asked for £13.2b — an extra £5.6b — of which £2b will be funded by BT taking on extra debt.
BT’s 2018 adjusted operating profit was £4.0b, so paying an additional £400m-plus every year (on average) is significant. For BT shareholders, that £400m is money that could have been distributed as dividends.
Following the revised contribution announcement, it is perhaps no surprise BT’s share price currently trades near a five-year low and the trailing 7%-plus dividend yield hints at a payout cut.
Note, too, that BT’s revised agreement requires the telecom firm to pay even more to the pension scheme if shareholder dividends and/or buybacks reach certain levels. Furthermore, sizeable disposals may also trigger extra scheme payments, while consultation with the trustees is required if significant acquisitions are planned.
I must say, having pension trustees interfering with business decisions can’t be great for BT’s board or investors.
Anyway, here is a sobering chart from BT’s latest annual report:
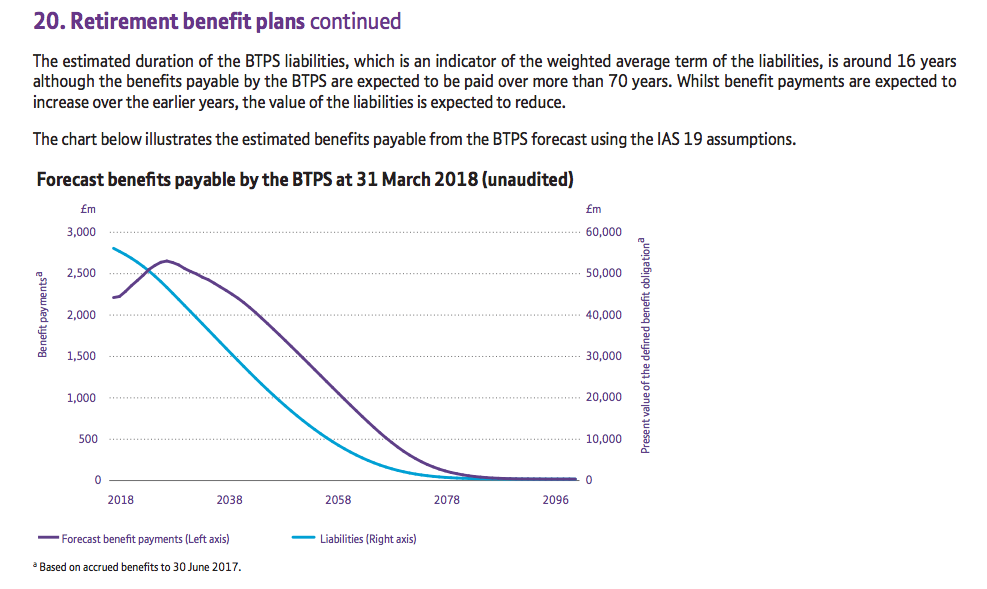
Annual benefits paid to BT’s pensioners are predicted to drop below current levels only from 2038 onwards. Benefits are then expected to be paid until 2090!
An easy rule of thumb
So how can you judge whether a pension scheme is likely to suffer BT-type problems?
I have to admit… I am not sure you can predict exactly if a scheme will become a financial ‘black hole’.
That said, applying some basic checks could help — and if you are in any doubt, it is probably best to stay out.
One easy rule of thumb is to compare a company’s operating profit to the reported accounting deficit. Ideally you would want the operating profit to dwarf the deficit — so if problems do hit the pension scheme, the company’s earnings and dividend ought not to come under great threat.
BT’s pension deficit has regularly exceeded the firm’s operating profit:
| Year to 31 March | 2014 | 2015 | 2016 | 2017 | 2018 |
| Adjusted operating profit (£m) | 3,421 | 3,655 | 3,828 | 4,135 | 3,991 |
| Pension deficit (£m) | (7,022) | (7,583) | (6,382) | (9,088) | (6,371) |
As such, any adverse pension movements — and knock-on trustee decisions — were always going to risk a notable hit to BT’s finances.
I would not blame you if you avoided any company with a sizeable pension deficit — or even any company that operated a defined-benefit scheme — altogether.
I mean, your portfolio would become completely free of worries about complex actuarial calculations and pension trustees trying to snaffle your dividends!
That said, if you — like me — wish to study pension schemes, you might find the following number-crunching useful.
How large a pension pot would I need?
I look at company pension schemes as I would my own pension pot.
Say I need £20k a year to live on during my old age. How large a pension pot would I need?
Annuity rates (at June 2018) for a 65-year-old are approximately 5.6%, or 4.0% with an annual 3% escalation. For a 55-year-old, the level rate is 4.5% and escalation rate is 2.8%.
I might plump for 4%, which requires a £500k pot to give £20k a year.
Of course, annuity rates are guaranteed while the returns from equities — which many company pension schemes hold — are not.
So if my own pension pot holds shares, I might plump for a rate lower than 4% — which would mean a larger pot to start with and more room for manoeuvre should markets slump. For example, I would need a £667k pot if I assumed I could collect 3% a year.
With those rates in mind, evaluating some of the country’s largest pension schemes becomes quite instructive.
I always compare the benefits a pension scheme pays to its members to i) the assets held by the scheme, and; ii) the contributions the scheme receives.
The benefits a scheme currently pays to its members, the contributions paid into the scheme, as well as the assets a scheme holds, can all be found in the relevant pension accounting note.
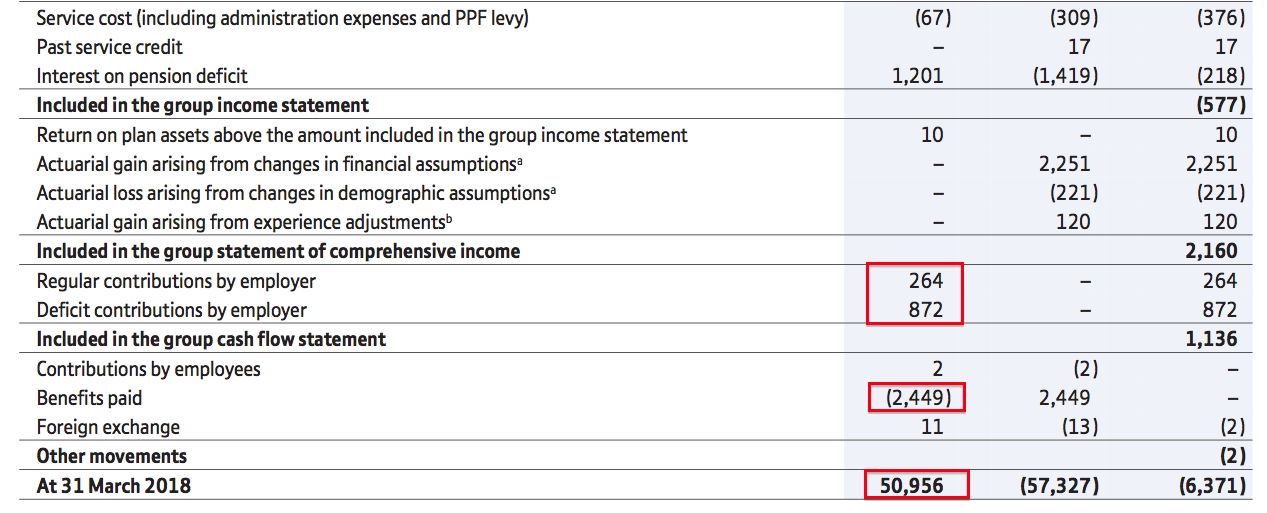
I have highlighted the entries for BT below:
The table below lists 15 blue chips and the effective returns their schemes require to pay the current level of pension benefits:
| Company | Year to | Pension assets (£m) | Pensions benefits (£m) | 'Required return' (%) |
| AstraZeneca | 31 Dec 2017 | 9,922* | 581* | 5.9 |
| BAE | 31 Dec 2017 | 26,991 | 1,303 | 4.8 |
| BP | 31 Dec 2017 | 35,091* | 1,903* | 5.4 |
| British American Tobacco | 31 Dec 2017 | 12,350 | 534 | 4.3 |
| BT | 31 Mar 2018 | 50,956 | 2,449 | 4.8 |
| Centrica | 31 Dec 2017 | 8,451 | 287 | 3.4 |
| Diageo | 30 Jun 2017 | 9,226 | 503 | 5.5 |
| GlaxoSmithKline | 31 Dec 2017 | 18,280 | 881 | 4.8 |
| Imperial Brands | 30 Sep 2017 | 4,732 | 251 | 5.3 |
| National Grid | 31 Mar 2018 | 23,858 | 1,285 | 5.4 |
| Royal Dutch Shell | 31 Dec 2017 | 93,243* | 4,294* | 4.6 |
| J Sainsbury | 31 Mar 2018 | 9,884 | 362 | 3.7 |
| Severn Trent | 31 Mar 2018 | 2,340 | 107 | 4.6 |
| Unilever | 31 Dec 2017 | 22,382** | 1,239** | 5.5 |
| Vodafone | 31 Mar 2018 | 6,697** | 289** | 4.3 |
| Average | 4.8 |
(*US dollars, **Euros)
So for BT, paid benefits of £2,449m from assets of £50,956m lead to a ‘required return’ of 4.8% — coincidentally, the average of those 15 blue chips.
Of course, those 15 companies continue to contribute to their schemes, and so the ‘required return’ figure can be adjusted by subtracting the contribution sum from the benefit paid:
| Company | Pension assets (£m) | Pension benefits (£m) | Pension contributions (£m) | Benefits less contributions (£m) | 'Required return' (%) |
| AstraZeneca | 9,922* | 581* | 157* | 424* | 4.3 |
| BAE | 26,991 | 1,303 | 519 | 784 | 2.9 |
| BP | 35,091* | 1,903* | 509* | 1,394* | 4.0 |
| British American Tobacco | 12,350 | 534 | 254 | 280 | 2.3 |
| BT | 50,956 | 2,449 | 1,136 | 1,313 | 2.6 |
| Centrica | 8,451 | 287 | 236 | 51 | 0.6 |
| Diageo | 9,226 | 503 | 220 | 283 | 3.1 |
| GlaxoSmithKline | 18,280 | 881 | 444 | 437 | 2.4 |
| Imperial Brands | 4,732 | 251 | 140 | 111 | 2.3 |
| National Grid | 23,858 | 1,285 | 475 | 810 | 3.4 |
| Royal Dutch Shell | 93,243* | 4,294* | 1804* | 2,490* | 2.7 |
| J Sainsbury | 9,884 | 362 | 130 | 232 | 2.3 |
| Severn Trent | 2,340 | 107 | 35 | 72 | 3.1 |
| Unilever | 22,382** | 1,239** | 1,105** | 134** | 0.6 |
| Vodafone | 6,697** | 289** | 301** | (12)** | (0.2) |
| Average | 2.6 |
(*US dollars, **Euros)
So for BT, paid benefits of £2,449m less contributions of £1,136m leaves £1,313m to be generated from assets of £50,956m, or a ‘required return’ of 2.6% — coincidentally, again, the average of those 15 blue chips.
The figures for the other companies vary a little, but the 4.8% and 2.6% averages provide good benchmarks for assessing pension schemes in general.
In particular, I would treat any share with a large deficit and much higher ‘required returns’ with some caution. Here is one example.
‘Super-mature’ scheme set to pay benefits until 2070
Norcros (NXR) manufactures showers, sinks and tiles, and sports a £178m market cap at 215p.
The table below summarises its profit and pension-scheme history:
| Year to 31 March | 2014 | 2015 | 2016 | 2017 | 2018 |
| Adjusted operating profit (£m) | 16.1 | 17.0 | 21.3 | 23.8 | 27.4 |
| Pension assets (£m) | 383.8 | 397.0 | 365.9 | 404.4 | 399.6 |
| Pension liabilities (£m) | (405.6) | (441.3) | (421.6) | (467.1) | (447.6) |
| Pension deficit (£m) | (21.8) | (44.3) | (55.7) | (62.7) | (48.0) |
Norcros’ deficit has consistently exceeded its annual profit — not a great sign.
Now look at the level of benefits being paid versus the assets held by the scheme and the contributions being made:
| Year to 31 March | 2014 | 2015 | 2016 | 2017 | 2018 |
| Pension assets (£m) | 383.8 | 397.0 | 365.9 | 404.4 | 399.6 |
| Pension benefits (£m) | 23.6 | 23.1 | 24.1 | 24.2 | 24.0 |
| Pension contributions (£m) | 2.2 | 2.1 | 2.1 | 2.5 | 2.5 |
| 'Required return' (without contributions) (%) | 6.1 | 5.8 | 6.6 | 6.0 | 6.0 |
| 'Required return' (with contributions) (%) | 5.6 | 5.3 | 6.0 | 5.4 | 5.4 |
For some years now, the benefits paid from Norcros’ scheme have represented approximately 6% of the scheme’s assets — somewhat higher than the 4.8% average from those 15 blue chips.
Worse still, Norcros’ £2m contributions appear very small.
All told, it is not clear why Norcros’ scheme can hope for 5%-plus annual returns to cover the benefits being paid (without eroding the scheme’s assets), when those 15 blue chips are seeking an average of 2.4%.
I calculate Norcros would have to contribute an extra £10m a year to its scheme before the ‘required returns’ reduce to somewhere close to the average of those 15 blue chips.
Given Norcros’ underlying operating profit was £27m for 2018, finding an extra £10m could be a tall order. Perhaps that is why the shares trade on a trailing P/E of 7.3.
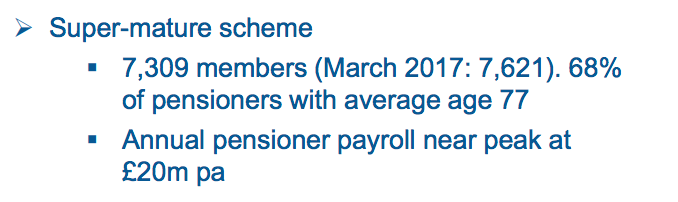
For what it is worth, Norcros claims its scheme is “super mature” with a “pensioner payroll near peak at £20m pa”:
But similar to BT, the projected benefits to be paid to scheme members are sobering:
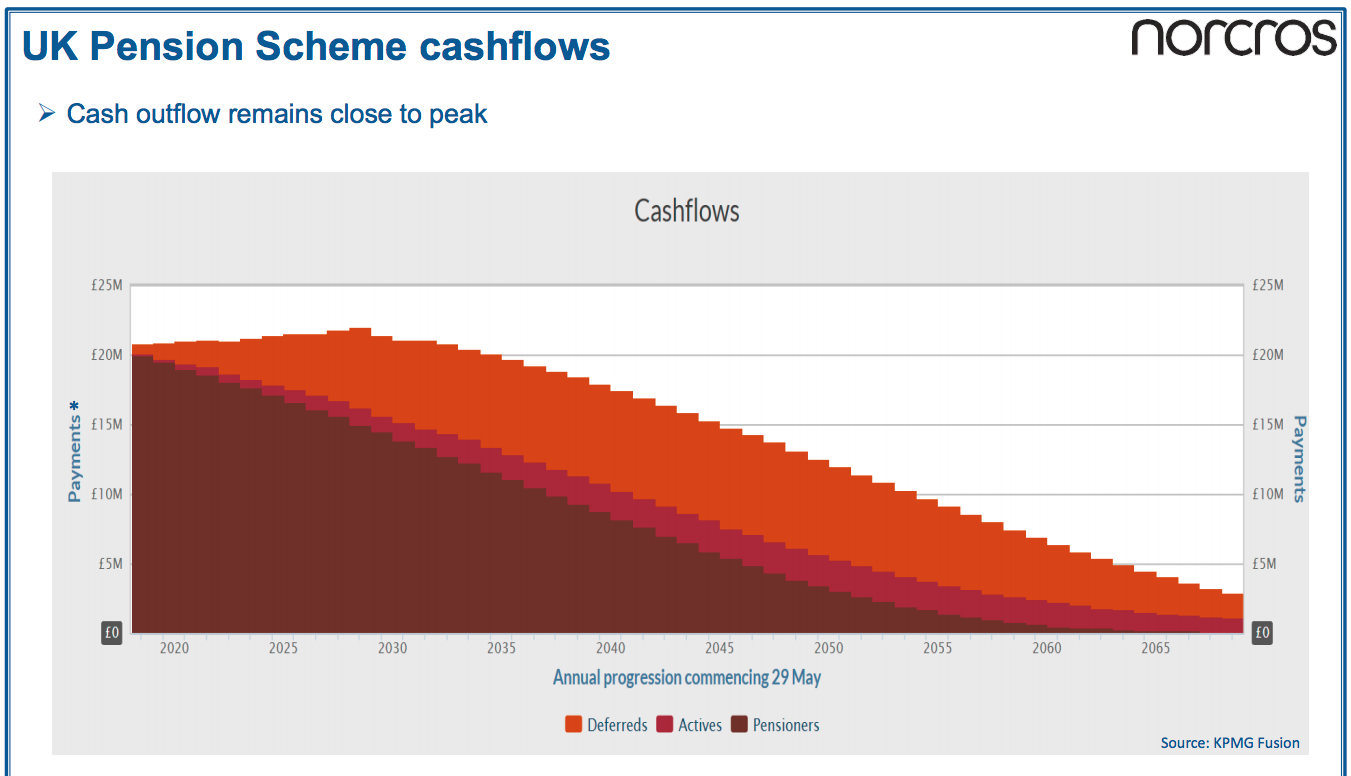
It seems to me Norcros’ pension scheme will pay benefits at or above the current rate for another 14 years — and continue to distribute benefits until beyond 2070.
If Norcros’ scheme is indeed “super mature”, I would hate to think how far the projections of an immature pension scheme might stretch to.
This large deficit looks under control
I should point out that a hefty deficit does not necessarily mean a major funding problem.
Christie (CTG) provides commercial survey, valuation and stock-control services, and carries a £75m market cap at 164p.
The table below summarises its profit and pension-scheme history:
| Year to 31 December | 2013 | 2014 | 2015 | 2016 | 2017 |
| Adjusted operating profit (£k) | 1,567 | 3,706 | 3,869 | 1,141 | 3,678 |
| Pension assets (£k) | 44,304 | 43,636 | 46,148 | 53,324 | 59,406 |
| Pension liabilities (£k) | (49,100) | (57,606) | (58,106) | (71,430) | (73,647) |
| Pension deficit (£k) | (4,796) | (13,970) | (11,958) | (18,106) | (14,241) |
Similar to Norcros, Christie’s deficit has consistently exceeded its annual profit — not a great sign.
Let’s now look at the level of benefits being paid versus the assets held by the scheme and the contributions being made:
| Year to 31 December | 2013 | 2014 | 2015 | 2016 | 2017 |
| Pension assets (£k) | 44,304 | 43,636 | 46,148 | 53,324 | 59,406 |
| Pension benefits (£k) | 820 | 5,038 | 3,352 | 1,627 | 1,563 |
| Pension contributions (£k) | 1,400 | 1,415 | 1,468 | 1,547 | 1,482 |
| 'Required return' (without contributions) (%) | 1.9 | 11.5 | 7.3 | 3.1 | 2.7 |
| 'Required return' (with contributions) (%) | (1.3) | 8.3 | 4.2 | 0.2 | 0.2 |
Benefits paid have been up and down, but right now — at £1.6m — scheme assets of £59m should generate most of that every year.
And when you consider £1.5m is injected into the scheme annually as well, Christie’s scheme does look under control — despite what the ‘accounting’ deficit might suggest.
Christie’s trailing P/E of 17 does not indicate the market is concerned about the deficit.
All four schemes show a pension surplus
So if Christie’s large pension deficit can appear under control, can a pension surplus ever hide substantial problems? Potentially, yes — although I have yet to unearth a possible example.
What I can show you instead are the four companies in my portfolio that operate defined-benefit pension schemes. Amazingly enough, all four schemes presently show a pension surplus:
| Andrews Sykes | Castings | S & U | FW Thorpe | |
| Year to | 31 Dec 2017 | 31 Mar 2017 | 31 Jan 2018 | 30 Jun 2017 |
| Pension assets (£k) | 45,657 | 78,263 | 1,151 | 38,424 |
| Pension liabilities (£k) | (42,293) | (61,419) | (533) | (37,710) |
| Pension surplus (£k) | 3,364 | 16,844 | 618 | 714 |
This next table calculates the ‘required returns’ from the associated scheme assets:
| Andrews Sykes | Castings | S & U | FW Thorpe | |
| Year to | 31 Dec 2017 | 31 Mar 2017 | 31 Jan 2018 | 30 Jun 2017 |
| Operating profit (£k) | 17,589 | 15,548 | 32,978 | 18,422 |
| Pension assets (£k) | 45,657 | 78,263 | 1,151 | 38,424 |
| Pension benefits (£k) | 1,687 | 1,768 | 127 | 1,241 |
| Pension contributions (£k) | 920 | - | - | 1,000 |
| 'Required return' (without contributions) (%) | 3.7 | 2.3 | 11.0 | 3.2 |
| 'Required return' (with contributions) (%) | 1.7 | 2.3 | 11.0 | 0.6 |
S & U’s ‘required returns’ do look alarming — but the scheme is absolutely tiny. S & U reported a 2018 operating profit of £33m, which would easily fund the scheme’s £127k benefits should the scheme’s assets ever hit zero.
Castings does not contribute to its scheme, and I would like to think the required 2.3% average return is achievable over time.
Meanwhile, both Andrews Sykes and FW Thorpe still contribute to their respective schemes and, assuming these payments continue, the current level of benefit payments ought not to cause imminent problems.
I should add that the operating profits of Castings, Andrews Sykes and FW Thorpe are at least eight times the size of their respective scheme’s benefit payments. So if the trustees ever did become restless, the effect on earnings may not be too significant.
I did say this was a complex subject
Phew! Congratulations if you have read down this far.
As you may have gathered, evaluating company pension schemes is not a straightforward exercise — and I would not blame you for completely avoiding shares that carry sizeable deficits.
I certainly consider pension schemes when looking at companies, and purposely avoid any business where there is a chance of a ‘black hole’ developing.
As BT has demonstrated, pension deficits never seem to go away… and trustees can suddenly demand greater contributions to the potential detriment of your dividend.
Oh, and if you think rising interest rates can eliminate pension deficits and the associated long-term funding problems… don’t forget those charts projecting pension benefits still being paid beyond 2070!
Until next time, I wish you happy and profitable investing!
Maynard Paton
PS: You can now receive my Blog posts through an occasional e-mail newsletter. Click here for details.
Disclosure: Maynard owns shares in Andrews Sykes, Bioventix, Castings, City of London Investment, Daejan, Getech, Mincon, Mountview Estates, Oleeo, S & U, System1, Tasty, FW Thorpe, Tristel, and M Winkworth.

Maynard
An excellent examination of the pension scheme morass. Well done and “thank you”!
Thanks Dermot
Interesting as ever Maynard.
For things like this (that are at the limit of my accounting) I subscribe to the ‘being roughly right’ school of thought.
If the figures look big in relation to profits I just move along, there’s plenty of other opportunities. I’m more than happy for people able to do in depth analysis to make a pound on something I’ve deemed too difficult to understand.
Having said that I don’t understand the valuations professionals sometimes give these companies, when they look like basket cases to me, or at least too risky.
For interest we share quite a few holdings, and I sold BT a couple of years ago when I began to look into things in more depth.
Hello Doug
Thanks for the Comment. Yes, I don’t blame you for the ‘roughly right’ attitude with pensions. Life can be too short for such matters. I do like to dig to try and understand these things myself, but that is just me. Agreed, I continue to be amazed at the lack of sophistication among investors as they invest in obvious basket cases — Utilitywise, Globo, various Chinese shares etc.
Maynard