11 July 2023
By Maynard Paton
Happy Tuesday! I trust your shares are faring well during this underwhelming time for the market.
A summary of my portfolio’s progress:
- Q2 return: -0.6%* (FTSE 100: -0.3%).
- Q2 trades: None.
- YTD return: +1.3% (FTSE 100: +3.2%).
- YTD winners/losers: 6 winners vs 5 losers.
(*Performance calculated using quoted bid prices and includes all dealing costs, withholding taxes, broker-account fees, paid dividends and cash interest)
My year-to-date performance has not been fantastic as I look to recover from last year’s 23% drubbing. My portfolio currently requires a 29% advance to revisit its all-time high of December 2021.
Still, company RNSs from my portfolio were very acceptable during Q2. Dividends were held or raised and thankfully no surprise warnings emerged. As always, I am hopeful a mix of respectable competitive positions, capable managers and asset-rich balance sheets will steer my portfolio through whatever the economy has in store.
I had hoped Q2 would witness greater portfolio action. But shareholders of System1 sadly did not appoint a new executive chairman who harboured ambitious plans for a trade-sale exit. At least Tristel (finally!) gained regulatory approval within the United States for one of its disinfectants. Perhaps reflecting the despondent mood of the market, Tristel’s shares are down 7% so far this year!
I have summarised below what happened to my portfolio during April, May and June. (Please click here to read all of my previous quarterly round-ups). I will then help you determine whether (or not!) you are a ‘good investor’.
Contents
Disclosure: Maynard owns shares in Andrews Sykes, Bioventix, City of London Investment, Mincon, Mountview Estates, S&U, System1, Tasty, FW Thorpe, Tristel and M Winkworth.
Q2 share trades
None.
Q2 portfolio news
As usual I have kept watch on all of my holdings. The Q2 developments are summarised below:
- 2022 earnings up 10% and the final dividend up 12% at Andrews Sykes.
- A Q3 update showing lower fee rates and decreased monthly profit at City of London Investment.
- Details of lower-than-expected Q1 mining revenue at Mincon.
- 2022 results showing both NAV and dividends holding steady at Mountview Estates.
- A “strong” Q1 trading performance offset by higher borrowing costs at S & U.
- Proposed board changes not voted through by shareholders at System1.
- United States regulatory product approval at Tristel.
- 2022 profit down 23% but ordinary dividends up 18% at M Winkworth.
- Nothing of major significance from Bioventix, Tasty and FW Thorpe.
Q2 portfolio returns
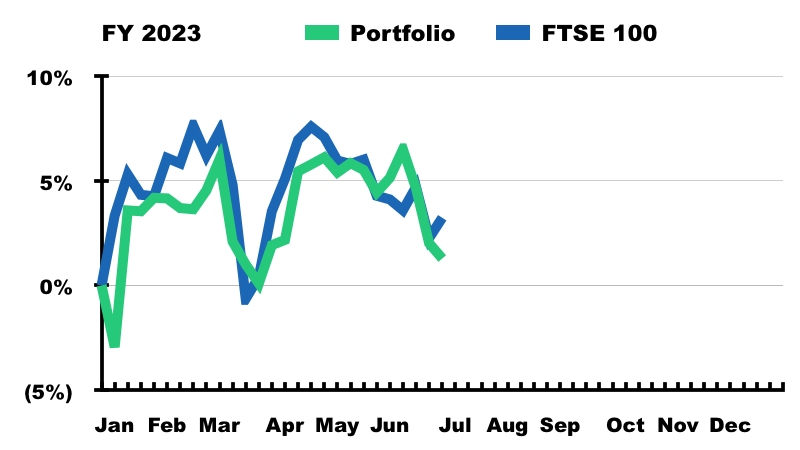
The chart below compares my portfolio’s weekly 2023 progress to that of the FTSE 100 total return index:
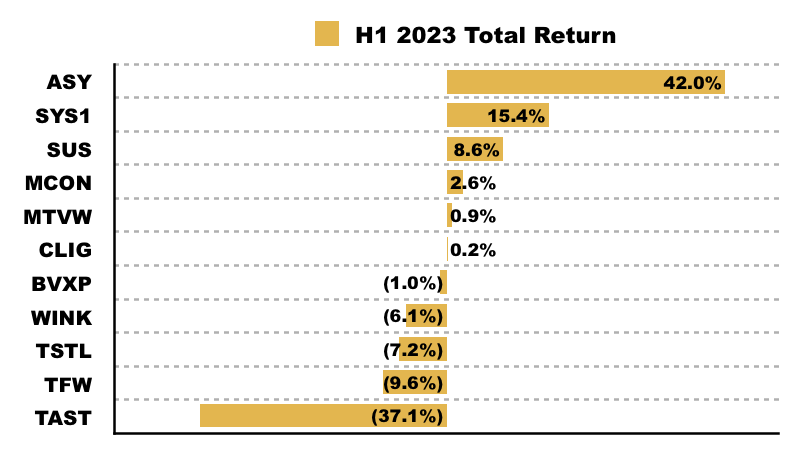
The next chart shows the total return (that is, the capital gain/loss plus dividends received) each holding has produced for me year to date:
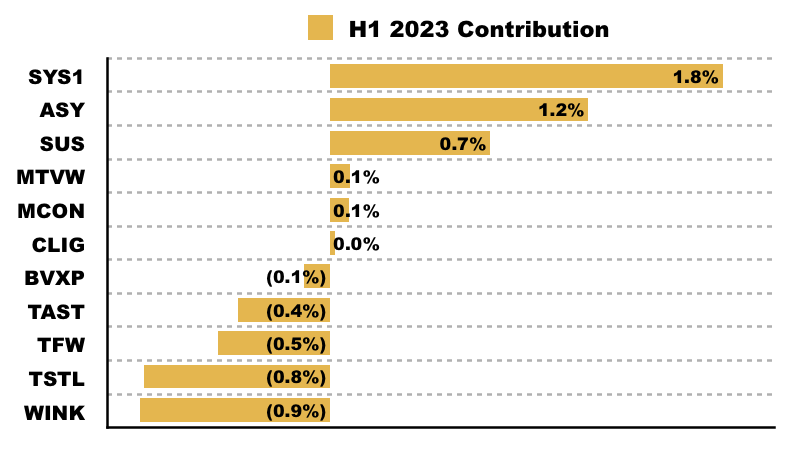
This chart shows each holding’s contribution towards my 1.3% YTD gain:
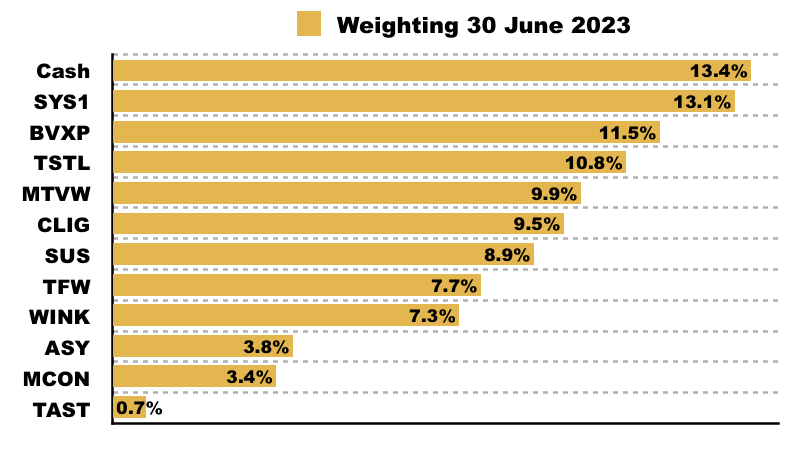
And this chart lists my portfolio weightings at the end of Q2:
Are You A Good Investor?
The chart below compares my portfolio to the FTSE 100 since I commenced this blog at the start of 2015:
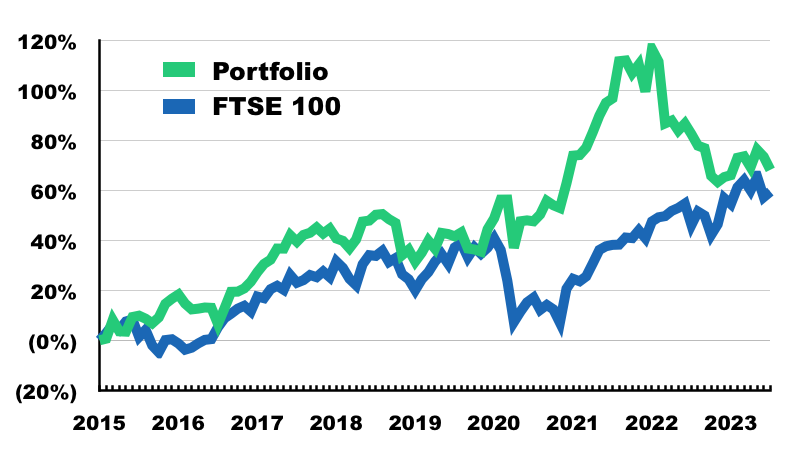
I am up 68% during those 8.5 years, equating to a 6.3% compound average annual return. The FTSE’s gain during the same period is 60%. Do my figures make me a good investor? And more importantly, do your figures make you a good investor?
Choose a real-life benchmark
Judging our investing skills requires a comparison with a benchmark alternative. If our stock picks have lost lots of money while a hands-off index tracker has made lots of money, then we are probably not very good at investing.
Years ago when I was a share tipster, the marketing for my tipsheet required a benchmark comparison to substantiate claims of ‘outperformance’.
The FTSE 100 was chosen because it was main UK index and would therefore prevent regulatory trouble whenever I trumpeted my tips had ‘trounced the market’.
I still use the FTSE 100 today as my investing benchmark and to determine whether I am a ‘good investor’.
Many have asked why I continue to compare my portfolio full of small-caps to the blue-chip index. Surely I should benchmark my progress to a more appropriate index, such as the FTSE Small-Cap or the AIM All-Share?
My reasons are simple:
- I can’t shake off years of share-tipping FTSE 100 comparisons;
- I really ought to beat the ‘dinosaur’ FTSE 100, and;
- I’d probably invest in the FTSE 100 if I were to give up stock-picking*.
That last point is crucial. Where would you invest if you were to give up stock-picking? Would you put the bulk of your money in the small-cap index or an AIM tracker? If not, why then measure your performance against such a benchmark?
As well as the FTSE, real-life hands-off alternatives to individual shares may include a global tracker, a favoured sector ETF, a reliable fund, something like the Vanguard 60:40, or plain cash in the bank.
Such genuine, hands-off alternatives are the proper benchmarks to determine whether (or not!) you really are a good investor… or at least good enough to make your style of investing worthwhile!
(*While I would probably not invest entirely in the FTSE 100 as an alternative to my stock picks, I use only the FTSE 100 as a benchmark for this blog for reasons of simplicity and clarity.)
Market conditions and temporary influences
If our benchmark comparisons do not look great, then we can always claim our sub-par progress is due to ‘market conditions’ and ‘temporary factors’.
For various reasons, the FTSE 100 has proven very resilient since the start of 2022… while the FTSE 250 and Small-Cap indices have fallen approximately 20%:
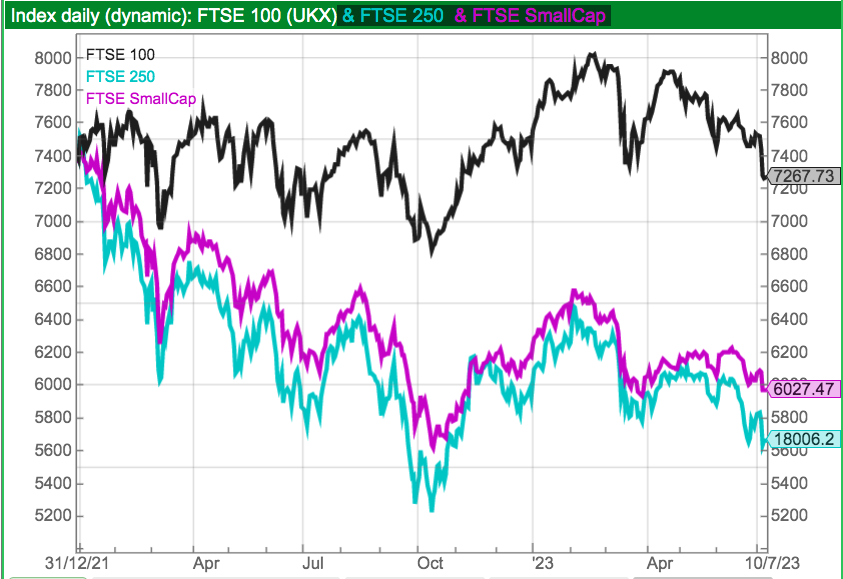
As a small-cap investor, I could excuse my portfolio’s recent underperformance by noting that during the last 18 months:
- 190 of 226 shares (84%) within the Small-Cap index, and;
- 574 of 698 shares (82%) within the AIM All-Share index…
…have declined in value.
Right now seems a very bad time for small-cap stock-pickers to compare themselves against the main blue-chip index (or any index!). Portfolio comparisons are based upon single point-in-time snapshots after all.
A better comparison for me occurred at the end of 2021, when my portfolio was up 116% versus 48% for the FTSE 100 since my blog started:
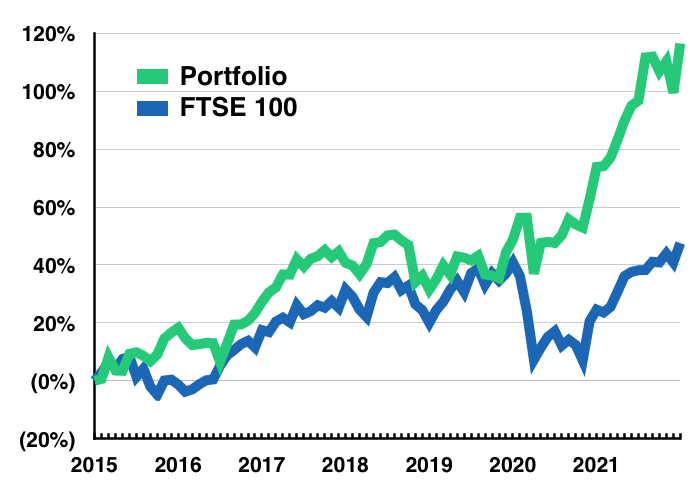
Maybe I was a much better stock-picker 18 months ago then I am now. Or maybe I will become a much better stock-picker during the next 18 months… if small-company shares recover and my portfolio becomes a lot healthier!
Mind you, some will argue a good investor should have switched from small-caps to blue chips at the start of 2022. And that brings us to the subject of hindsight.
The unfairness of hindsight
A frustratingly simple alternative will always be doing better than your portfolio. While the FTSE 100 has been hard to beat during the last 18 months, ‘US tech/quality growth’ was leading the charge for the previous decade or so.
How many times have you asked yourself why you did not put all of your money in Fundsmith or the Nasdaq?
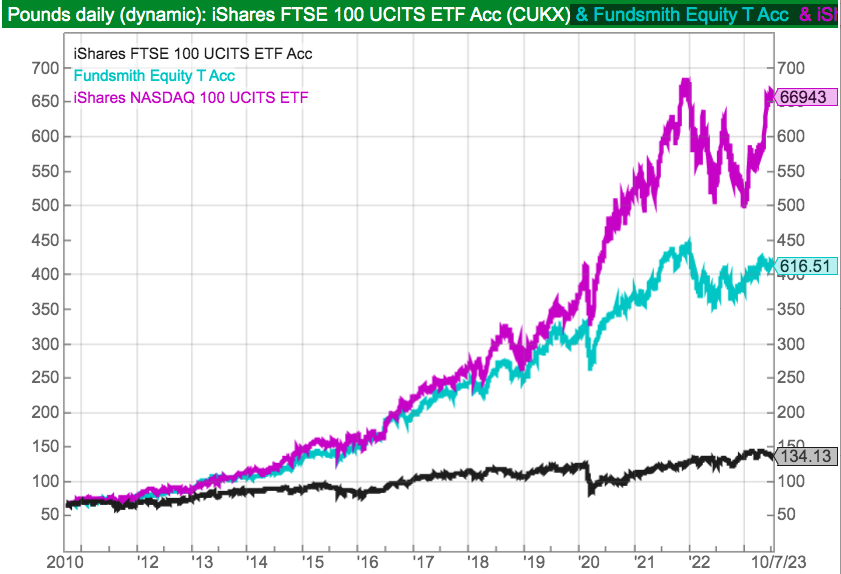
But we must be careful not to use hindsight to cherry-pick our benchmarks. We do not want to unfairly compare ourselves against the very best out there, because we do not have to be Terry Smith to be deemed a ‘good investor’.
Do remember the ‘very best out there’ can come and go. For example, the fund managers running the likes of Castlefield Buffettology, Scottish Mortgage and Finsbury Growth & Income were all once touted as ‘good investors’…
…but the last five years have seen their performances converge with the FTSE 100:
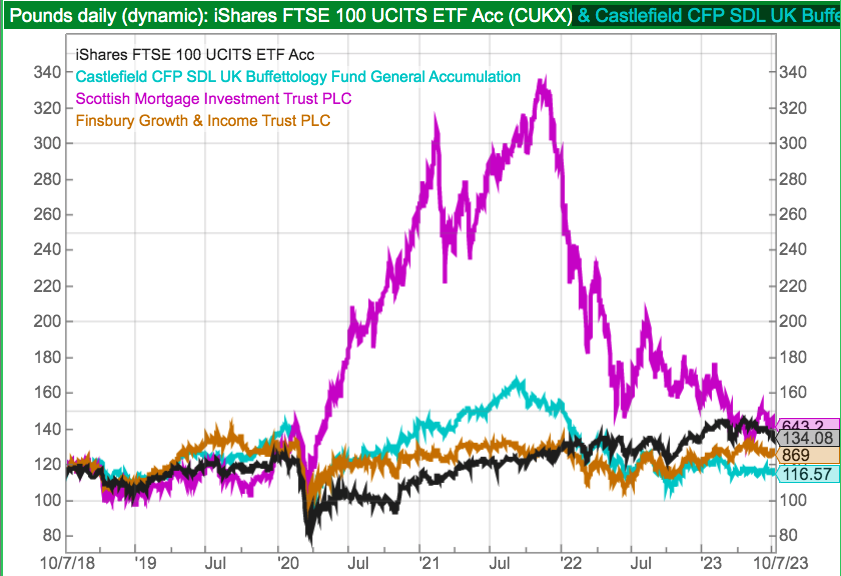
If you have tracked the FTSE 100 since mid-2018, you may therefore still be a good investor. Or at least as good as some (once?) popular fund managers!
Survivorship bias and luck versus skill
Then there’s survivorship bias, which is among the most powerful concepts to understand when judging your stock-picking skills.
Simply put, we only hear about market winners. We always compare ourselves to who and what has succeeded in the past, and easily forget who and what has sunk without trace.
Good investors prove themselves through both bull markets and bear markets. Spend 20 years picking shares and you should experience at least one deep/protracted bear market that will force many other investors to leave the pitch retired hurt.
A 20-year record at 5% per annum may not sound great, but to me it signals a better result than five years at 20%. You see, nobody can really distinguish whether luck or skill has dominated a five-year performance… especially if that five-year performance has been underpinned by one or two big winners.
But the longer the investing track record, the more likely skill has influenced the end result — and the more likely you are in fact a ‘good investor’ by never retiring hurt in the meantime.
Peter Lynch once wrote: “In this business, if you’re good, you’re right six times out of ten. You’re never going to be right nine times out of ten.” Get six (or more!) out of ten stock picks right over 20 years, and you should be right up there. I have owned 32 different shares since 2004, and 23 have gone up while nine have gone down.
So… are you a good investor?
The answer depends on your personal stock-picking ambitions… and whether you can develop a sensible, robust process that meets your goals during both bull and bear markets.
Coping with the long timescales is the hard part. You could enjoy being a ‘bull-market genius’ for a decade before suddenly retiring hurt… by which point it may be too late to rescue your portfolio with a more suitable passive alternative.
Today’s rough conditions for small-caps may therefore be a blessing. If your small-company shares are currently keeping you in the game — just as they did during the Covid-19 crash of March 2020 and a few market setbacks before that — then you probably already possess what it takes to become a ‘good investor’!
Until next time, I wish you safe and healthy investing.
Maynard Paton

Hi Maynard,
Interesting to see your thoughts on benchmarking as I’ve recently tweaked mine. I used to have two main benchmarks, (a) the FTSE All-Share and (b) a 10% annualised ten-year return and 5% dividend yield.
The second goal was based on the long-term UK stock market’s average of 7% per year plus a healthy margin of outperformance. However, while that sort of absolute goal may still be reasonable over an investment lifetime, over any single decade our results are much more likely to be affected by medium-term economic and valuation factors. So if you invested during the 1990s, a 10% annual return was easy. But if you invested in the 2000s, 10% annualised was very unlikely.
So I’ve ditched the absolute target in favour of focusing on the FTSE All-Share over ten years, plus exceeding its yield. That’s very similar to what UK Equity Income Sector funds do, so I’ve started to benchmark myself against actively managed funds in that sector. I think that’s appropriate because if my portfolio was a unit trust, it would be in that sector.
There are of course issues with benchmarking against active funds, just as there are with other benchmarks, but I still think it’s useful to compare myself against dozens of funds that are trying to do more or less the same thing as me, in addition to the vanilla All-Share.
John
Hi John
Thanks for the comment and I trust you are outperforming! Yes, absolute goals can become very optimistic in rough markets and perhaps tempt some extra risk-taking just to meet what is an arbitrary target. I think we just have to benchmark ourselves against a simple alternative (or mix of simple alternatives) in which we would invest were we not choosing our own shares. For income alternatives, I have noted the likes of VVUKEI and IUK, which are ETFs that invest in a batch of high yielders and reshuffle every six months.
Maynard