18 September 2020
By Maynard Paton
Results summary for City of London Investment (CLIG):
- Funds under management (FuM) endured a rollercoaster second half, but finished the year up 2% to lift profit by 10% and the dividend by 11%.
- FuM ‘capacity’ has become an issue, and explains CLIG’s limited past progress and probably prompted the upcoming merger.
- The Karpus deal appears logical, but similar to CLIG the merger partner has struggled to attract new clients.
- The accounts continue to sport high margins, decent cash flow, high equity returns and net cash.
- A potential P/E of 11 and yield of 7.5% seem attractive, although the shares have been rated modestly for years. I continue to hold.
Contents
- Event links, share data and disclosure
- Why I own CLIG
- Results summary
- Revenue, profit and dividend
- Funds under management
- FuM capacity
- Liontrust comparison and marketing
- FuM fee rates
- Karpus all-share merger
- Management
- Employee Incentive Plan
- Financials
- Valuation
Event links, share data and disclosure
Event: Final results and annual report for the twelve months to 30 June 2020 published 14 September 2020
Price: 400p
Shares in issue: 26,560,707
Market capitalisation: £106m
Disclosure: Maynard owns shares in City of London Investment. This blog post contains SharePad affiliate links.
Why I own CLIG
- Emerging-market fund manager that employs a lower-risk strategy of buying investment trusts at a discount.
- Accounts showcase high margins, low capital requirements, net cash and ability to distribute majority of earnings as dividends.
- P/E of 11 and yield of 7.5% offer upside potential should elusive new clients ever bolster funds under management.

Further reading: My CLIG Buy report | All my CLIG posts | CLIG website
Results summary
Revenue, profit and dividend
- A Q3 statement issued during April and a Q4 statement issued during July revealed CLIG had endured a rollercoaster finish to the year.
- The level of CLIG’s revenue and earnings are inherently linked to the ups and downs of the firm’s funds under management (FuM).
- Following a 12% improvement during H1, FuM dived 27% during January, February and March but then rebounded 25% during April, May and June.
- Year-end FuM at $5.5b gained 2% over the twelve months, while average monthly FuM gained 5% to $5.3b:
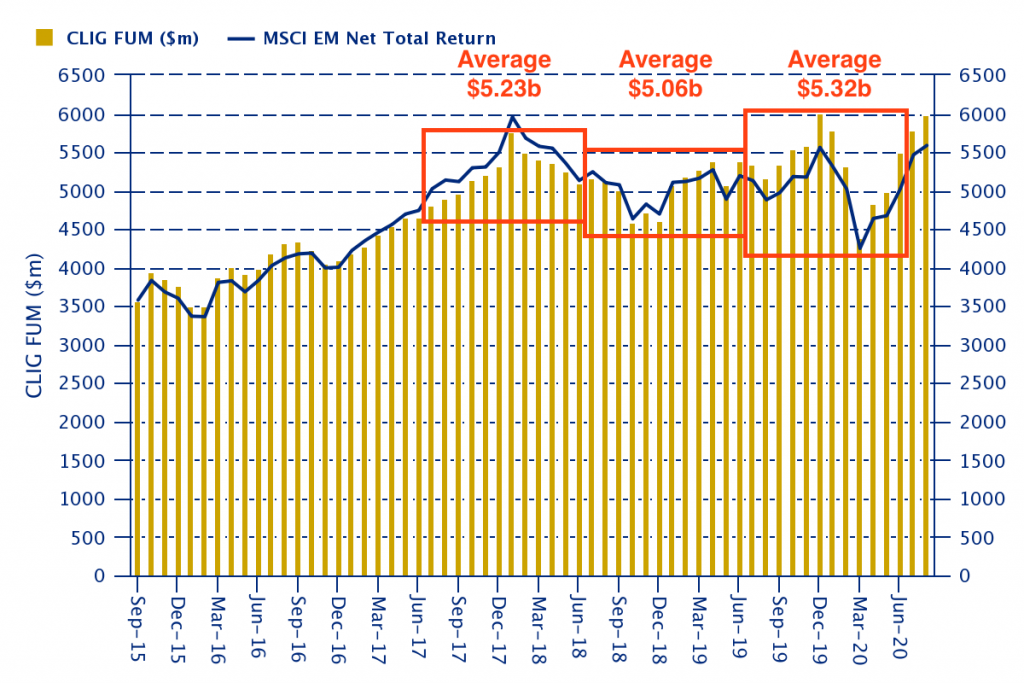
- Average monthly FuM was only 2% greater than that witnessed during FY 2018.
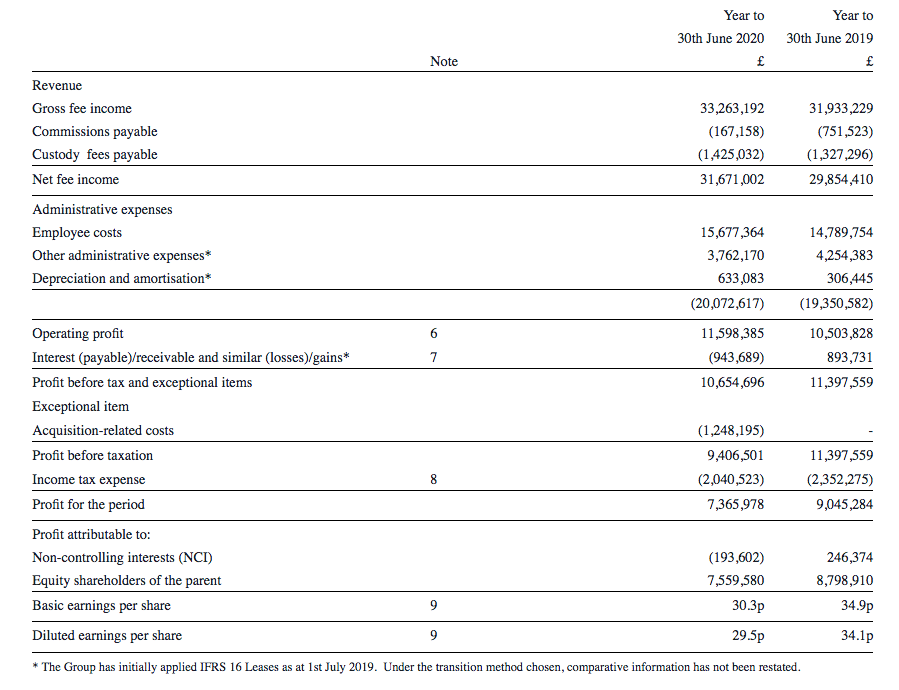
- Revenue gained 4% while operating profit before exceptional items climbed 10%:
| Year to 30 June | 2016 | 2017 | 2018 | 2019 | 2020 |
| FuM ($m) | 4,005 | 4,661 | 5,107 | 5,389 | 5,512 |
| Revenue (£k) | 24,413 | 31,294 | 33,931 | 31,933 | 33,263 |
| Operating profit (£k) | 7,756 | 11,509 | 12,528 | 10,504 | 11,598 |
| Finance income (£k) | 212 | 82 | 264 | 894 | (944) |
| Exceptional items (£k) | - | - | - | - | (1,248) |
| Pre-tax profit (£k) | 7,969 | 11,590 | 12,792 | 11,397 | 7,366 |
| Earnings per share (p) | 23.6 | 36.9 | 39.5 | 34.9 | 30.3 |
| Dividend per share (p) | 24.0 | 25.0 | 27.0 | 27.0 | 30.0 |
| Special dividend per share (p) | - | - | - | 13.5 | - |
- The £1.2m exceptional item related to the Karpus merger and was the group’s first one-off charge since 2011.
- CLIG also benefited from a slightly stronger USD.
- CLIG’s revenue is collected almost entirely in USD but approximately 40% of costs are expensed in GBP.
- GBP traded at a 1.29 USD average during FY 2019, versus a 1.26 USD average during FY 2020.
- The results highlight was the final dividend being lifted 2p per share, or 11%, to 20p per share. The interim payout had been raised an identical amount.
- The 30p per share full-year dividend set a new record.
- CLIG confirmed Covid-19 had not prompted any redundancies:
“Although FuM dropped significantly during the initial stages of the pandemic and the related market volatility, we did not reduce employee headcount or make significant decreases in compensation levels.”
Funds under management
- CLIG’s FuM can be divided into two main categories:
- Emerging Markets (EM), and;
- Non-EM, which covers ‘frontier’ markets, developed markets and other themes.
- Both categories apply CLIG’s long-standing ‘value’ approach of buying investment trusts at a discount.
- Non-EM FuM has become a much larger part of overall FuM during recent years:
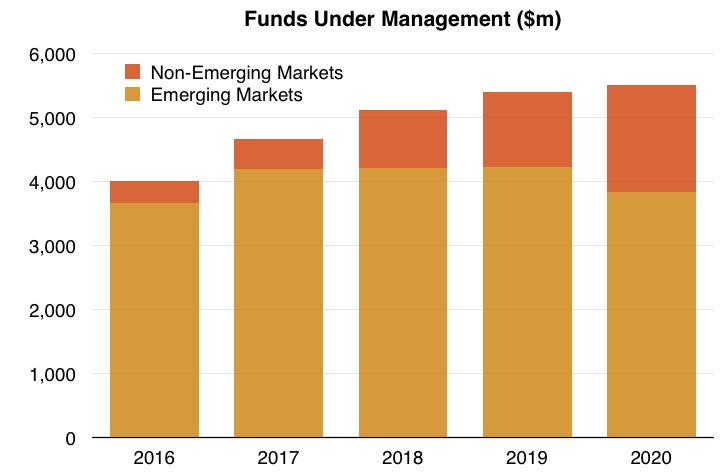
- Non-EM funds have regularly attracted new client money, unlike the EM funds, which have suffered net withdrawals since 2017:
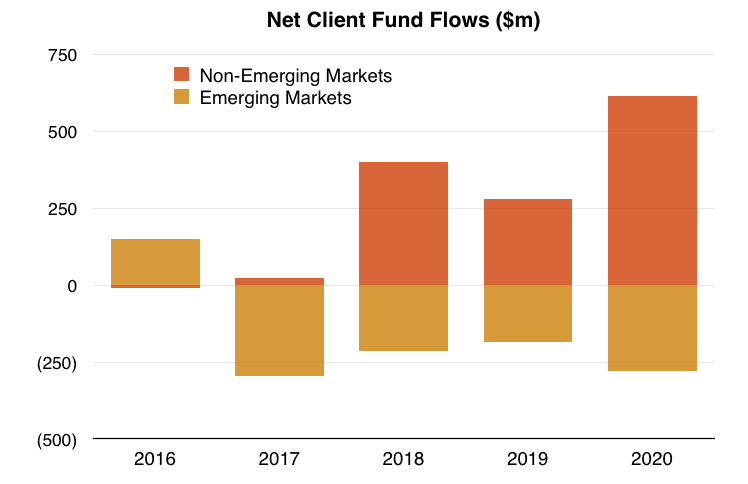
- During the last twelve months, client money consistently trickled out of EM funds and regularly trickled in to non-EM funds:
| Client flows | Q1 2020 | Q2 2020 | Q3 2020 | Q4 2020 | FY 2020 |
| EM ($m) | (12) | (106) | (68) | (89) | (275) |
| Non-EM ($m) | 152 | 148 | 33 | 280 | 613 |
| Total ($m) | 140 | 42 | (35) | 191 | 338 |
- CLIG explained the latest EM outflows:
“The EM equity asset class remains out of favour, specifically in the United States, which is where c.94% of our clients reside (by FuM). The EM strategy has seen outflows over the fiscal year due to a combination of factors including clients’ rebalancing after strong gains in EM over the second half of 2019.
Some clients are also redeeming in order to meet operating expense obligations during the pandemic. The increasingly negative tone from the US government on the business practices of Chinese companies and the Chinese government overall is another factor putting pressure on the asset class.”
- An irony of the growing exposure to non-EM FuM is that the investment returns generated by non-EM have lagged those of EM during the last two years:
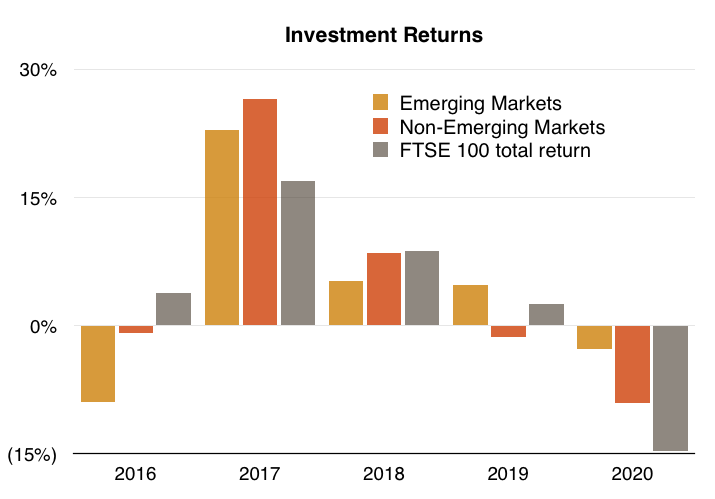
- The returns from CLIG’s ‘value’ strategy have not been spectacular of late.
- During the last five years, CLIG’s funds have recorded an overall 4% compound annual average return versus a 3% average for the FTSE.
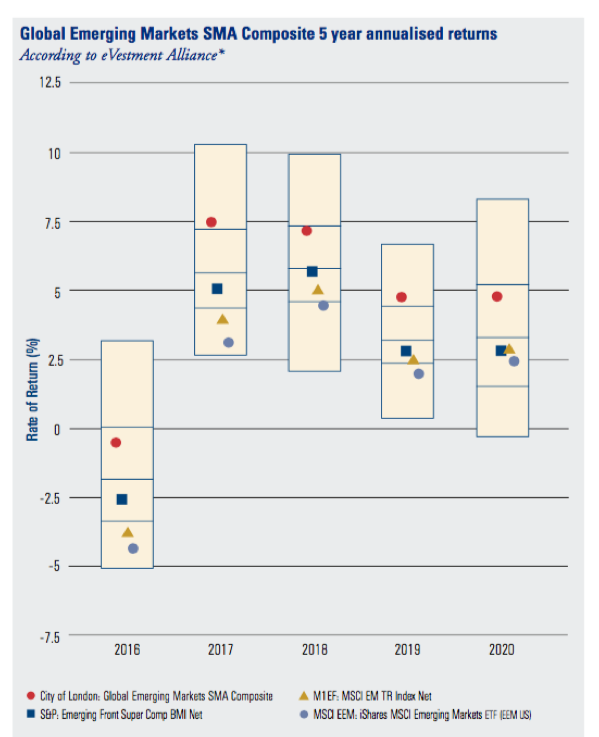
- The annual report claimed more than 90% of FuM — denoted by the small red circles below — was “ahead of their benchmarks and institutional peer-group averages over five years”:
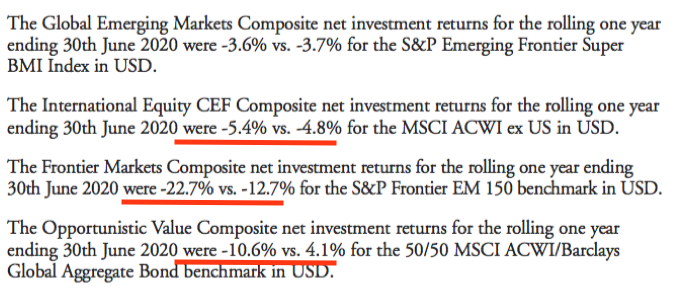
- The annual report also confessed that all three of the non-EM strategies had underperformed during the year:
- Although the five-year returns have outperformed their particular benchmarks, CLIG’s total FuM (yellow bars) has barely beaten the group’s main EM benchmark (blue line):
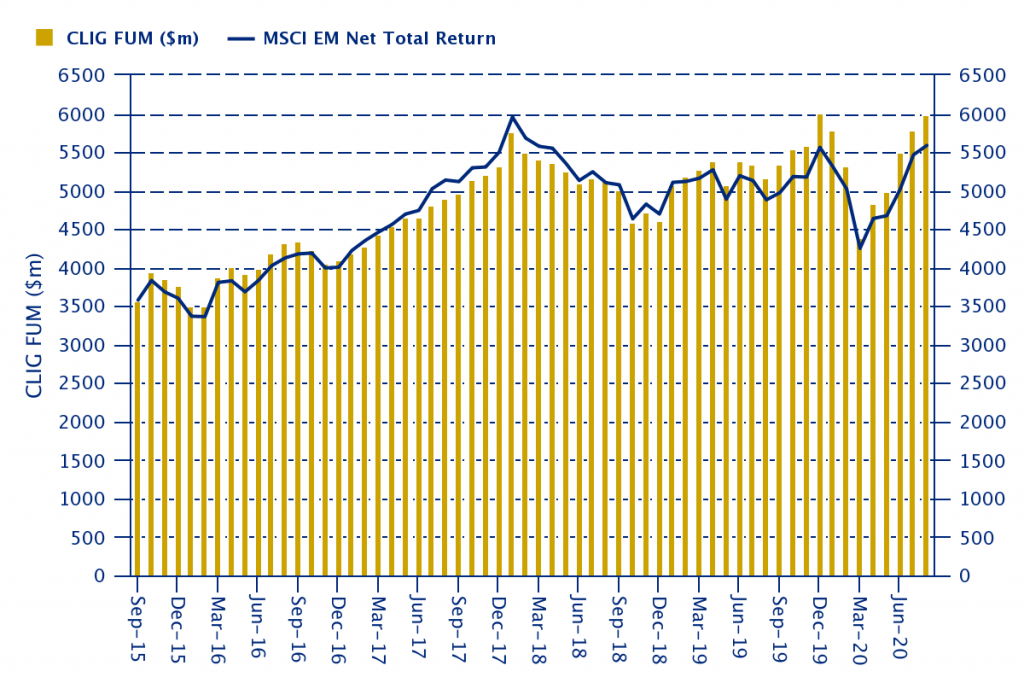
- “Capacity” and (lack of) marketing may explain why CLIG’s FuM has not really increased that much over the main MSCI comparator.
Enjoy my blog posts through an occasional email newsletter. Click here for details.
FuM capacity
- “Capacity” has become an issue. The EM strategy in particular can only invest so much money before returns become diluted:
“Our overriding objective when considering capacity and raising assets is our ability to generate alpha for our clients on a sustainable basis. In this regard we will not jeopardise long-term performance, and with it, long-term client relationships.”
- These results were the first I could recall that warned of an actual capacity figure for the EM strategy.
“Our objective is to keep the EM strategy assets around current levels (US$4 billion)…”
- EM FuM has bobbed around the $4b level since at least 2014.
- Capacity is also impacting non-EM funds:
“[T]he International strategy has paused active marketing following a two-year period of very strong asset growth. We will reappraise capacity at year end 2020.”
- I am not sure why certain fund marketing should be paused when new client money had being rolling in.
- The Opportunistic Value approach — representing only 5% of FuM — could now be the main source of new client money:
“The Opportunistic Value (OV) strategy has significant capacity with a good long-term track record and will remain the focus of marketing in the medium term.”
- CLIG projected net inflows of $250m for FY 2021.
- $250m represents an extra 4.5% of FuM on the $5.5b seen at the year-end.
Liontrust comparison and marketing
- Comparisons with other sector companies can be instructive for investors.
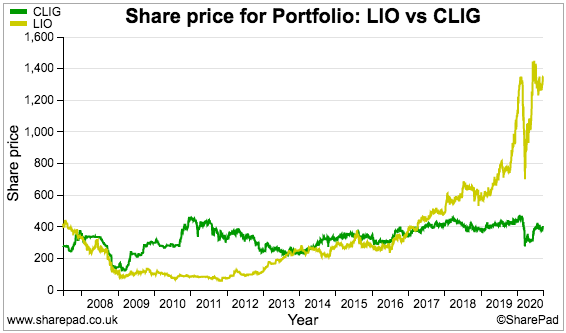
- The shares of Liontrust Asset Management (LIO) have outperformed those of CLIG by a mile during the last few years:
- Contrast the next two charts, which break down the FuM movements at CLIG and LIO:
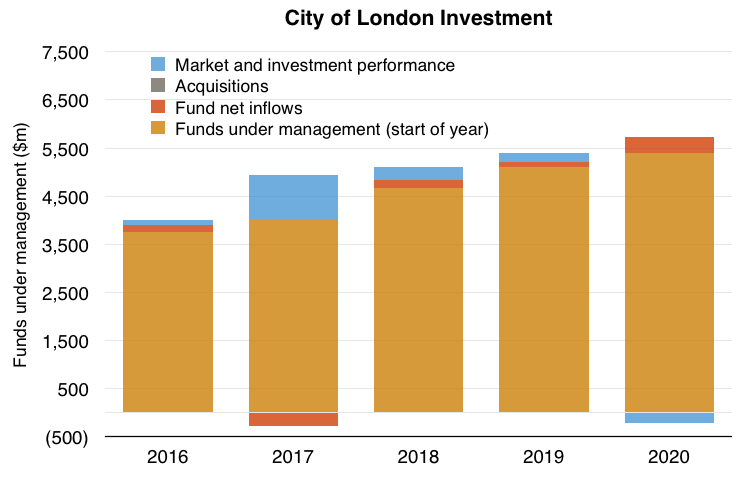
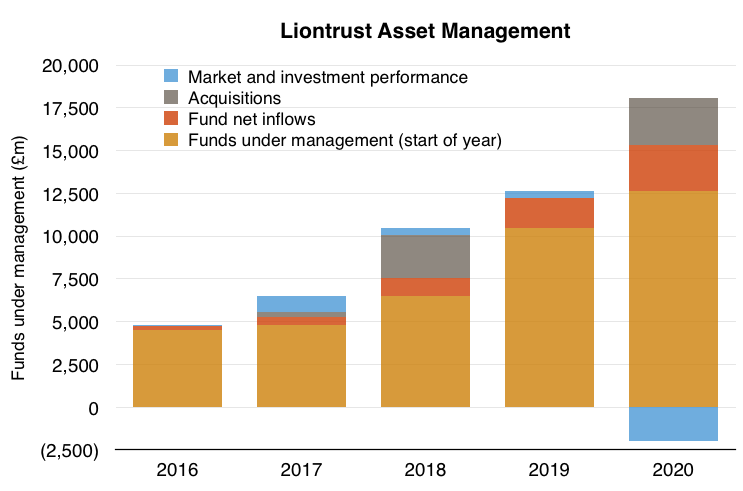
- The red blocks on each chart are important. They represent the amount of net new client money garnered each year.
- Net new client money at CLIG has represented an average of 2% of the year-start FuM since 2016.
- In contrast, net new client money at LIO has represented an average of 12% of the year-start FuM (including acquired FuM) since 2016.
- Why can LIO attract so much more client money than CLIG?
- LIO presumably does not suffer any ‘capacity’ constraints and can therefore place a much greater emphasis on marketing.
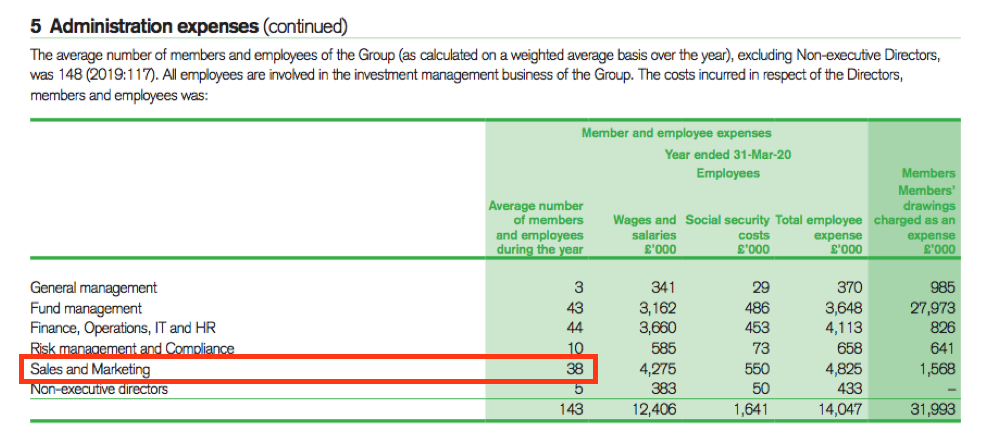
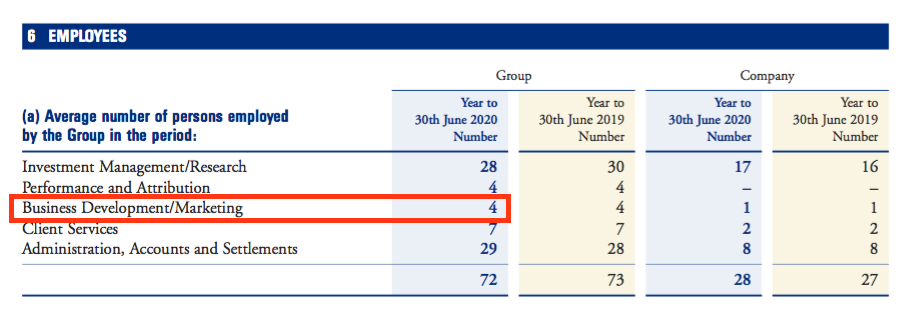
- For perspective, 38 of LIO’s 143 employees work in sales and marketing:
- In contrast, 4 of CLIG’s 72 employees work in business development and marketing:
- LIO has always employed a sizeable marketing department.
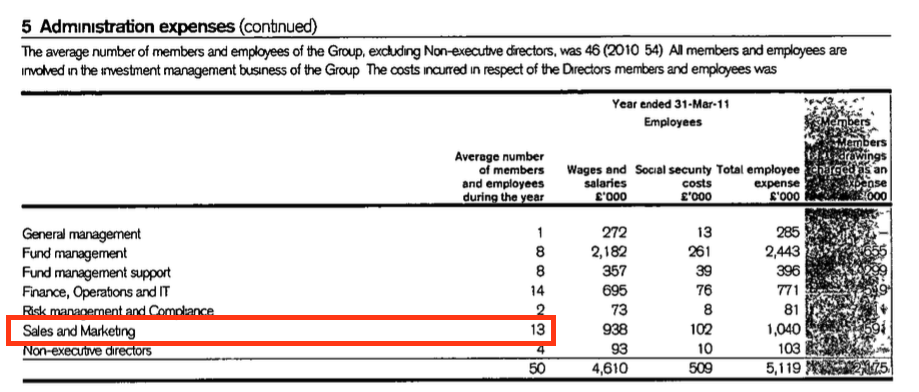
- Back in 2011, when LIO’s FuM was only £1b and various troubles led to an operating loss and suspended dividend, a quarter of employees still worked in sales and marketing:
- Within CLIG’s 2020 annual report, the only significant mention of marketing was:
“Marketing efforts will continue to be targeted at investment consultants, foundations, endowments and pension funds. We will also continue to introduce our capabilities to family offices, outsourced CIO firms and alternative consultants.”
- LIO’s 2020 annual report meanwhile devoted a full page to a Sales and Marketing review:

- True, CLIG targets US institutions while LIO targets UK retail investors and therefore the marketing requirements will be different.
- CLIG’s capacity issue will limit the need for marketing staff anyway.
- Yet the difference in FuM progress and new client money between CLIG and LIO is striking.
- LIO’s aggregate investment returns do not look to have been outstanding either.
- Perhaps great stock-picking is only one part of winning new clients.
FuM fee rates
- CLIG said:
“Despite a slight reduction in our average revenue margin to 75bp for the year (c.74bp for the month of June 2020), net fee income rose by 6% to £31.7 million…”
- 75 basis points compares to 86 basis points CLIG enjoyed during 2016.
- The fee-rate collapse since 2016 has been due to CLIG charging lower fees on its non-EM funds.
- CLIG has never disclosed the exact fee rates it charges on its EM and non-EM funds.
- However, my algebra suggests EM fees are applied at 90 basis points and non-EM fees are applied at 30 basis points to arrive somewhere close to the blended fee rates CLIG has declared:
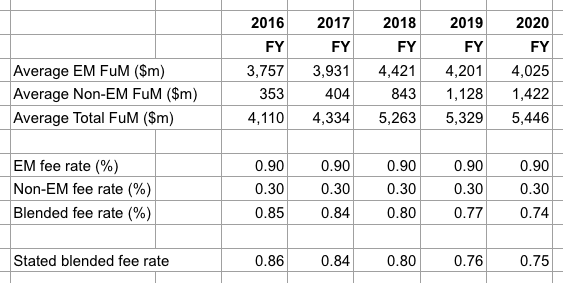
- If my fee-rate algebra is accurate, the advance of non-EM FuM is not surprising given the associated fees are so much lower.
- If my fee-rate algebra is accurate, the fee rates of 90 basis points and 30 basis points have at least showed consistency.
- I still wonder if non-EM FuM has been bolstered partly by EM clients switching to non-EM. The total number of clients has increased from 153 to only 173 during the last five years.
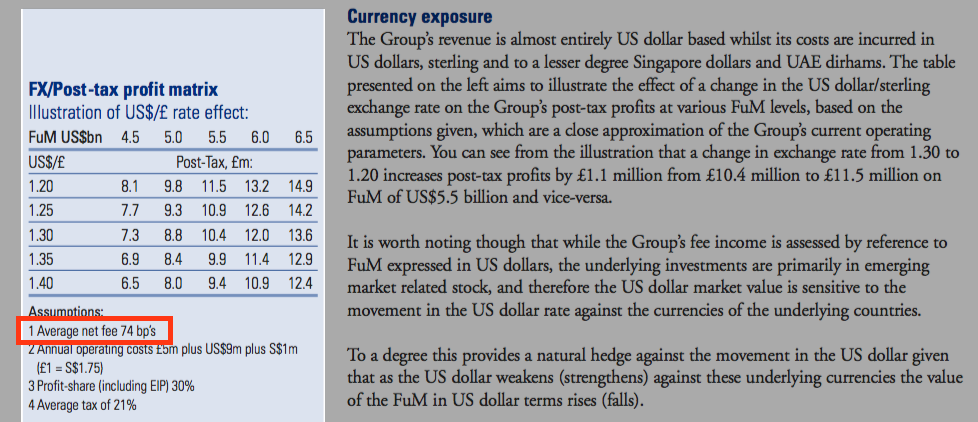
- Note that the annual report provided a revised FuM/exchange-rate table that indicated overall fee rates were now 74 basis points:
Karpus all-share merger
- At the time the deal valued Karpus at £78m and brought with it FuM of $3.4b:
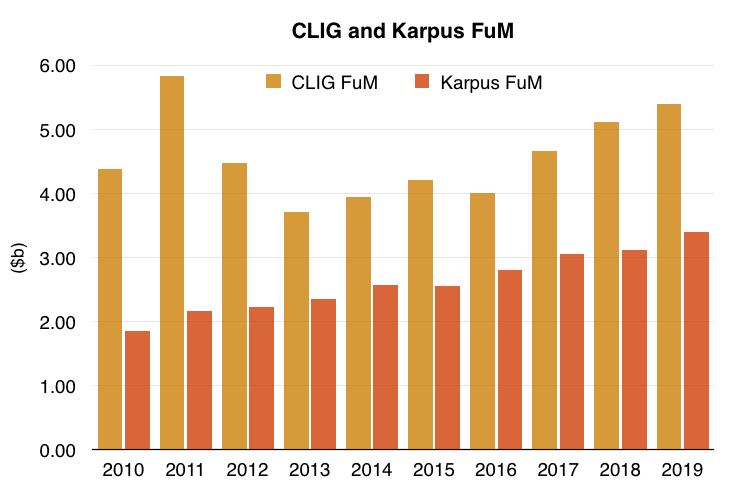
- I studied the merger prospectus here. Key points on Karpus included:
- Fee rates at 80 basis points;
- A US client base comprising mostly of high net worth individuals, and;
- FuM split 39% equities and 61% fixed income/cash.
- The merger may have been spurred by CLIG recognising the capacity issue and limited growth prospects of its EM FuM.
- The deal also diversifies CLIG into fixed-income investments, which could make FuM less volatile.
- The acquisition did not seem to be a knee-jerk decision. The prospectus revealed merger discussions started during 2018.
- The prospectus admitted the merger would incur one-off “adviser fees” of £3.3m.
- These annual results stated one-off merger costs would be £4m, of which £1.2m was charged this year and the rest would be charged during FY 2021.
- One-off costs of £4m equate to approximately 16p per share and seem high for a £78m deal.
- The merger is expected to complete on 1 October.
- CLIG looked forward to a smooth integration:
“While the two operating companies will be run independently, the scope for operational efficiencies to be developed across both platforms should ensure both enhanced and less volatile returns for CLIG shareholders going forward.
[Karpus] brings like-minded people, a similar culture and a robust fund management business. As both [Karpus] and [CLIG] share a focus on investment in [close-end funds], we have gotten to know the Company, and specifically their founder and largest shareholder, George Karpus, very well.
We have had the opportunity to watch their business develop, get to know their core values, and monitor their performance and investment activity over multiple market cycles spanning more than ten years, which allowed us to see their commitment to their investment process and to their clients.”
- Similar to CLIG, Karpus has struggled to attract new client money (red bars):
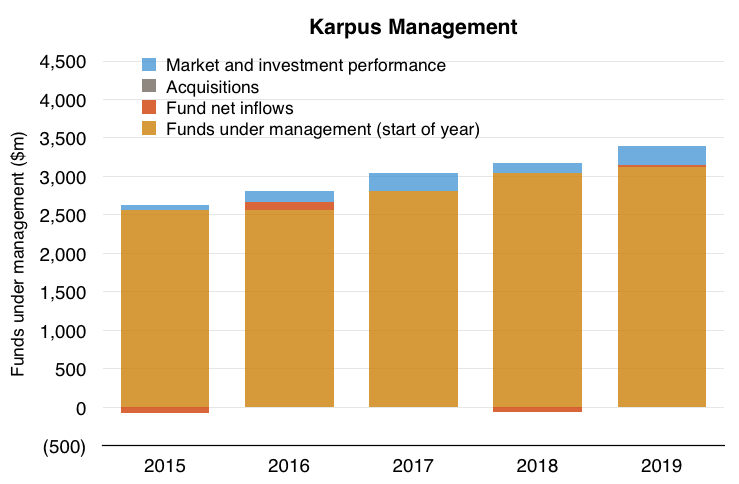
- However, investment returns (blue bars) have consistently been positive (assuming Karpus has not acquired any FuM).
Management
- The purchase of Karpus was announced less than six months after CLIG founder Barry Olliff retired from an executive role.
- The founder of Karpus, George Karpus, will meanwhile retire once the deal is completed.
- This ‘changing of the guard’ could influence the way CLIG operates — which could be good or bad.
- CLIG’s chief executive, Tom Griffith, has a marketing background and may well instigate efforts to find some elusive new clients:

- But the chief exec may also decide to adjust CLIG’s “team-based approach” that has to date “avoided any hint of a star culture”.
- Or he may pursue further acquisitions.
- The annual report commentary did not hint at any radical action.
- But one noticeable change was a shorter results presentation.
- The latest presentation ran to 31 pages, versus 52 for the FY 2019 powerpoint.
- Key slides absent this time included the summary financial statements, fund performance statistics and the dividend-projection template.
- Some slides were omitted because of the Karpus deal and the finer rules of City prospectus documentation.
- CLIG’s presentations will hopefully reinstate the informative slides once the Karpus deal completes.
- Mr Olliff has agreed to serve as a non-exec until October 2021.
- CLIG said:
“Shareholders are reminded of Barry’s previously stated intention to sell 330,613 shares at 450p, which is the balance of his 500,000 planned sale at that level, and then 500,000 shares at each of 475p and 500p, subject to relevant restrictions. As per listing rules, any share sales will be announced to the market after execution.”
- Mr Olliff has been hoping to sell shares at 500p for at least two years.
- Mr Olliff retains almost 1.9 million shares, which will represent less than 4% of the share count once the Karpus deal completes.
- CLIG’s largest shareholder will, post-merger, be George Karpus with a 31% stake. The prospectus indicated Mr Karpus could dispose of 80% of his holding after a one-year lock-in.
- With the founders/ex-chief execs of both CLIG and Karpus no longer in charge, I have become reluctant to add to my CLIG holding. I simply prefer owner-orientated executives — rather than professional ‘salarymen’ — to lead my investments.
- Of course, the ‘salaryman’ now in charge of the combined business may well find new clients without adjusting the workplace culture or embarking on an acquisition spree.
- I am prepared to give chief executive Mr Griffith the benefit of the doubt. His annual-report biography (above) suggests he is loyal to CLIG’s traditions having served on the board since 2004.
Employee Incentive Plan
- CLIG devised an Employee Incentive Plan (EIP) during 2016.
- The EIP was funded by increasing the staff bonus pool from 30% to 35% of pre-bonus profit:
“In a fund management company, clients attach a significant level of importance to employee share ownership in terms of their commitment to the company for which they work.
In an attempt to broaden the base of employee ownership, encourage direct staff participation and make CLIG shares more attractive to staff, we will be bringing forward to shareholders a proposal at the forthcoming AGM. This [EIP] proposal will include, for a four year period, an increase in the staff bonus pool from 30% to 35%.”
- I was very sceptical of giving staff an extra 5% of pre-bonus profit for simply staying in their jobs.
- The performance of the business back in 2016 hadn’t really suggested the staff deserved an extra retention scheme.
- During the four years to 2016, CLIG’s FuM had declined 11%, revenue and profit had fallen approximately 30% and the dividend had been left unchanged.
- During the subsequent four years when the bonus pool was increased to 35% (2017 to 2020), CLIG’s FuM gained 38%, revenue and profit gained at least 36% while the dividend was lifted 25%.
- Perhaps this EIP was worthwhile after all, and perhaps future bonus schemes can motivate staff to further increase FuM and earnings.
- Or perhaps the staff got lucky. Maybe FuM and earnings were simply assisted by broad market movements.
- The shares associated with the EIP cost CLIG £4m to purchase and represent approximately 4% of the share count.
- The bonus pool will revert back to 30% of pre-bonus profit from FY 2021.

Financials
- CLIG’s balance sheet remains cash-rich and free of conventional bank debt.
- Year-end cash came to £14.6m, equivalent to 55p per share.
- Other financial assets — which the 2020 annual report discloses to be mostly “listed investments” — stood at £4.0m, or 15p per share.
- A £0.2m or 1p per share non-controlling interest within the income statement reflects minority investments owned by a third party.
- This company document indicates regulatory capital was £2.1m, or 8p per share, at September 2020.
- Net cash and investments are therefore 55p (cash) plus 15p (other financial assets) less 1p (non-controlling interests) less 8p (regulatory capital) = 61p per share.
- Major cash flow movements during the year were £7.0m paid as dividends and £2.0m spent on shares for the Employee Benefit Trust (EBT).
- The EBT expense was offset by raising £359k from selling shares to staff to satisfy their exercised options.
- Between 2011 and 2020, the EBT has spent £8.0m buying shares and received £4.0m from selling shares.
- Arguably the effective cash cost of CLIG’s options (and EIP) over time has been (£8.0m less £4.0m) / 10 years = £400k a year.
- Working-capital movements and capital expenditure remain small:
| Year to 30 June | 2016 | 2017 | 2018 | 2019 | 2020 |
| Operating profit (£k) | 7,756 | 11,509 | 12,528 | 10,504 | 11,598 |
| Depreciation and amortisation (£k) | 168 | 231 | 295 | 306 | 292 |
| Net capital expenditure (£k) | (137) | (485) | (137) | (421) | (79) |
| Working-capital movement (£k) | (22) | (533) | 1,423 | 894 | 69 |
| Net cash and investments (£k) | 11,719 | 15,022 | 19,937 | 18,232 | 18,928 |
- Margins and returns on equity remain attractive:
| Year to 30 June | 2016 | 2017 | 2018 | 2019 | 2020 |
| Operating margin (%) | 31.8 | 36.8 | 36.9 | 32.9 | 34.9 |
| Return on average equity (%) | 42.7 | 58.9 | 50.9 | 43.6 | 40.0 |
- CLIG’s accounts remain free of defined-benefit pension obligations.
Reader offer: Claim one month of free SharePad data. Learn more. #ad
Valuation
- CLIG’s valuation is complicated by the Karpus deal.
- CLIG did not disclose the level of FuM held by Karpus within these results.
- The future profitability of Karpus is unclear, too.
- In particular, will CLIG’s 30% profit-share pool be extended to Karpus employees?
- Probably. CLIG said:
“We anticipate that a similar plan will be created for [Karpus] employees, to encourage ownership of CLIG shares”
- Employing the aforementioned FuM/exchange-rate table provides a valuation for CLIG without Karpus.
- CLIG reported FuM of $6.0b at the end of August 2020, and GBP:USD at 1.30 may lead to earnings of approximately £11.9m or 45.0p per share.
- Adjust the 400p share price for the 61p per share net cash and investments, and the possible ex-Karpus P/E could be 339p / 45.0p = 7.5
- The balance sheet has regularly carried a sizeable cash position, which may be needed to reassure clients and might therefore not be ‘surplus to requirements’ for valuation purposes.
- Ignoring the cash and investments gives a potential ex-Karpus P/E of 8.9.
- Karpus had FuM of $3.4b at May 2020 and at June 2019, when operating profit that year was $15.3m adjusted for the pay to the (now-retiring) founder.
- Apply standard 21% US tax to $15.3m, and possible Karpus earnings are $12.1m or £9.3m with GBP:USD at 1.30.
- Adjust for a (potential) 30% profit-share pool and possible Karpus earnings come to $8.5m or £6.5m.
- Add possible CLIG earnings of £11.9m to possible Karpus earnings of £6.5m gives £18.4m, or 36.4p per share based on the enlarged share count of approximately 51m shares.
- Depending on whether (or not) the cash and investments are truly surplus to requirements, and whether (or not) Karpus employs a 30% profit share, the P/E on the combined group could be 9 or 11 or somewhere in between.
- The rating does not look expensive, especially for a business that has coped relatively well with the the pandemic.
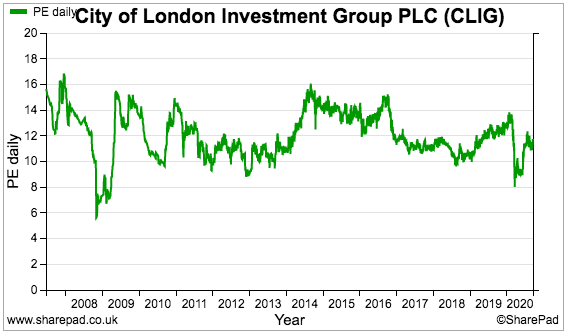
- However, CLIG’s shares have traded at a modest 10-12x rating for years:
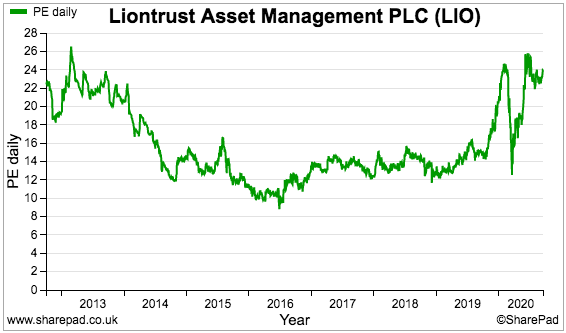
- In contrast, LIO’s greater underlying FuM growth has propelled its P/E beyond 20:
- Until CLIG attracts a much greater rate of new client money, the dividend rather than the share price seems likely to be the main source of shareholder return.
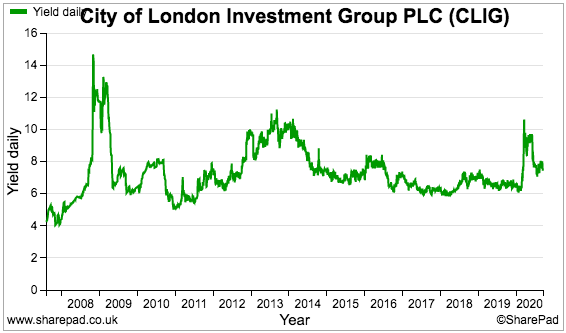
- The 30p per share payout supports a very useful 7.5% income at 400p, although the shares have almost always offered a yield of at least 6%:
Maynard Paton
PS: You can receive my blog posts through an occasional email newsletter. Click here for details.

City of London Investment (CLIG)
Publication of 2020 annual report
Here are the main points of interest not referred to in the blog post above:
1) Employee and director pay
This table outlines how employee and total remuneration has increased. I have added the 2010 figures to calculate a 10-year CAGR:
Note that the tables excludes option awards, the EIP and other benefits:
As per the table:
* Employee remuneration has a 5-year CAGR of 7% and a 10-year CAGR of 5%.
* Total remuneration has a 5-year CAGR of 7% and a 10-year CAGR of 4%.
In comparison:
* FuM has a 5-year CAGR of 6% and a 10-year CAGR of 2%.
* Gross fee income has a 5-year CAGR of 6% and a 10-year CAGR of 1%.
So, over the last 5 years, employee and total remuneration has exceeded FuM/Gross fee income by c1% a year.
Over the last 10 years, the remuneration ‘excess’ is c3% a year.
Therefore, FuM/gross fee income growth has been catching remuneration growth, but the employees still seem to taking that little extra from the business given the rate of FuM/fee income advances.
For 2020, 72 employees and directors took home £15.7m — an average cost of £218k (up 7% from £203k):
Taking just wages/salaries, the average employee cost is £95k, up 5% on the £90k for 2019.
Wages/salaries have a 5-year CAGR of 7% and a 10-year CAGR of 6% — pretty much in line with CAGRs shown in that first table.
I should add the profit-share pool was commendably reduced during the Q3 market slump:
Gross fee income per employee was £462k for 2020, up 6% from £437k for 2019. For this productivity measure, the 5-year CAGR is 5% and the 10-year CAGR is 0% (2010 enjoyed a FuM/revenue spike that CLIG has only recently re-attained).
So again, employee wages have outpaced employee productivity a little over the last 5 and 10 years.
A factor to consider is the growth of non-EM funds that charge lower fees. No doubt the staff cost of managing a non-EM fund is the same as an EM fund, so the relationship between fees/employee and cost/employee is likely to deteriorate further if greater non-EM funds are managed.
At least more money is being managed per head. FuM per employee was $77m for 2020, up from $74m for 2019. The 5-year FuM/employee CAGR is 5% and the 10-year CAGR is 1%.
Note that all the CAGR figures mentioned above range between 0% and 7%, which gives some indication of the pace CLIG has grown over time. No wonder the shares have always traded on a modest rating.
On to director pay:
The profit-share arrangements appear to have changed. Just Mr Olliff received a straight percentage profit share for 2020:
The chief exec (and chief investment office as well I think) now receive variable profit-shares of up to (a mighty) 250% of salary.
The execs deferred a pay rise last year but claimed one for 2020:
Mr Olliff collects a useful $100k consultancy fee on top of his non-exec work:
This chart puts employee wages, bonuses and operating profit into perspective:
Essentially pay and bonuses rise steadily no matter which way shareholder profit goes.
Not everyone agrees with the pay arrangements:
The chairman’s statement mentioned proxy advisers being unhappy with the board bonuses not having a deferred element.
2) Audit
No concerns here. Key audit matters were the same as last year — accuracy and completeness of management fees, breach of investment mandates and regulatory requirements
Scope was 100% while materiality was the standard 5% of pre-tax profit.
3) Largest client
An interesting note. CLIG has revealed its largest client represented 13.2% of revenue last year:
CLIG has never previously declared a 10%-plus-of-revenue client, so this disclosure appears to correct an oversight (the largest client represented 13.2% of revenue during 2019, too).
The handy table below shows CLIG’s top 10 clients represented 44% of FuM — the lowest proportion since 2014 (43%):
The 9 funds that appeared in the top 10 list this year and last collectively saw their average FuM drop 6% during the twelve months.
This next table shows client numbers increasing from 153 to 173 since 2016:
Seems like the client base is split between extremely loyal customers and very new customers. The mid-term customers may have departed due to so-so investment returns.
4) Covid-19
The report included what is now standard wording on the risk from Covid-19:
This next snippet is interesting. The pandemic may have enhanced the rationale for the Karpus deal:
5) Employee tenure
Staff tend to stay for many years:
Perhaps the risk of a radical chief-exec operational change is not so great if the rank-and-file are happy with CLIG’s traditional culture.
6) Finance costs
The unrealised investment gains of 2019 were reversed during 2020:
Most of the losses were incurred within the group’s longer-term listed investments:
CLIG’s current investments somewhat amazingly doubled in value during the year, and were sold for £254k — close to their £257k cost value:
7) IFRS 16
The adoption of IFRS 16 Leases was a non-event:
8) Key performance indicators
I am still not sure what to make of CLIG’s KPIs:
The share price KPI seems reasonable enough.
But if the MSCI benchmark gains only 1% over 5 years, then CLIG’s shares gaining 2% is not a great result.
Also, how the KPI is judged when the MSCI benchmark is negative remains unclear.
9) Question time
Not every annual report invites questions from readers:
This year’s AGM will take place behind closed doors and shareholders can submit question to the same email:
10) REIT fund
18 months in and the new REIT fund has not set the world alight with a £0.1m negative return:
At least one client sees potential with the REIT fund:
11) Section 172
CLIG’s section 172 report was comprehensive but did not shine much extra light on the business:
12) Share-based payments
Outstanding options represent approximately 2% of the share count (minus shares held in the EBT):
Note that the IFRS 2 option charge calculation came to zero for 2020 — such charges occur over the vesting period not the full exercise period.
The EIP scheme is projected to incur a £2.8m accounting cost over its lifetime:
13) Trade and other receivables
An interesting note that highlights the difference between trade receivables and accrued income:
Trade receivables are amounts invoiced to customers that have yet to be paid. The small entry suggests CLIG automatically debits fees from customer accounts to leave little in the way of owed balances.
Accrued income represents revenue recognised by CLIG but has yet to be invoiced. This larger number suggests CLIG collects fees monthly in arrears — for example, June’s fees were recognised as revenue but the invoice gets produced at the start of July and the cash collected soon after.
14) Trade and other payables
Another interesting note:
Accrued expenses are those that have occurred during the year but have yet to be paid. I am pretty sure the hefty figure relates to staff pay and year-end bonuses.
Maynard
Thanks for your thoughts. I read every word. You are my ‘go-to guy’ when it comes to CLIG.
Much to digest.
Thanks Ken. Hope it made sense.
Maynard
City of London Investment (CLIG)
Q1 Trading Update published 07 October 2020
Here is the full text interspersed with my comments:
———————————————————————————————-
City of London (LSE: CLIG), a leading specialist asset management group offering a range of institutional products investing in closed-end funds, announces that as at 30th September 2020, FuM were US$5.9 billion (£4.6 billion). This compares with US$5.5 billion (£4.4 billion) at the Company’s year-end on 30th June 2020. A breakdown by strategy follows:
IM Performance
Performance was ahead of the benchmark over the quarter in all strategies ex-Frontier. Specifically, in the Emerging Market (EM) strategy NAV performances were positive. In both the International (INTL) and Opportunistic Value (OV) strategies relative returns were driven by strong NAV performance and positive discount effects. The Frontier strategy was negatively impacted via sharply wider discounts.
The EM strategy had net inflows of US$39 million, while the Frontier strategy had outflows of US$107 million over the period. Net flows were flat for the INTL and OV strategies.
———————————————————————————————-
A few notable developments here.
1) The Emerging Market (EM) division enjoyed its first quarterly inflow of client money since Q3 2019 (3 months to March 2019).
2) Non-EM witnessed its first quarterly outflow of client money since CLIG started disclosing quarterly FuM movements during March 2018.
Whether 1) and 2) are the start of a reverse trend or just a blip is hard to say. But for the last few years client money had been slipping out of EM funds and into non-EM funds.
3) The small Frontier strategy suffered client withdrawals of $107m — representing 60% of the entire strategy. Frontier has never reported FuM in excess to $250m (at least since March 2018) and I wonder if assets now at just $75m could make the strategy unviable.
———————————————————————————————-
Operations
The Group’s income currently accrues at a weighted average rate of approximately 74 basis points of FuM. “Fixed” costs are c. £1.1 million per month, and accordingly the current run-rate for operating profit, before profit-share of 30% is approximately £1.7 million per month based upon current FuM and a US$/£ exchange rate of US$1.29 to 1 as at 30th September 2020.
The Group estimates that the post-tax profit before exceptional items of c. £1.8 million in relation to the KMI merger for the first three months of the year will be approximately 2.8 million (2019: 2.4 million) and post-tax profit after charging the exceptional items as detailed above for the first three months of the year will be approximately 1.0 million (2019: 2.4 million).
———————————————————————————————-
Fee rates thankfully remain at 74 basis points. The £1.7m monthly run rate excludes Karpus.
———————————————————————————————-
Dividends
The final dividend of 20 pence per share, subject to approval at the AGM on 19th October 2020, will be paid on 30th October 2020, bringing the total dividend for the financial year 2019-20 to 30 pence (2018-19: 40.5 pence, including the special dividend of 13.5 pence paid in March 2019).
Update on Merger of CLIG with KMI
As previously announced, CLIG completed the merger with Karpus Management Inc (“KMI”) on 1st October 2020 (the “Completion Date”). KMI’s client approval process resulted in approximately 98% of client assets being retained. As at 30th September 2020, KMI had US$3.6 billion of FuM. On a consolidated basis, as of 1st October 2020, the Group managed client assets of approximately US$9.5 billion.
———————————————————————————————-
Karpus had FuM of $3.4bn at May 2020, so a 6% improvement to $3.6bn.
As the overall CLIG/Karpus FuM and GBP:USD have not changed significantly, I am not minded to fine-tune my valuation sums from those shown within the blog post above.
CLIG’s H1 update in early January may give a clue as to the level of profitability of Karpus, and what level of profit share (if any) the new subsidiary enjoys.
Maynard
City of London Investment (CLIG)
Dividend cover template published 11 November 2020
A significant update that re-introduces the useful dividend-cover template that was dropped following the Karpus merger announcement. I am pleased (the new) management has not quietly dropped this template, although at times the template’s projections have been too optimistic.
The re-introduced template importantly suggests profits from Karpus will not be subject to the 30% profit-share that existing CLIG staff already enjoy. Previous statements had not made that really clear.
Here is the full text:
———————————————————————-
City of London Investment Group (LSE: CLIG), is pleased to announce that following the completion of the merger with Karpus Management Inc (“KMI”) on 1st October 2020 (the “Completion Date”), the Company has re-instated its dividend cover template on its website https://www.citlon.com/investor-relations/dividend-cover.php. The dividend cover template shows the quarterly estimated cost of a maintained dividend against actual post-tax profits for last year, the current year and the assumed post-tax profit for next financial year based upon specified assumptions.
On a consolidated basis, as of 31st October 2020, the Group managed client assets of approximately US$9.5 billion. The integration of operational areas such as Finance and Information Technology is underway and progressing on schedule.
———————————————————————-
Here is the revised template:
And here are the accompanying assumptions.
The template predicts earnings of £8.3m being retained for FY 2022.
A 30p per share dividend with 49m shares in issue (adjusted for treasury shares) = a FY 2022 dividend cost of £14.7m.
£14.7m plus £8.3m = earnings of £23.0m.
In my blog post above, I had calculated CLIG earnings of £11.9m plus Karpus earnings of £9.3m (before any 30% profit share) to arrive at £21.2m. So near enough, and perhaps the £1.8m difference is due to subsequent GBP:USD and/or funds under management (FuM) movements.
£23m is equivalent to 45p per share on the full 51m share count.
This dividend template suggests Karpus will not enjoy a 30% profit share as per the CLIG business, which is a positive.
Total FuM of $9.5b at 31 October compares to the same $9.5b declared at 01 October.
CLIG’s website reveals FuM (for CLIG only) increasing a fraction to stay above $6b:
Karpus’ website now includes a video from founder George Karpus:
Downside to CLIG/Karpus remains the low level of new client money arriving. The assumptions above indicate extra FuM of $385m (beyond market growth) to arrive between now and June 2022, which represents new client money growing by just 4% on the present $9.5b.
The 4% over 1.75 years works out similar to the 2% average cited in the blog post above for annual new client money as a proportion of year-start FuM. Not enough I suspect to significantly re-rate CLIG’s c10x P/E, although the dividend yield is above 7% at 410p to compensate.
Maynard
Thanks Maynard,
I would personally be pretty happy if they can reach EPS of 45pps over the next 18 months. This is a company that historically sees higher than 100% free cash flow / earnings per share so it is possible that the dividend of 30pps could be increased or we could see special dividends (similar to March 2019).
It’s good to see that the dividend chart is reinstated as it suggests that the business will continue to be run in the same manner.
I think it’s one to buy on the dip below 380pence if possible; not sure if we will see return of low SP seen at the beginning of the year.
Hi James
Thanks for the comment. Cannot disagree with anything you have written! The dividend chart reinstatement is a positive sign that present management want to continue where the founders left off.
Maynard
Hi Maynard,
Hope all well with you. It looks like a good update from CLIG today on Q2 trading. My interpretation is that they have performed better than forecast when discussed at the end of Q1. I’m drawing this conclusion on the basis of the revised dividend template note below (issued today). It looks like they are predicting quarterly earnings in excess of £6m (up 20% from around £5m quarterly). It looks like the newish CEO and acquisition of Karpus is going pretty well…?
https://www.rns-pdf.londonstockexchange.com/rns/2290M_1-2021-1-19.pdf
All this being said, I suspect that the share price is probably going to stay range bound in its current level unless there is consistent FUM growth. If we continue to see growth then perhaps a re-rating to a PE of 14 – 16 (as opposed to historic 12ish)? With emerging markets quite buoyant at the moment, that may be over optimistic.
Hi James
Yes, all is well. The FuM progress was good due to some very healthy investment returns, which has prompted an upgrade to the dividend-template projection. But niggles remain. Fees have been sliced lower, especially at Karpus. And significant new client money remains hard to attract. All told I do not envisage an imminent re-rating. More thoughts below.
Maynard
City of London Investment (CLIG)
Q2 Funds under Management published 20 January 2021
A mixed update. Good news on the wider FuM front, but niggles with lower fee rates and client withdrawals. The shares remain cheap, but an obvious re-rating does not appear imminent.
Here is the full text interspersed with my comments:
———————————————————– ——————————————————–
City of London (LSE: CLIG), a leading specialist asset management group offering a range of institutional and retail products investing primarily in closed-end funds, announces that on a consolidated basis, as at 31 December 2020, FuM were US$11.0 billion (£8.0 billion). This compares with US$5.5 billion (£4.4 billion) at the Group’s year end on 30 June 2020, which was before the merger with Karpus Management Inc (“KMI”) on 1 October 2020 (the “Completion Date”). A breakdown by strategy follows:
Strong investment performance across CLIG’s investment strategies resulted from significant discount narrowing and to a lesser extent good NAV performance.
During the period under review, CLIG flows were negative as clients rebalanced following significant equity market gains, with net outflows of circa US$290 million across the Group’s strategies.
With regard to business development, the Group continues to maintain an active pipeline across all of its major CEF offerings with an increased interest in the diversification CEF strategies.
———————————————————– ——————————————————–
A tad disappointing to read clients withdrew funds because of the rising market.
Excluding Karpus, the $150m net withdrawal was the largest quarterly outflow since CLIG started disclosing quarterly FuM movements three years ago.
This Q2 also marked the second consecutive quarter of net FuM outflows, the first time that has occurred since CLIG started disclosing quarterly FuM movements three years ago.
As mentioned in the blog post above, this business really has to enjoy notable client FuM inflows for the share to re-rate beyond its typical 10-12x P/E.
At least the Q2 investment returns were healthy. Total FuM before outflows gained $1,750m, or 18.4% growth based on Q1 FuM. I calculate EM funds advanced 24.7%, non-EM funds climbed 23.0% and Karpus funds gained 8.7%.
The investment returns propelled FuM for the original CLIG business to $7.2b — way ahead of the $6b-or-so high the original business had previously managed.
Note also ‘Other’ FuM, which has completely collapsed during the last six months. This time last year, the ‘Frontier’ strategy (now part of Other) managed more than $200m.
———————————————————– ——————————————————–
Operations
Following the completion of the merger with KMI on 1 October 2020, the Group’s income currently accrues at a weighted average rate of approximately 73 basis points of CLIM’s FuM and at approximately 77 basis points of KMI’s FuM, net of third party commissions. “Fixed” costs are c.£1.5 million per month, and accordingly the post-merger run-rate for operating profit, before profit-share is approximately £3.4 million per month based upon current FuM and a US$/£ exchange rate of US$1.367 to £1 as at 31 December 2020.
The Group estimates the unaudited profit before amortisation, exceptional items of c. £1.7 million in relation to the KMI merger and taxation for the six months ended 31 December 2020 to be approximately £11.6 million (2019: £6.3 million) and the unaudited profit before amortisation and taxation for the six months ended 31 December 2020 to be approximately £9.9 million (2019: £6.3 million).
Inclusive of our regulatory and statutory capital requirements, cash in the bank has risen from £14.6 million at 30 June 2020 to £17.5 million at the end of the calendar year, in addition to the seed investment of £4.1 million in the two REIT funds. Our cash reserves will allow us to continue managing the business conservatively through volatile markets while following our dividend policy for our shareholders.
The Company is currently in a close period which will end with the publication of results for the six months ended 31 December 2020 on 15 February 2021.
———————————————————– ——————————————————–
CLIG’s fee rate has been chipped lower once again, down a basis point to 73 basis points since Q1.
Of more concern is Karpus’ fee rate of 77 basis points, which is three points below the 80 basis points cited within the acquisition document. That document said the 80bps fee yield had been “historically stable”.
Difficult to say whether the lower fees are due to changes to the FuM mix, or due simply to customers demanding to pay less. CLIG’s overall fee rate has declined for years as the firm’s cheaper non-EM funds have become more popular among clients.
This Q2 statement did not clarify exactly the profit-share arrangements post-Karpus. (I have previously assumed profits from the original CLIG business are subject to the staff 30% profit-share pool, but profits from Karpus are not.)
As such, the £3.4m profit before profit-share per month can’t give us a clear profit picture just yet.
Nor can the six-month £11.6m pre-tax figure, as that consists of only three months of Karpus.
Cash gained £2.9m, or £8.2m if you add back the £5.3m dividend paid during the period. That £8.2m tallies with the stated £9.9m pre-tax profit after the merger costs.
———————————————————– ——————————————————–
Dividend
In recognition of the improved results and having regard to the current dividend cover policy the Board has decided to increase the interim dividend by 1p to 11p per share, which will be paid on 19 March 2021 to shareholders registered at the close of business on 5 March 2021. (2019: 10 pence)
———————————————————– ——————————————————–
Happy with that.
———————————————————– ——————————————————–
Dividend cover template
Please see dividend cover template attached here.
The dividend cover template shows the quarterly estimated cost of dividend against actual post-tax profits for last year, the current year and the assumed post-tax profit for next financial year based upon specified assumptions.
———————————————————– ——————————————————–
The major difference between this latest dividend-cover template and the previous version is the 2021/22 ‘to Reserves’ projection — which has been lifted from £8.3m…
…to £9.9m:
49.3m shares in issue (adjusted for Treasury shares) and a 31p per share dividend gives a £15.3m dividend payment. Add on the £9.9m of projected retained earnings gives £24.2m of possible 2021/22 earnings — equivalent to c48p per share.
The greater projected earnings are due to the higher FuM. The assumptions associated with the template have not changed:
CLIG still reckons it can attract net new client money of $385m ($250m+$135m) during the 18 months to June 2022. With total FuM of $11.0b, net new funds of $385m equates to 3.5% growth — hardly spectacular.
Again, as mentioned in the blog post above, the share-price will struggle to re-rate from the traditional 10-12x range without CLIG enjoying much greater client money inflows.
———————————————————– ——————————————————–
Barry Olliff’s share sales
The Company wishes to inform that, subject to being in an open period, Barry Olliff, Founder and Director, wishes to refresh his selling intentions to sell 250,000 shares at each of 475p, 500p and 525p. In addition, the Company will no longer provide trading intentions for Mr. Olliff post 30 June 2021, which is the Company’s year-end.
———————————————————– ——————————————————–
Seems fair, as Mr Olliff leaves his role as non-exec at this year’s AGM (held usually during October).
Note that Mr Olliff now reckons the price can reach 525p. The 2020 results had said his planned sales would be at 450p, 475p and 500p. Mr Olliff will retain 1 million shares after he sells the planned 750,000.
Maynard