02 January 2020
By Maynard Paton
Happy 2020! I hope you enjoyed last year’s positive market and that you continue to find my blog useful.
A quick summary of my portfolio’s 2019:
- Overall gain: 13.1%*;
- Nine shares went up and six shares went down;
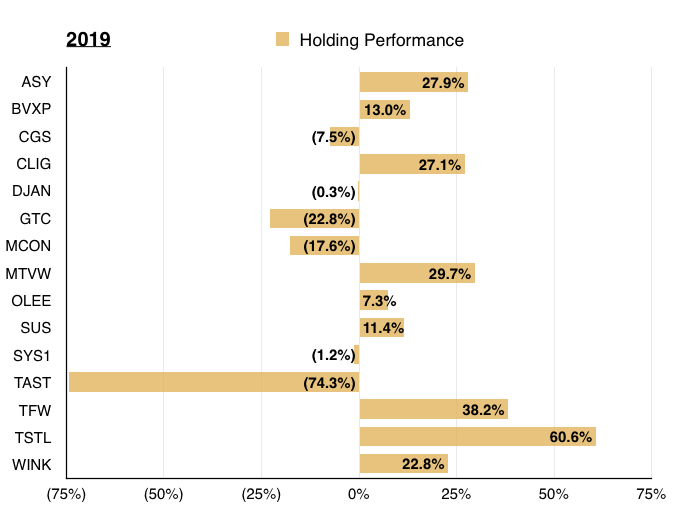
- Performances ranged from Tristel, up 61%, to Tasty, down 74%;
- Three shares were topped-up: Daejan, Mountview Estates and S&U, and;
- Three shares were sold entirely: Castings, Getech and Oleeo.
(*Performance calculated using quoted bid prices and includes all dealing costs, withholding taxes, broker-account fees and paid dividends)
Before I review my 2019 performance, let me first outline what happened during the final quarter of the year.
Contents
Q4 review
You may already know that I publish a portfolio review after every quarter. (Please click here to read all of my previous quarterly round-ups).
This post recaps my October/November/December activity.
Q4 share trades
I made two share trades during the fourth quarter. I sold my entire positions in Getech and Oleeo.
Getech
I sold Getech during November at 23p including all costs.
Last year I decided to exit my lower-conviction holdings, and Getech’s half-year statement re-emphasised drawbacks that I could no longer tolerate.
In particular, immediate earnings at this £9m software firm remain dictated by “lumpy”/one-off data sales — the timing and value of which are unpredictable.
Meanwhile, recurring revenue seems a long way off from covering the cost base — let alone helping to generate a decent profit and funding a dividend resumption.
Other sell factors included a high level of capitalised development costs, the less optimistic tone of the directors and the substantial dependence on a rising oil price for extra revenue.
I purchased Getech at 62p during 2013, at 59p during 2014 and at 25p during 2017. All told, I paid an average of 51p, collected dividends equivalent to 4p along the way and sold at 23p to register a 47% loss.
Oleeo
I sold Oleeo at 165p during December.
This disposal was essentially forced upon me, as Oleeo accompanied its 2019 annual figures with a bombshell tender offer and delisting proposal.
Shareholders could either accept the 165p per share tender offer, or remain invested in what would become a private company.
The prospect of owning shares in an unlisted £13m software firm — where significant product investment had depressed earnings for the last few years without too much additional revenue in return — was not appealing.
The tender price was not exactly generous, but at least a tender was provided (not all AIM shares that delist offer a cash exit). The tender also raised funds for my portfolio that will one day go towards higher-conviction holdings.
I purchased Oleeo (then known as World Career Networks) during 2015 at 320p and during 2016 at 182p. All told, I paid an average of 260p, collected dividends equivalent to 16p along the way and sold at 165p to register a 30% loss.
Q4 portfolio news
As usual I have kept watch on all of my existing holdings. The Q4 developments are summarised below:
- Modest progress at Daejan and Mountview Estates;
- Mixed news from System1;
- Delisting bombshell at Oleeo;
- No significant announcements from Andrews Sykes, City of London Investment, FW Thorpe, M Winkworth, Mincon, S&U and Tasty.
I have written a full review of all the shares I held during 2019 — simply click here for the complete run-down.
Full-year review
I always like to study my portfolio’s performance at the start of every year.
I am keen to discover where my gains and losses occurred during the previous twelve months, and check whether my portfolio decisions have become consistently good, bad or indifferent.
(Note: I compare my portfolio against the FTSE 100 total return index as this index is the main UK benchmark and I would invest in the FTSE 100 were I to give up stock-picking and become a passive investor. The FTSE 100 total return index includes reinvested dividends and excludes costs.)
2019 performance
The chart below compares my portfolio’s weekly 2019 progress (in green) to that of the FTSE 100 total return index (in blue):
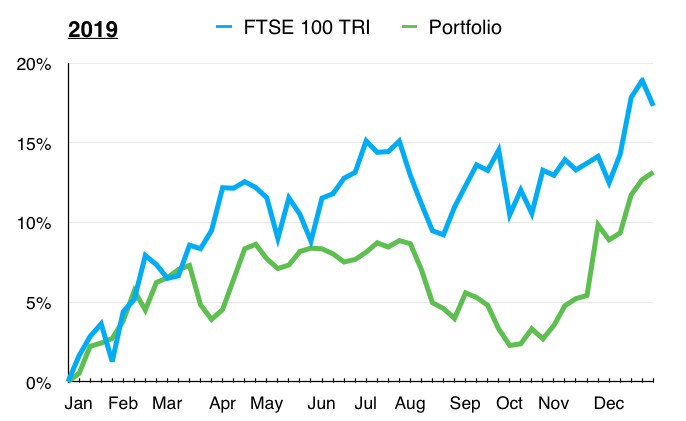
I finished up 13.1% while my benchmark finished up 17.3%.
As I noted throughout the year, my underperformance was due mostly to owning companies that were:
- Undergoing potential recoveries (Getech, Oleeo, System1 and Tasty);
- Experiencing flat earnings (Mincon and M Winkworth), or;
- Operating in an unloved sector (Daejan and Mountview Estates).
Running a cash balance that averaged almost 9% of my portfolio did not help either.
I am hopeful the outcome of the recent general election can provide a fillip to Daejan, Mountview Estates, FW Thorpe and M Winkworth — which have all cited the Brexit deadlock for keeping a lid on growth.
In the meantime I am convinced that investing in respectable businesses that offer decent accounts, capable managers and modest valuations remains a sensible long-term approach.
2015-2019 performance
The next chart compares my portfolio’s monthly progress to that of the FTSE 100 total return index. The chart commences at 2015, which coincides with me quitting conventional 9-to-5 employment to become a full-time-ish investor:
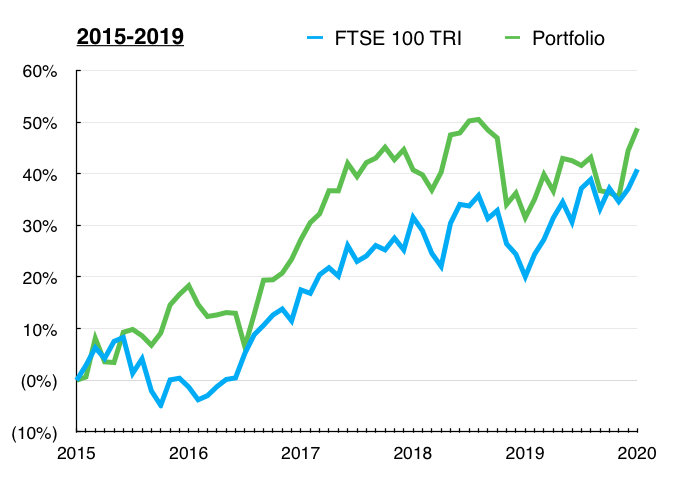
I am pleased I am ahead of the FTSE 100 on this five-year view — up 48.8% versus up 40.8%.
However, I have underperformed the FTSE 100 during three of the last five years:
| Year | My Portfolio | FTSE 100 TRI |
| 2012 | 46.1% | 10.0% |
| 2013 | 29.1% | 18.7% |
| 2014 | 16.0% | 0.7% |
| 2015 | 18.3% | (1.3%) |
| 2016 | 7.6% | 19.1% |
| 2017 | 10.5% | 11.9% |
| 2018 | (6.6%) | (8.7%) |
| 2019 | 13.1 | 17.3 |
| Compound return | 225.5% | 85.2% |
(My FIRE story contains details about my pre-2012 portfolio returns)
During recent years I concluded my gains were curbed by:
- Not having a regular salary to easily average down, and;
- Thinking too much about withdrawing capital for living expenses.
Living off a portfolio with no other income — and demanding market-trouncing performances, too — is hard work and not recommended. I am optimistic my results from 2020 will show an improvement.
Enjoy my blog posts through an occasional email newsletter. Click here for details.
Investment returns and portfolio contributions
Just to confirm, during 2019:
- I did not buy any new holdings;
- I did not top-slice any holdings, and;
- I left nine holdings untouched: Andrews Sykes, Bioventix, City of London Investment, M Winkworth, Mincon, FW Thorpe, System1, Tasty and Tristel.
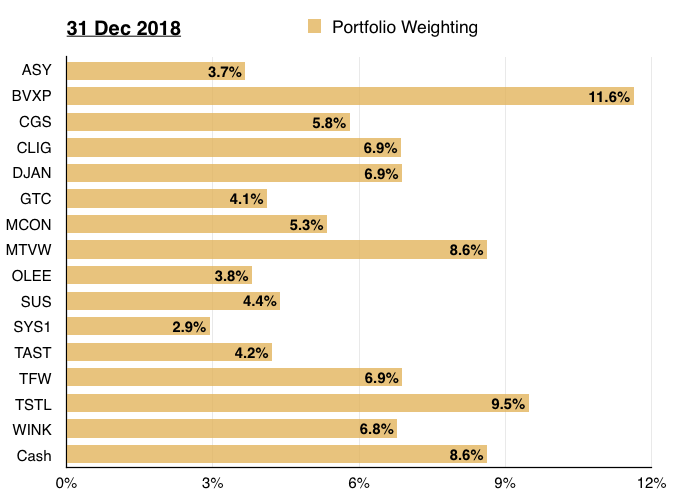
All the buys and sells meant my portfolio started the year like this…
…and finished the year like this:

This next chart shows the total return (that is, the capital gain/loss plus dividends received) each holding produced for me during the year:
And this chart shows each holding’s contribution towards my overall 13.1% gain:
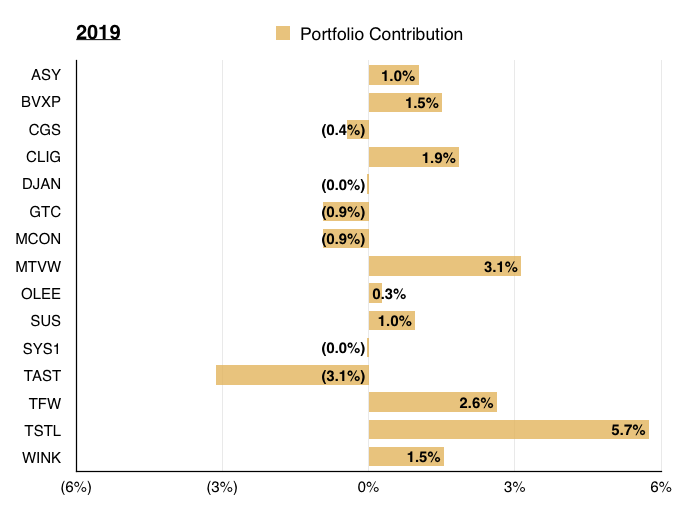
After the rough market of 2018 left my portfolio with only 4 winners from 16 holdings, I am pleased last year’s rebound ensured 9 of my 15 holdings recorded a gain:
| Year | Winners | Total shares | Winners/Total (%) |
| 2014 | 12 | 17 | 71 |
| 2015 | 13 | 18 | 72 |
| 2016 | 12 | 17 | 71 |
| 2017 | 13 | 17 | 76 |
| 2018 | 4 | 16 | 25 |
| 2019 | 9 | 15 | 60 |
Mind you, during 2019 only 6 of my 15 positions outperformed the FTSE 100’s 17.3% total return — which explains my portfolio’s lagging performance:
| Year | Outperformers | Total shares | Outperformers/Total (%) |
| 2014 | 12 | 17 | 71 |
| 2015 | 13 | 18 | 72 |
| 2016 | 6 | 17 | 35 |
| 2017 | 9 | 17 | 53 |
| 2018 | 10 | 16 | 63 |
| 2019 | 6 | 15 | 40 |
Tasty and my other losers knocked approximately 5% off my portfolio’s 2019 return. Had I sold all my losers at the start of the year, I would have just scraped ahead of the market.
Looking back, the only way I could have enjoyed a FTSE-thumping profit last year was to have owned more large winners.
Interestingly, each year my portfolio tends to exhibit only one or two large winners — and losers! — while most of the other shares do not really add much to the total performance.
For example, 8 of my 15 positions contributed total portfolio returns of between -1% and +1% during 2019.
Previous years have also witnessed the majority of my shares generally contributing very little to my portfolio’s annual result:
| Year | +/- 1% Contributors | Total shares | +/- 1% Contributors/Total (%) |
| 2014 | 11 | 17 | 65 |
| 2015 | 10 | 18 | 56 |
| 2016 | 11 | 17 | 65 |
| 2017 | 8 | 17 | 47 |
| 2018 | 11 | 16 | 69 |
| 2019 | 8 | 15 | 53 |
I am hopeful this trend may reverse during 2020, as my buys and sells of 2019 have increased the concentration of my portfolio.
My top five holdings now represent 53% of my portfolio (2018: 43%) while my bottom five represent 14% (2018: 19%).
The higher concentration ought to give each holding greater influence over my portfolio’s total performance.
Portfolio turnover, dividends collected and trading costs
Some other stats you may find interesting:
- Portfolio turnover: I can never remember how to calculate this ratio properly. But during 2019 I:
- Sold shares equivalent to 8.8%, and;
- Bought shares equivalent to 12.4% of my portfolio’s year-start value.
- Dividends collected:
- Company payouts represented a useful 3.66% of my portfolio’s year-start value.
- The income included special dividends from Bioventix and City of London Investment.
- Underlying dividend income climbed 18% due mainly to the top-ups of Mountview Estates and S&U.
- Trading costs:
- Dealing commissions, stamp duty and account-management fees represented an aggregate 0.11% of my portfolio’s year-start value.
So here we go into 2020, with my current investments confirmed below:
| Holding | Weighting 31 Dec 2019 (%) |
| Andrews Sykes | 4.0 |
| Bioventix | 11.2 |
| City of London Inv | 7.0 |
| Daejan | 8.4 |
| Mincon | 3.8 |
| Mountview Estates | 11.7 |
| S & U | 7.8 |
| System1 | 2.5 |
| Tasty | 1.0 |
| FW Thorpe | 8.3 |
| Tristel | 13.3 |
| M Winkworth | 6.9 |
| Cash | 14.1 |
| TOTAL | 100.0 |
As usual I have no idea what the market will do in the next twelve months. All I can say is that the FTSE 100 index and FTSE 100 total return index started 2020 at 7,542 and 6,981 respectively.
Until next time, I wish you happy and profitable investing.
Maynard Paton
PS: You can receive my blog posts through an occasional email newsletter. Click here for details.
Disclosure: Maynard owns shares in Andrews Sykes, Bioventix, City of London Investment, Daejan, Mincon, Mountview Estates, S&U, System1, Tasty, FW Thorpe, Tristel and M Winkworth.

Maynard,
Happy New Year to you and I wish you all the best with your Portfolio in 2020
Recent Tasty news has been most welcome with a corresponding spike up in the share price, well relatively
All the best
David
Hi David
Happy new year! Hopefully our portfolios can both do well in 2020. Not looked in detail, but the Tasty news does seem positive — at least in averting an immediate cash crisis. Not often I have owned one of the best performing shares of the current decade, but that is Tasty at the moment!
Maynard
Really enjoy reading your commentaries.
Best of luck for 2020.
Thanks Nick
Maynard