15 December 2023
By Maynard Paton
FY 2023 results summary for City of London Investment (CLIG):
- Ongoing market “headwinds” caused average funds under management (FuM) to decline 12% to $9.2b, which led to revenue dropping 16% and profit diving 29%.
- New USD reporting may expose CLIG’s prior progress benefitting from a weaker GBP, with the GBP dividend unchanged since FY 2021 versus the USD equivalent down 11%.
- Significant new clients remain very elusive, with FuM outflows of $357m during this FY prompted by higher deposits rates and CLIM funds returning 3% (or less) five-year CAGRs.
- The profit-share proportion increasing from 24% to 26% during a difficult FY raises further questions about employee pay and the likelihood of additional pressure on profit margins, earnings and ultimately the dividend.
- While CLIG’s own projections point to earnings of 34p per share that just about support the 33p payout and 10% yield, achieving the group’s total-return KPI to FY 2024 is looking increasingly uncertain. I continue to hold.
Contents
- News links, share data and disclosure
- Why I own CLIG
- Results summary
- Functional and reporting currency change
- Revenue, profit and dividend
- Funds under management: inflows and outflows
- Funds under management: capacity limitations and growth plans
- Funds under management: investment performance
- Funds under management: net fee rates
- Exchange-rate/post-tax profit matrix, other assumptions and employees
- Financials
- Valuation
News links, share data and disclosure
- Annual report and presentation for the twelve months to 30 June 2023 published 18 September 2023;
- Board and management update published 03 October 2023, and;
- Q1 2024 trading update published 13 October 2023.
- Share price: 320p
- Shares in issue: 50,679,095
- Market capitalisation: £162m
- Disclosure: Maynard owns shares in City of London Investment. This blog post contains SharePad affiliate links.
Why I own CLIG

- Fund manager that employs a “risk-averse” strategy of buying investment trusts at attractive discounts through a team-based approach (point 1) .
- Accounts showcase a high 39% margin, significant net cash and ability to distribute majority of earnings via dividends.
- Yield of 10% offers meaningful income potential with capital-gains upside linked to a wider market recovery — or winning extremely elusive new clients!
Further reading: My CLIG Buy report | All my CLIG posts | CLIG website
Results summary
Functional and reporting currency change
- July’s Q4 update had told shareholders this FY would be the last to report using GBP:
“The functional currency of the Company and the presentational currency of the Group will change to US dollars with effect from 1 July 2023.
The Group’s revenue is almost entirely US dollar based and the Board believes that this change will provide investors and other stakeholders with greater transparency of the Group’s performance and reduced foreign exchange volatility.
There will be no change in the Group’s dividend policy, and dividends will continue to be declared in GBP with an option for shareholders based in the US to elect to receive dividends in USD.”
- The switch to USD reporting makes sense. After all, this FY disclosed:
- 96% of clients (by revenue) are located in the United States;
- 65% of expenses are incurred in USD, and;
- 52% of CLIG shares are owned by investors based in North America.
- CLIG helpfully compared the GBP- and USD-denominated versions of this FY:
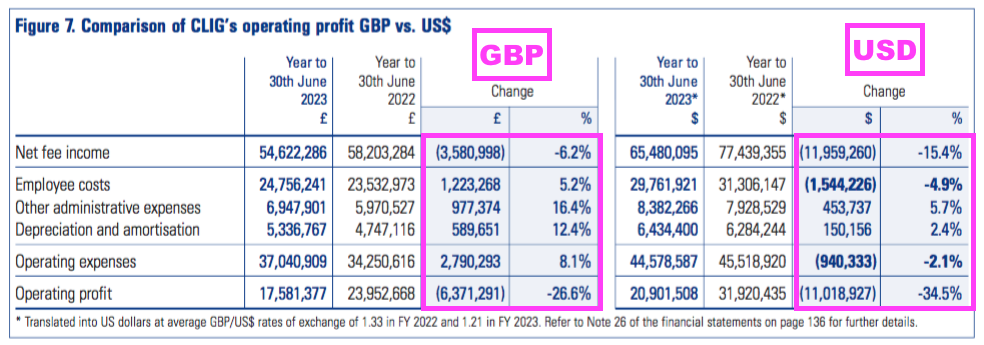
- GBP net fee income dropped 6%, while USD net fee income dropped 15%.
- GBP operating profit dropped 27%, while USD operating profit dropped 35%.
- CLIG provided complete USD-denominated income statements, balance sheets and cash flow statements for both this FY and the comparable FY.
- For FYs prior to FY 2022, I have translated the original GBP performances into USD using the average GBP:USD rate that prevailed during each FY.
- Although my translations are estimates and will not be entirely accurate, they do underline how CLIG’s GBP progress has benefitted from a stronger USD.
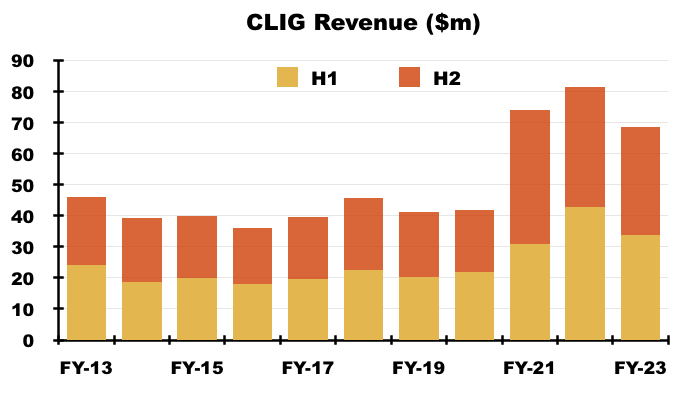
- For example, GBP revenue between FYs 2013 and 2023 advanced 95%…
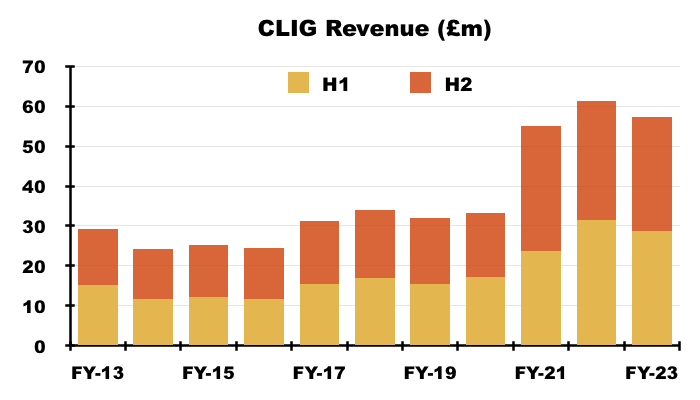
- …while USD revenue increased 49%:
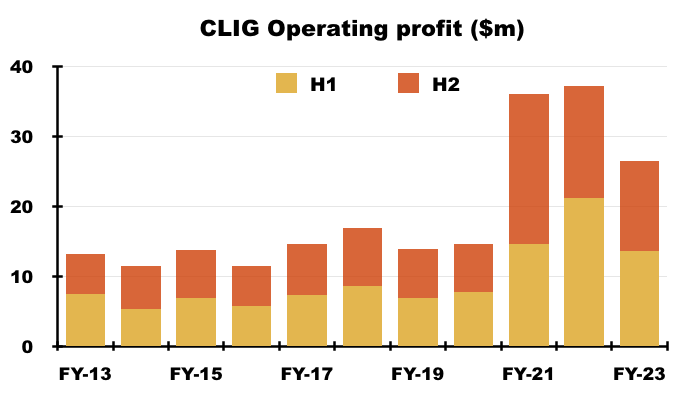
- Furthermore, GBP adjusted operating profit between FYs 2013 and 2023 gained 166%…
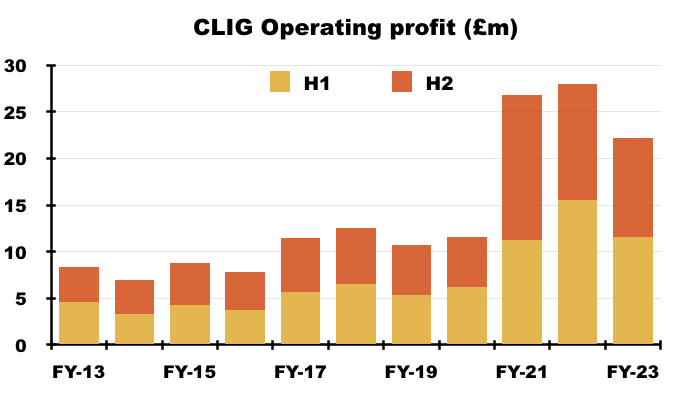
- …while USD adjusted operating profit improved 102%:
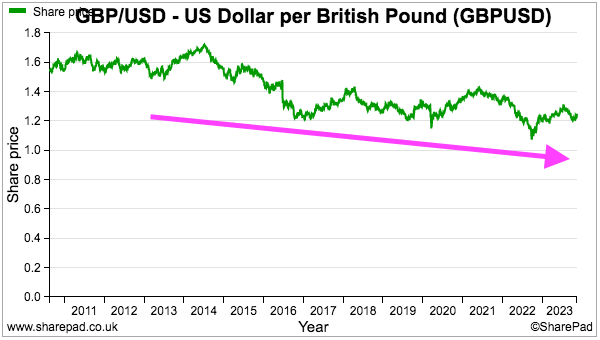
- GBP:USD averaged 1.57 during FY 2013 and 1.20 during FY 2023:
- CLIG’s dividend history gives further perspective to the GBP-USD comparison.
- The GBP payout was 24p per share for FY 2013 and 33p per share for this FY — an increase of 38%:
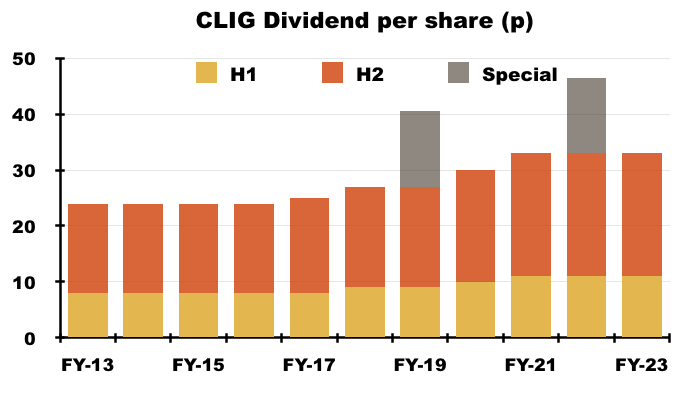
- But a USD payout would have gained only 6% — from 37.9 US cents to 40.1 US cents — during the same period:
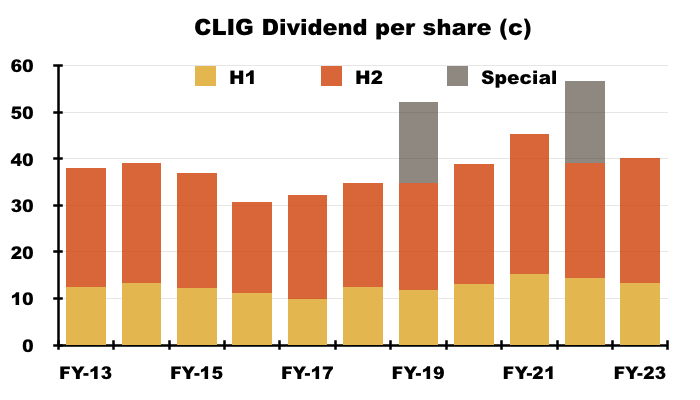
- Indeed, while CLIG has held its dividend at 33p per share between FY 2021 and this FY…
- …shareholders converting their 33p per share dividends into USD have suffered an 11% income decline (from 45.3 to 40.1 US cents)!
- CLIG said dividends would continue to be declared in GBP, although I suspect CLIG will first determine the payout using USD. After all, earnings will now be determined in USD and dividend payouts are of course are funded by earnings.
- CLIG’s dividend policy remains to cover the payout by 1.2x using adjusted earnings over a rolling five-year period.
- CLIG said:
“This [dividend-cover] policy was introduced in 2014 and was reviewed in 2019. No changes were proposed. It was designed to incorporate the required flexibility to deal with the potential volatility of CLIG’s income.
…
This is not a long-term policy. Rather, it will be reviewed after five years and every five years thereafter.”
- A dividend-policy review occurs next year, and may well prompt a rethink about:
- Measuring dividend cover with USD earnings and a GBP payout, and;
- Applying a 1.2x cover over rolling five-year periods.
- CLIG’s own projections indicate very thin dividend cover for FY 2024…
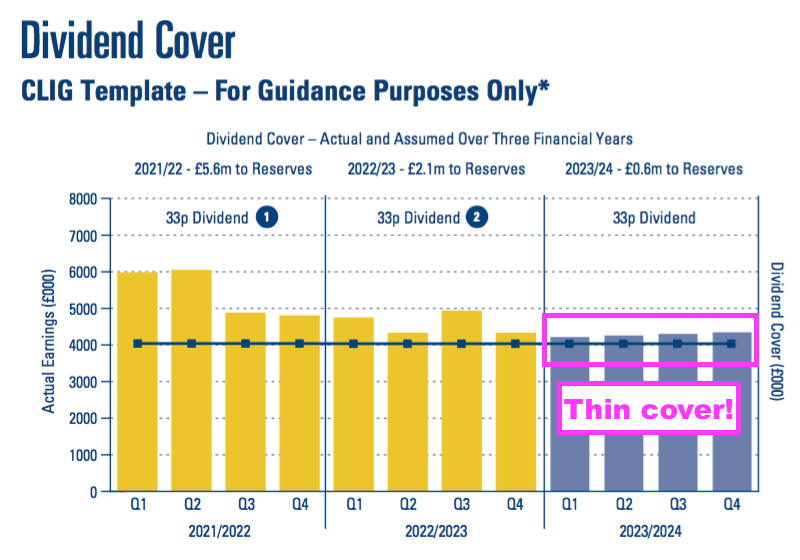
- …and further FuM declines will increase doubts about the current 33p per share payout (see Valuation).
- CLIG’s headline progress beyond this FY will no longer have a stronger USD to bolster the GBP performance.
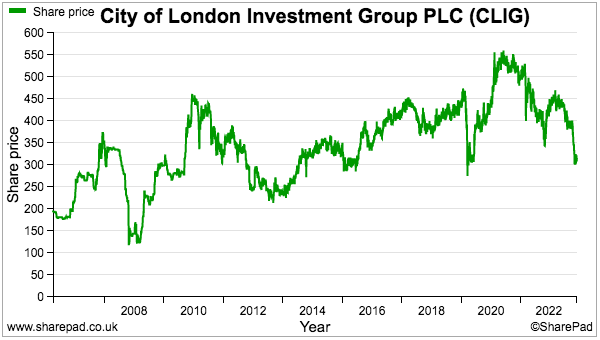
- CLIG’s (slower) USD progress may be another reason why the share price has barely moved during the last ten years:
- Starting with this FY, my blog write-ups will evaluate CLIG’s performance on a USD basis. Maybe I should have looked at CLIG in USD terms a lot sooner!
Revenue, profit and dividend
- This FY was never going to excite after:
- The preceding H1 revealed standstill funds under management (FuM), and;
- April’s Q3 update and July’s Q4 update indicated FuM had not changed significantly during H2.
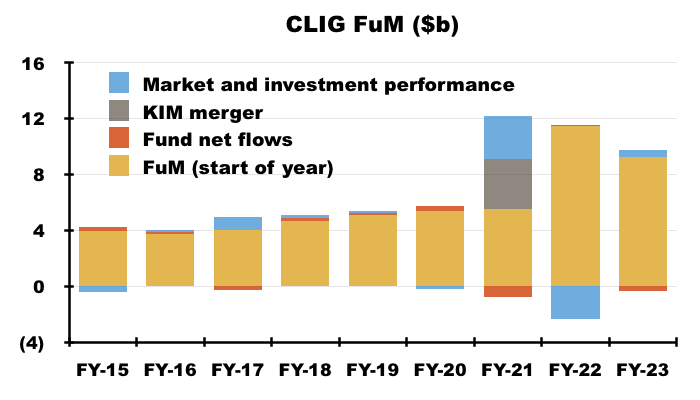
- FuM gained 3% during Q3 and remained unchanged during Q4 to leave FuM at $9.4b, up 2% on the comparable FY:
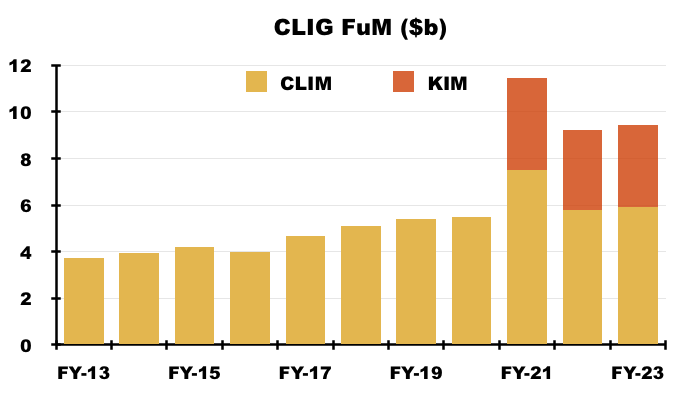
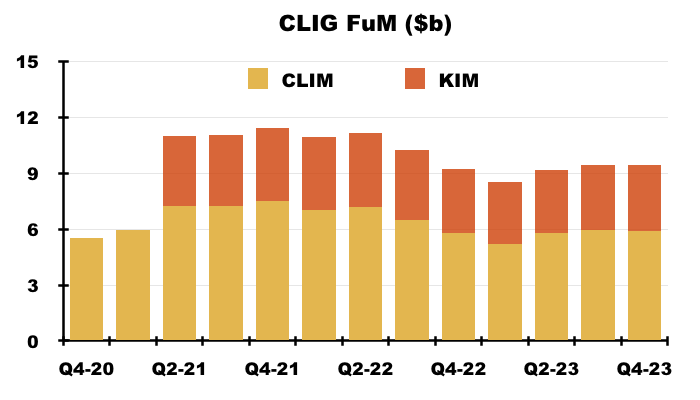
- FuM averaged $9.5b during H2 versus $9.0b during H1. FuM averaged $9.2b during the FY, 12% below the $10.5b average for the comparable FY.
- CLIG reiterated the market “headwinds” cited during the preceding H1:
“These [headwinds] included labour shortages, supply chain disruptions, and the war in Ukraine which led to steep declines in global stock and bond markets in 2022. More recently, the impact of higher interest rates and a weakening US commercial real estate market contributed to bank failures and credit rating downgrades of a number of US regional banks.”
- July’s Q4 update estimated profit before amortisation and tax for this FY to be “approximately £23.4m”.
- Profit before amortisation and tax was in fact below the projected £23.4m at £23.2m.
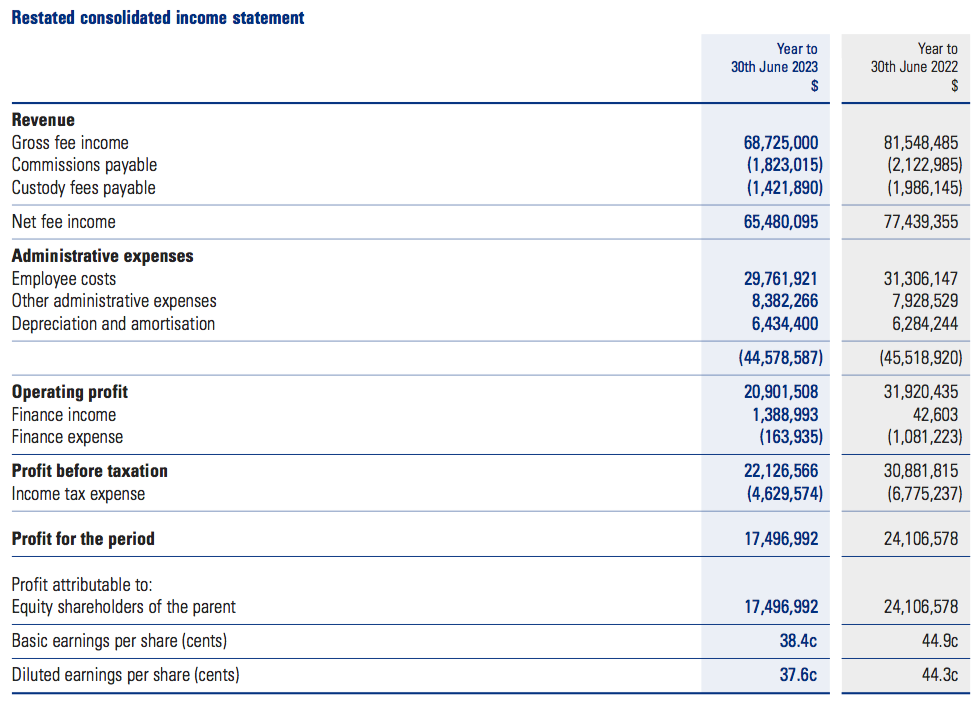
- The lower average FuM during this FY caused FY revenue to fall 16% to $68.7m:
- H2 revenue declined an estimated 9% to $35.0m.
- Lower fee rates also hurt revenue. The average net fee margin (i.e. after commissions and other direct costs) reduced from 73 to 72 basis points (see Funds under management: net fee rates).
- CLIG does not distinguish revenue from its original City of London Investment Management (CLIM) division and its £102m merger partner Karpus Investment Management (KIM).
- However, Companies House reveals CLIM reported FY 2023 revenue of £34.5m, which may translate to approximately $41.5m.
- KIM revenue for this FY may therefore have been $27.2m:
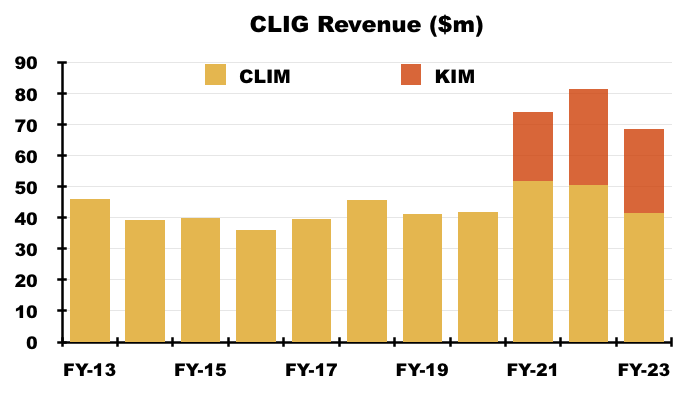
- My estimates suggest CLIM revenue fell 18% and KIM revenue declined 12% during this FY.
- Excluding amortisation of $5.6m associated with the KIM merger, FY operating profit was $26.5m and 29% less than the comparable FY ($37.4m).
- My estimates indicate:
- H1 operating profit excluding KIM amortisation was $13.6m and 36% lower than the comparable H1 ($21.2m), and;
- H2 operating profit excluding KIM amortisation was $12.9m and 20% lower than the comparable H2 ($16.1m):
- The sizeable FY profit shortfall versus the comparable FY reflected revenue sliding $12.8m and costs reducing by only $2.0m.
- Following this FY, CLIG’s Q1 2024 update during October admitted FuM had declined a further $543m to $8.9b (see Valuation).
- CLIG referred to its dividend-cover policy when declaring an unchanged 22p per share final payout:
“On the basis of unchanged dividend payments totalling 33p for the year as a whole, the cover ratio for the single year is 1.09, whereas the rolling five-year cover ratio, at 1.24, will remain marginally ahead of the 1.2 target level. Accordingly, your Board is recommending the payment of a final dividend of 22p per share…“
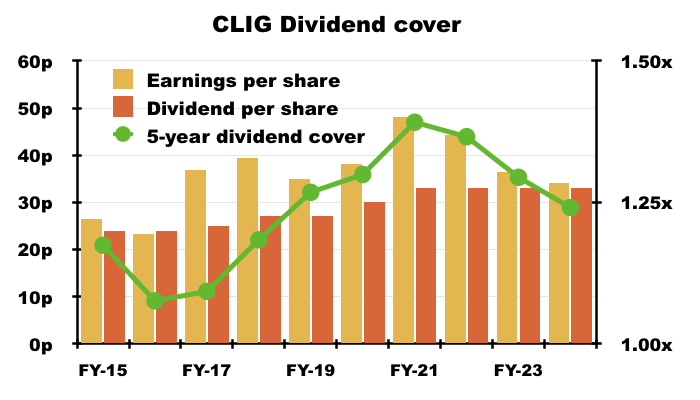
- The 33p per share annual payout has now been declared for three years:
- I am not sure if CLIG is calculating its five-year dividend-cover sums consistently. The slides showed FY 2020 adjusted earnings to be £7.6m:
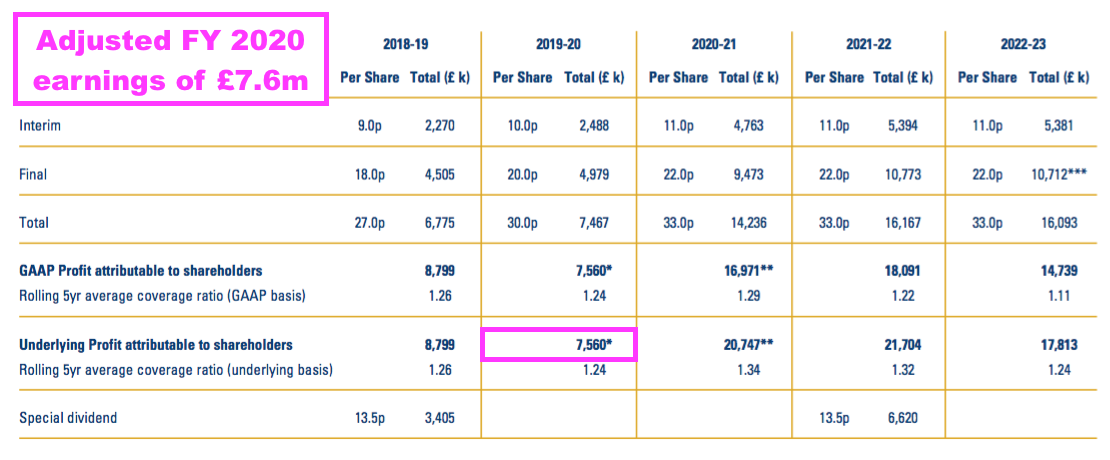
- But the FY 2021 accounts declared FY 2020 adjusted earnings to be £9.5m:
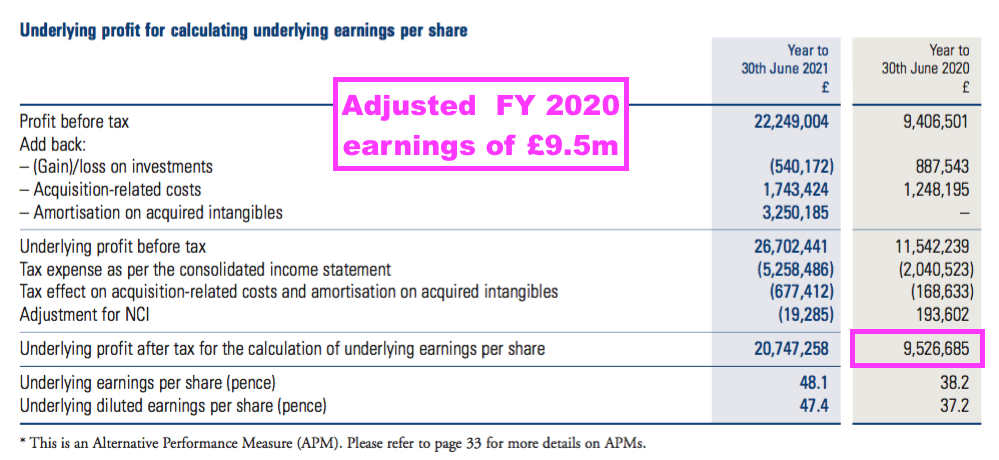
- Rolling five-year dividend cover using £9.5m rather than £7.6m for FY 2020 comes to 1.29x.
Funds under management: inflows and outflows
- CLIM’s FuM can be divided into two main categories:
- Emerging Markets (EM), and;
- Other strategies, which cover:
- Developed (or “International“) markets outside the United States;
- “Opportunistic Value“;
- “Frontier” markets, and;
- Seeded funds (REITs and “Global“).
- Both categories apply a long-standing value approach of buying UK- and US-listed investment trusts at attractive discounts and often taking an activist stance. CLIM customers are primarily institutional, although an EM fund-of-funds is offered to retail investors through intermediaries.
- KIM meanwhile manages fixed-income portfolios while also applying a value/discount approach to US investment trusts. KIM clients are mostly high-net worth individuals.
- For years CLIG has struggled to attract significant new client money.
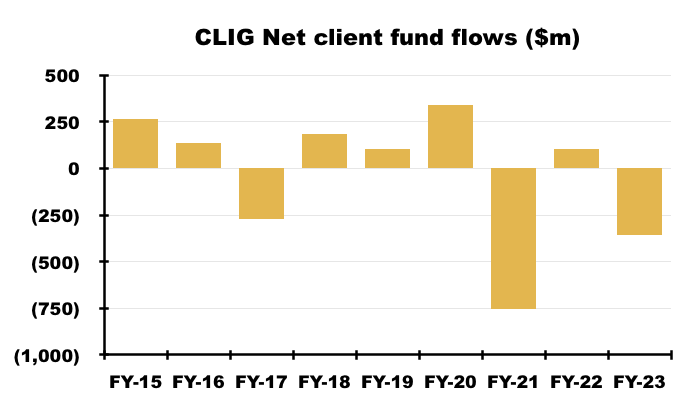
- The (very thin) red bars on the chart below show new client money has been minimal since FY 2015:
- Indeed, this FY witnessed net withdrawals of $357m that negated the net inflows of $102m enjoyed during the comparable FY…
- …and has left aggregate net outflows since FY 2015 at $249m:
- CLIG blamed higher interest rates and long-term EM underperformance for the lack of new CLIM money:
“With risk-free rates increasing, exposure to riskier asset classes are naturally being reduced by institutions. This is especially the case with EM and INTL, which are much further up the risk scale compared to US fixed income.“
“EM returns now lag US equities over two decades causing “EM fatigue” resulting in fewer new institutional mandates generated in the US.”
- KIM withdrawals were also blamed on higher interest rates tempting clients to invest elsewhere:
“…ongoing outflows occurred via lost accounts to attractive deposit rates that are FDIC-insured, individual expenses, taxes and required minimum distributions from retirement accounts.“
- KIM’s clients withdrew a net $129m during this FY to take total net KIM withdrawals since the merger to $430m:
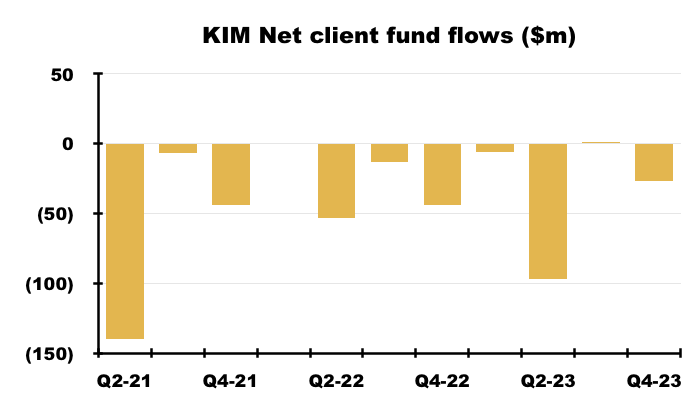
- KIM has yet to report a material net quarterly inflow of client money since the merger. Management during the 2022 AGM claimed KIM suffers “natural” outflows of $100m a year through clients withdrawing capital and income for retirement.
- FY KIM FuM at $3.4b remains less than the $3.6b held at the time of the (October 2020) merger.
- Alongside the $430m leaving KIM, CLIM clients have withdrawn a net $93m since FY 2016:
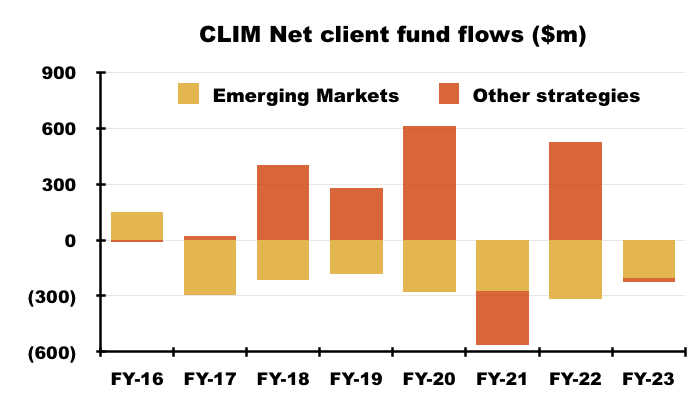
- Extra CLIM money received since FY 2017 has been directed entirely towards Other strategies, with consistent yearly net outflows from EM.
- In fact, this FY witnessed outflows of EM money extending to 14 of the last 16 quarters:
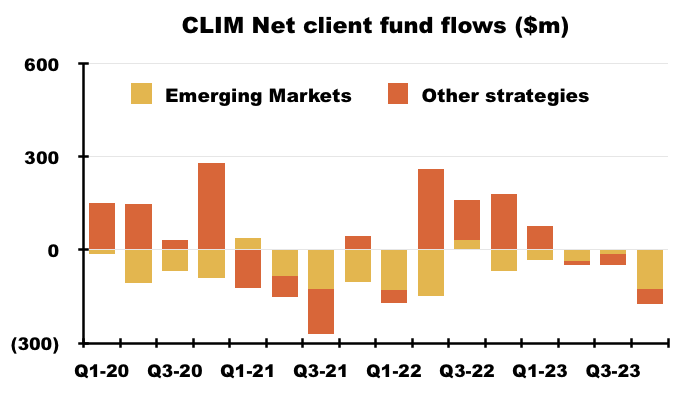
- Mind you, after enjoying net inflows of client money during five of the previous six FYs, Other strategies witnessed net outflows of $22m during this FY.
- This FY’s inflows and outflows had little effect on how FuM is split, with 38% still in EM, 37% still in KIM and 25% still in Other strategies:
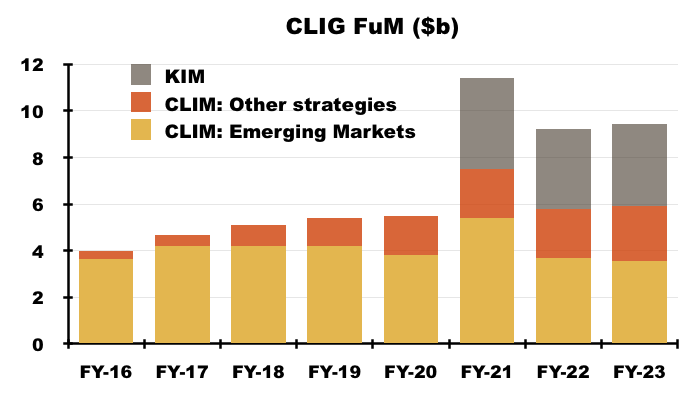
- 38% is the lowest proportion of EM FuM in CLIG’s history.
- EM funds represented 90% of client money during FY 2017, since when CLIG has deliberately diversified its FuM by developing the Other CLIM strategies and undertaking the KIM merger.
- At least CLIG’s largest client appears not to have withdrawn too much money during this FY. Its gross FY (GBP) fees declined 7% to match the FY (GBP) revenue decline:
“Included in revenues are fees of £5,402,756 (2022: £5,825,226) which arose from fee income from the Group’s largest client. No other single client contributed 10% or more to the Group’s revenue in either of the reporting periods.”
- Many CLIG clients are encouragingly loyal to the group. A fair number have employed CLIM or KIM for more than ten years:
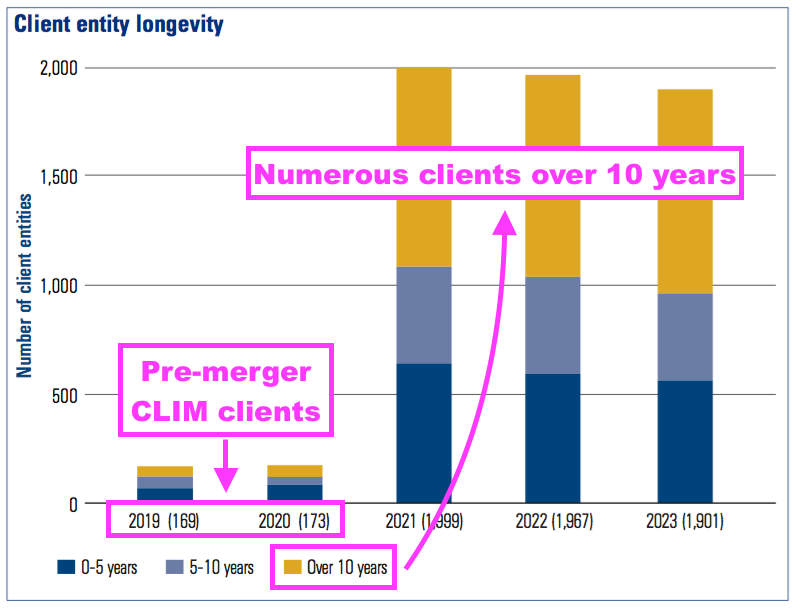
- Emphasising the lack of new client money, the 173 CLIM clients served before the KIM merger compares to 161 for FY 2014.
Funds under management: capacity limitations and growth plans
- CLIG said all of its CLIM strategies could accept extra client money:
“All investment strategies are open and have capacity at a time when attractive discounts across the closed-end fund universe are the focus of marketing efforts to consultants, institutional and wealth management clients“
- Mind you, the presentation reminded shareholders the EM strategy has “capacity” limitations:
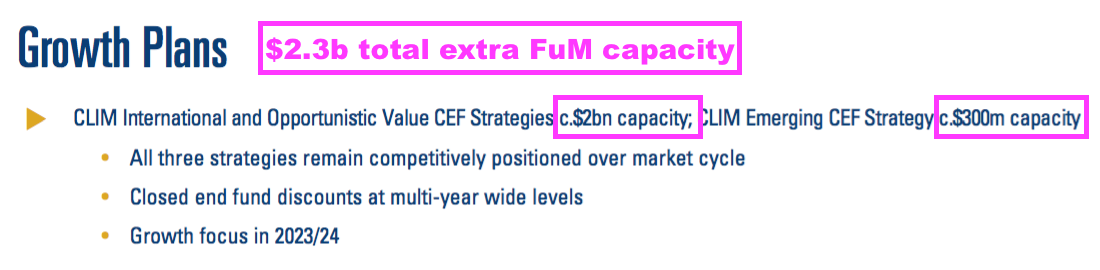
- Capacity problems occur when client money becomes too large to outperform because of the restricted size of the target universe of stocks.
- Available capacity of $300m for EM is equivalent to only 8% of total EM FuM of $3.6b.
- At least the powerpoint reiterated the International and Opportunistic Value strategies could handle extra client money of $2b, which is almost double the $2.2b FuM invested in such approaches.
- CLIG continues to believe $300m of new client money can be attracted during FY 2024:
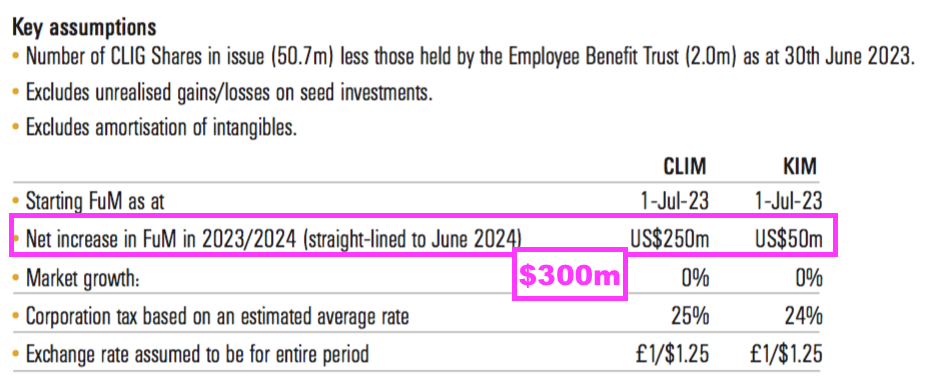
- An extra $300m is equivalent to only 3.2% of total FY FuM of $9.2b.
- Expecting new client money of $250m for CLIM is still not completely outrageous; CLIM attracted net inflows of $338m during FY 2020 and $265m during FY 2015.
- Continuing to expect any new KIM money seems ambitious given the division has suffered net withdrawals of $430m since the October 2020 merger.
- CLIG said a new appointment was tasked with lifting FuM:
“The integration of KIM is now complete. What remains is to leverage the strengths of the Group in order to raise new FuM across the Group. In this regard, we created a new position – Head of Corporate Partnerships – to deepen our existing client relationships, particularly as baby boomers transfer wealth to the next generation, and build new partnerships with professional organisations. This individual, who has over twenty years of experience in the field, is also responsible for branding opportunities, unique client experiences, and increasing the profile for the Group.”
- Prompted “primarily [by] retirements”, KIM has recruited a number of new client-facing employees:
“We invested in the KIM business… A marketing support team was set up to coordinate relationships with investment platforms and assist with on-boarding clients from new relationships. A dedicated manager of the Relationship Management team was hired to build a more effective system of oversight and reporting on activities. Two experienced Relationship Managers were hired to develop new client opportunities, including those related to generational wealth strategies.”
- I do wonder whether CLIG should outsource its promotional efforts to a more capable marketing organisation.
- After all:
- Buying investment trusts is not the most glamorous of equity strategies;
- CLIM’s heritage — emerging markets — has underperformed long term, and;
- The group’s “team approach” does not lend itself to the inherent marketing advantages of employing a super-star investor.
- CLIG previously employed North Bridge Capital to help promote its funds, until marketing was brought in-house during FY 2009:
(AR 2009): “Towards the end of 2008 a marketing manager was appointed to implement our decision to bring our US marketing in-house, and ultimately therefore to avoid the commissions which we have historically paid to North Bridge Capital who have served us well since we started the US marketing activity. He will be responsible for developing direct relationships with the consultant industry which advises institutional investors.”
- Commissions to North Bridge represented 15% of revenue during FY 2009.
- Assisted by North Bridge, CLIM FuM between FYs 2004 and 2008 went from less than $1b to almost $5b…
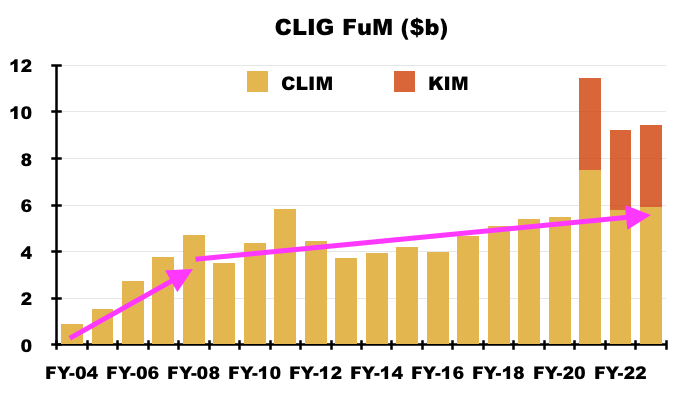
- …yet during the next 15 years (without North Bridge) CLIM FuM has climbed to only $6b. (North Bridge may no longer exist.)
- KIM in contrast utilises the services of external investment advisers. Sales commissions for this FY were $1.8m, which I estimate to be 8% of KIM’s FY revenue.
- KIM’s FuM has shown greater growth over time:
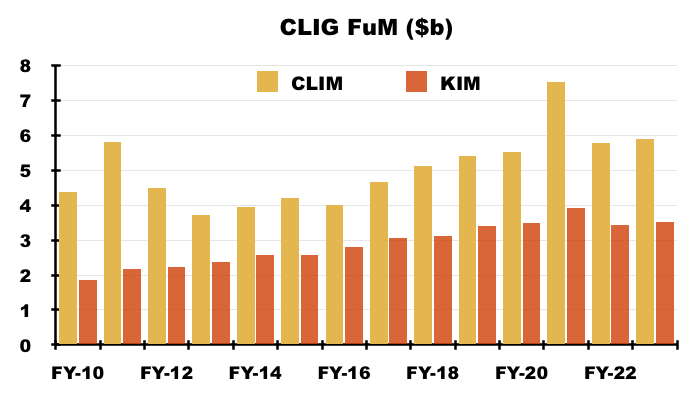
- Since FY 2010, KIM’s FuM has compounded at an average 5.0% a year while CLIM’s FuM has compounded at an average 2.3% a year.
- CLIG may argue external marketing could attract the wrong type of ‘hot money’ clients, although the line “A few fund managers have encouraged hot money. CoL avoids it” has not been used in a CLIG presentation since 2019.
- CLIG’s seeded funds have yet to attract significant client money.
- Two REIT funds were seeded during January 2019, and FuM deemed “Other/REIT” was $88m at this FY.
- CLIG’s seeded investments were carried at $10m, and my reading of the 2023 annual report indicates the group’s EM REIT may have $25m of client money and the two other seeded funds have no client money.
- While the preceding H1 suggested CLIG was prepared to buy somebody else’s FuM…
“We will also continue to evaluate external business opportunities that may appear in the aftermath of a challenging 2022 for many investment advisers.“
- …this FY did not mention any potential acquisition activity.
Funds under management: investment performance
- CLIG described a largely positive (relative) investment performance for this FY:
“Despite wider discounts for all CEF strategies, investment performance was ahead of benchmark for the bulk of CLIM’s assets for the year ended 30th June 2023 due to strong NAV performance in the Emerging Market (EM) strategy. The International (INTL) strategy was slightly behind benchmark over the period while the Opportunistic Value (OV) strategy outperformed. KIM’s taxable fixed income, conservative balanced and SPAC strategies outperformed their market indices over the period, while equity strategies lagged their benchmarks.”
- The 2023 annual report small-print claimed:
“Our investment horizon is five years, and over this period the three strategies that make up ~99% of CLIM’s Funds under Management are all outperforming their peers and benchmark. Long and short-term performance remains solid, with the KIM investment process continuing to add value on behalf of clients in the face of volatile markets.”
- Contrary to that small-print, this FY did not show all three CLIM strategies outperforming over the last five years.
- The EM and International approaches have indeed outperformed their associated benchmarks during the last five years…
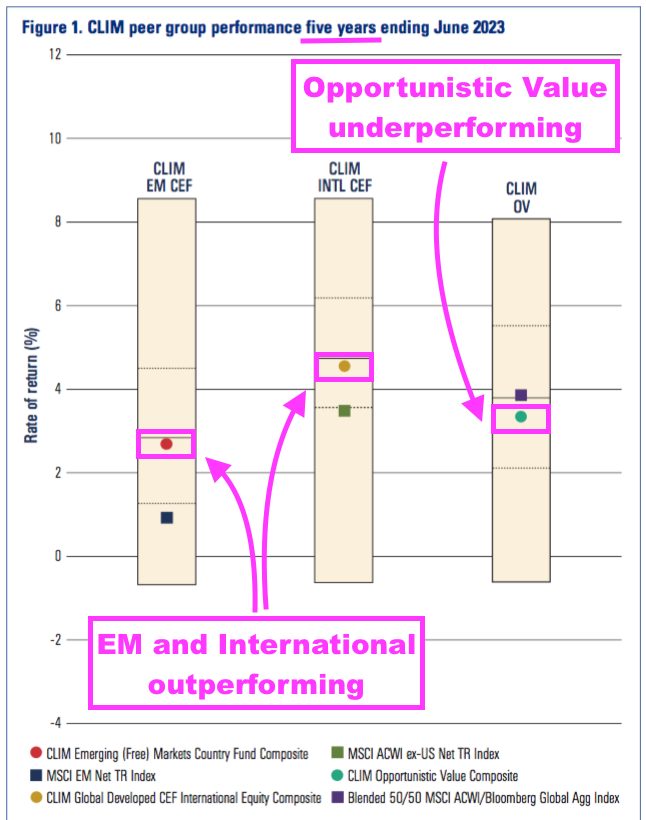
- …and even the last ten years:
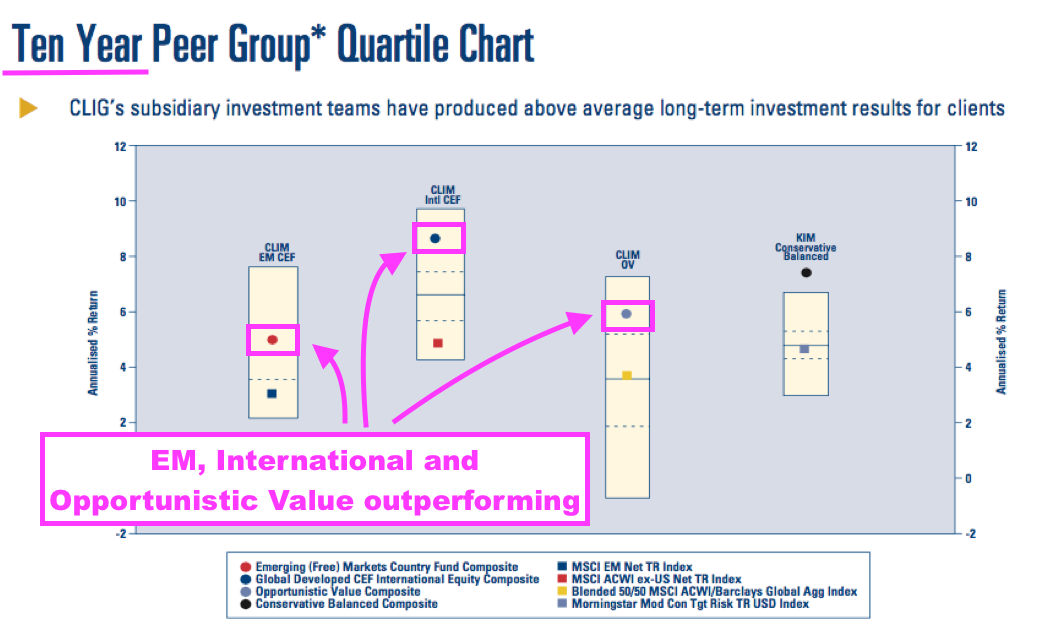
- But Opportunistic Value has underperformed during the last five years (but has outperformed during the last ten).
- The EM and International performances reveal an unusual phenomenon: the associated benchmarks are fourth-quartile performers over both five years and ten years.
- Benchmarks languishing in the fourth quartile may also explain why CLIM has struggled to attract new client money — lots of rival funds within the same sector can also claim benchmark-beating returns.
- Note that the EM and International approaches are within the top two quartiles over ten years, but are within the third quartile over five years. Their relative performances seem therefore to have subsided of late, which may also explain the lack of new client money.
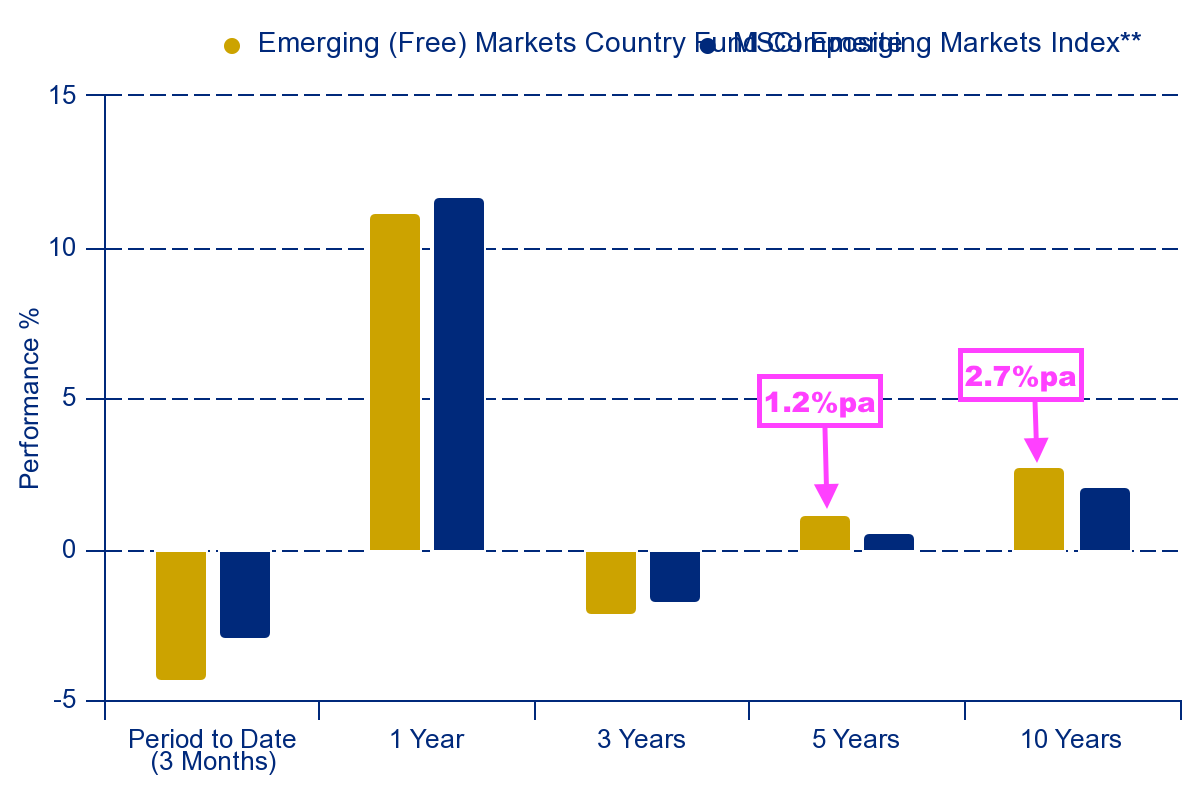
- CLIM’s website underlines the subsiding investment performance.
- The EM strategy has returned a 1.2% compound average over five years and 2.7% over ten:
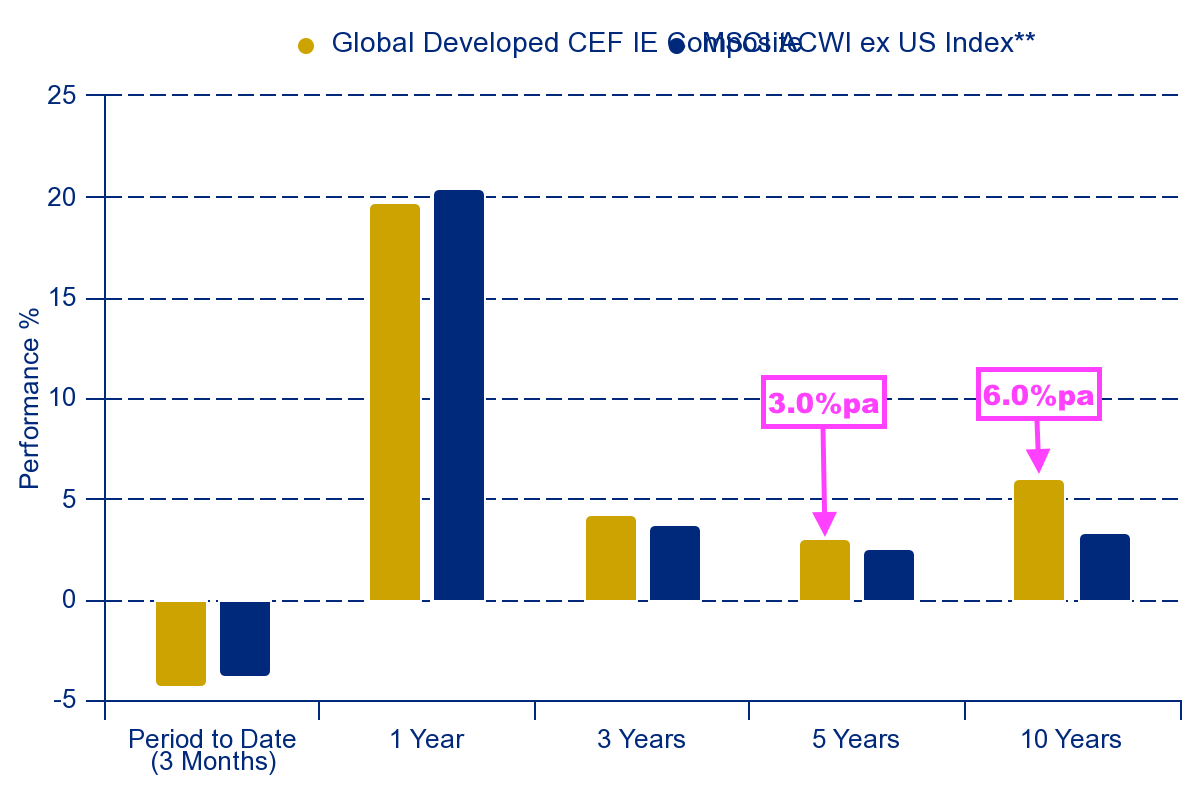
- The International strategy has returned a 3.0% compound average over five years and 6.0% over ten:
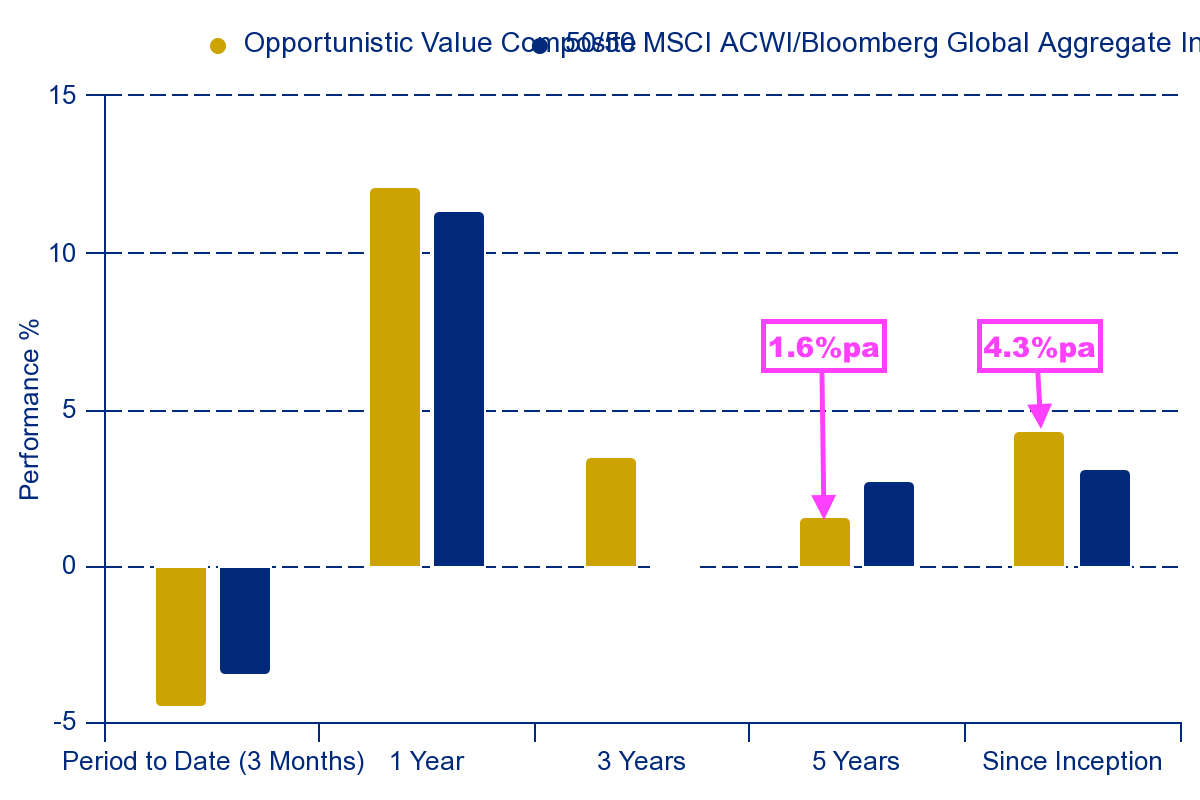
- The Opportunistic Value strategy has returned a 1.6% compound average over five years and 4.3% since its 2014 inception:
- KIM’s performances have been greater and more consistent than those of CLIM.
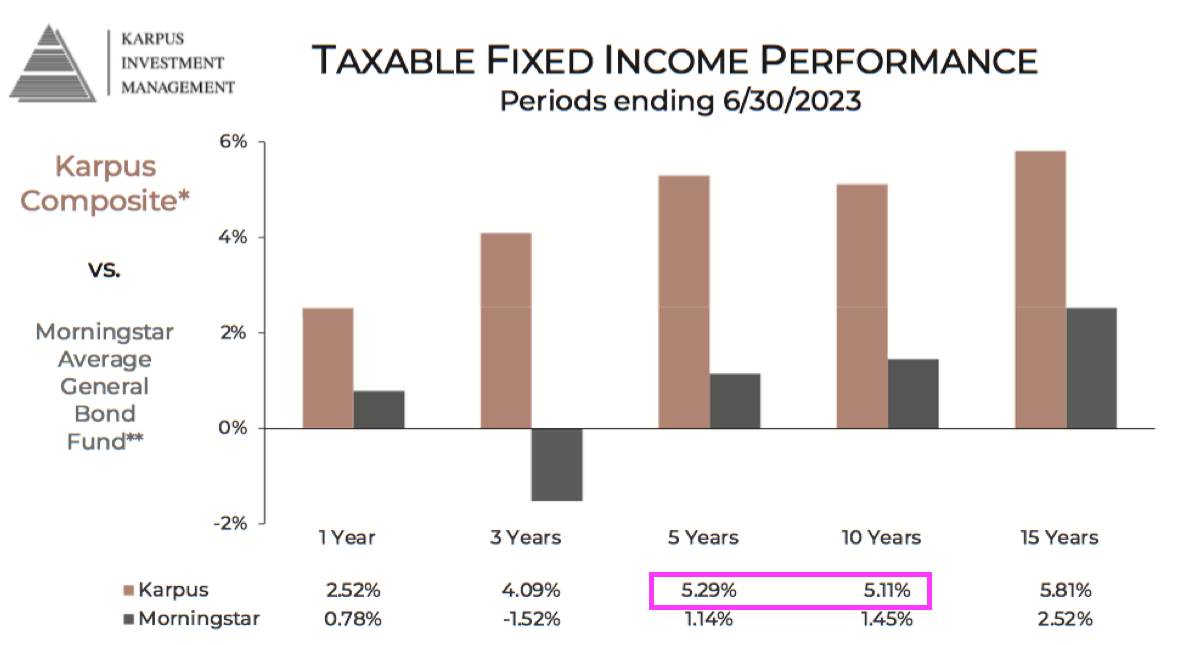
- KIM’s Fixed Income for example has returned a 5.3% compound average over five years and 5.1% over ten:
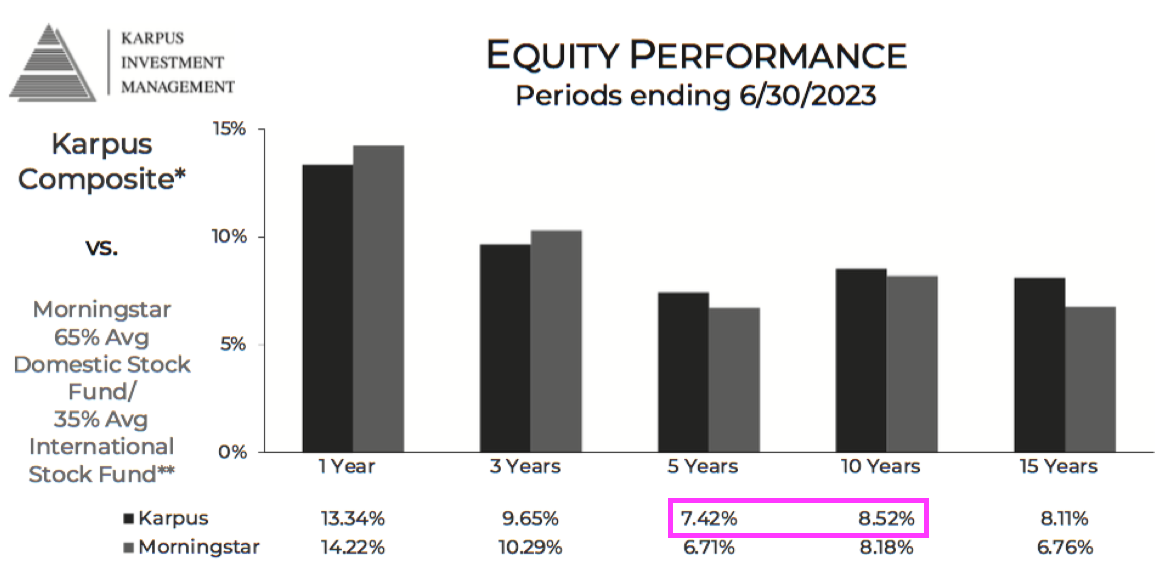
- Equity Management has meanwhile returned a 7.4% compound average over five years and 8.5% over ten:
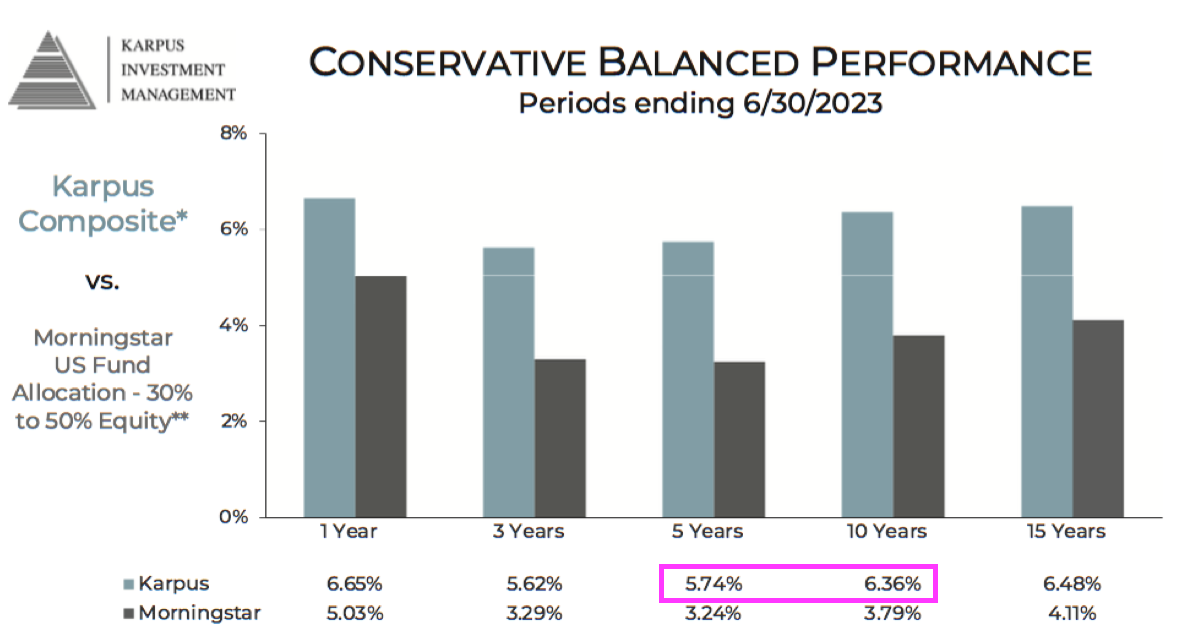
- And Conservative Balanced (a mix of fixed income and equities) has returned a 5.7% compound average over five years and 6.4% over ten:
- CLIG’s investment returns — and those of the group’s benchmarks — trailed the major world indices by some distance during this FY:

- References to “bubble” and “bandwagon” were employed to explain the lower returns for clients versus the global markets:
“[Today,] we find that the “magnificent-seven” stocks are valued at US$11 trillion or twice the level of the entire Japanese stock market and more than 20% of the entire US stock market. Whether or not this has taken this handful of companies into unsustainable “bubble” territory is for others to decide but in the six months to 30th June 2023, they accounted for more than 70% of the rise in the S&P 500 index, underlining the degree to which the recent strength in US equities has been driven by a narrow and powerful “Artificial Intelligence (AI)-bandwagon”.
- The S&P 500 has been the index to own during the last decade. The iShares S&P 500 ETF (CSPX) has delivered double-digit annualised (USD) gains:
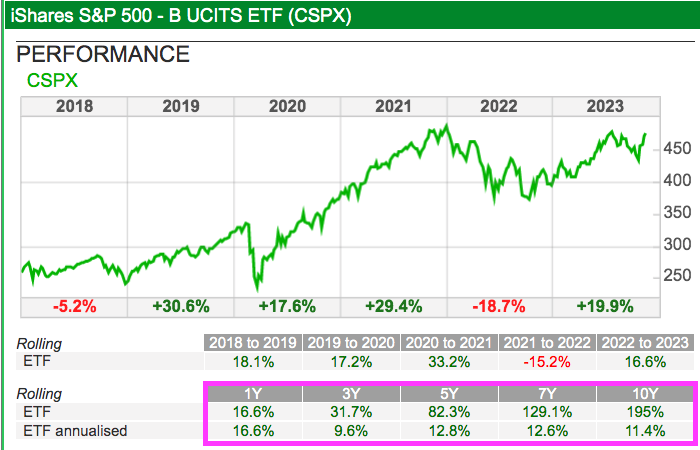
- I remain convinced prospective clients have compared CLIG’s funds to the S&P 500 rather than its chosen benchmarks, which would also explain the minimal new client money won during recent years.
- I raised the subject of the S&P 500’s strong performance during last year’s AGM.
- Management admitted at that AGM some clients had asked in trustee meetings: “What are we doing in emerging markets when the S&P 500 has outperformed?”.
- But management also suggested the S&P 500 outperformance would one day revert to underperformance: “Things can not go up for ever, they will eventually stop”.
- Hope of better times ahead for unloved investment trusts may be supported by historically wide discounts.
- This FY claimed equity investment trusts currently trade at an overall 11% discount — a level seen previously only at times of market stress:
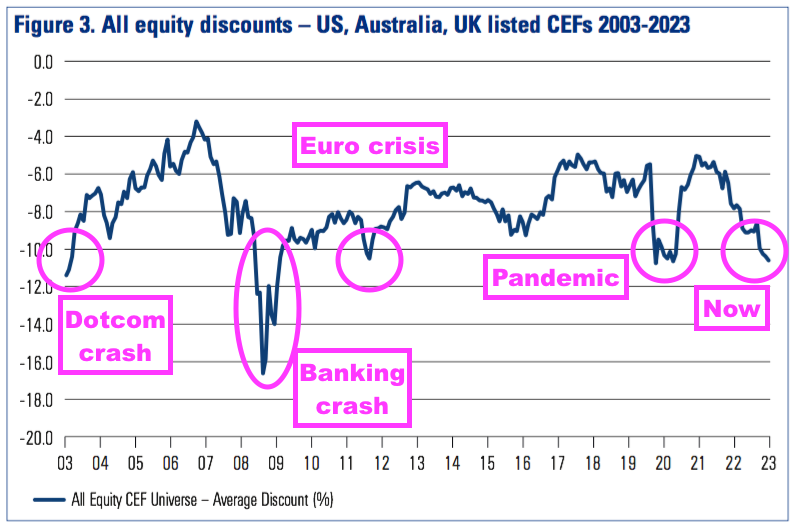
- Activists are becoming attracted to the sector, too, with Saba Capital in particular taking notable stakes in several UK trusts and engaging with their respective boards.
- NAV (and ultimately share price) progress at investment trusts is dictated by the underlying holdings, although I am not sure whether CLIG investigates the underlying holdings to ensure they are appropriate investments.
- CLIG’s 2023 stewardship report instead describes the group’s attention to corporate governance and stewardship principals.
- Shareholders still await market conditions that allow CLIM/KIM to record positive returns and outperform the major global indices, which in turn could attract more clients.
- CLIG’s relative returns have not improved following this FY.
- During CLIG’s Q1 2024 (July to September 2023), CLIM’s strategies returned an estimated negative 3.8%, KIM’s portfolios returned an estimated negative 4.8% while the S&P 500 (CSPX) returned a negative 2.5% (see Valuation).
- Sad to say, but the forthcoming retirement of CLIM’s veteran chief investment officer may actually herald enhanced returns for CLIM’s clients:
“Mark Dwyer, CLIM CIO, has announced his intention to retire from the firm on 30th June 2024. Mark has been with the firm for over 20 years having served as the Head of EM CEF Strategy. We wish him the very best in his retirement.
Oliver Marschner, senior CLIM Portfolio Manager, will assume responsibility for the EM CEF Strategy from 1st January 2024.“
Funds under management: net fee rates
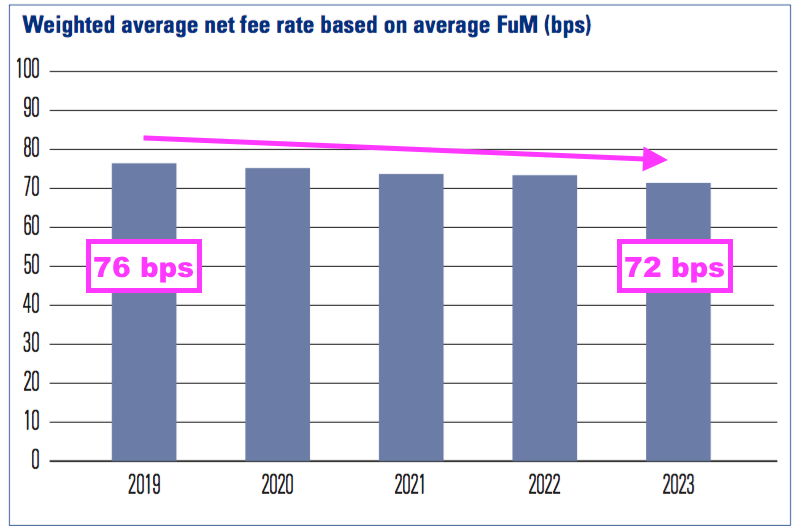
- CLIG said group fee rates had dropped a basis point to 72 basis points versus the comparable FY:
“The Group’s average net fee margin for the year was 72bps (2022: 73bps).
- However, April’s Q3 update and July’s Q4 update admitted fee rates had fallen a further two basis points during H2:
(Q3) “The Group’s income currently accrues at a weighted average rate of approximately 71 basis points of FuM, net of third-party commissions“
(Q4) “The Group’s income currently accrues at a weighted average rate of approximately 71 basis points of FuM, net of third party commissions.”
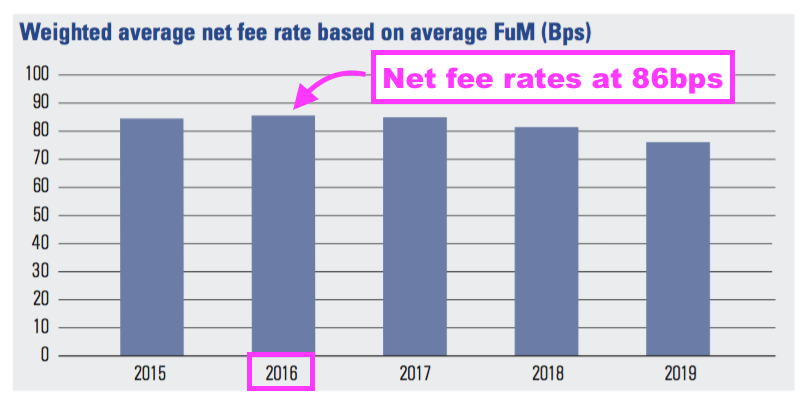
- This latest reduction extends a long trend of clients chipping away at fees:
- The fee rate was 86 basis points during FY 2016:
- I had previously believed the introduction of lower-fee strategies such as International had influenced the overall group fee rate.
- But with CLIG’s FuM split remaining at 38% EM, 37% KIM and 25% Other strategies during H2, I can’t see different FuM proportions affecting the overall group fee rate this time.
- Markets generally suffered a rough calendar 2022, and I speculate clients kicked off calendar 2023 by demanding lower fees.
- Following this FY, October’s Q1 2024 update disclosed a further fee reduction to 70 basis points:
“The Group’s income currently accrues at a weighted average rate of approximately 70 basis points, net of third party commissions.”
- Reduced disclosure also hints at clients chipping away at fees.
- CLIG did not publish an exchange-rate/post-tax profit matrix for this FY. The matrix for the preceding H1 showed CLIM fees at 71 basis points and KIM fees at 76 basis points:
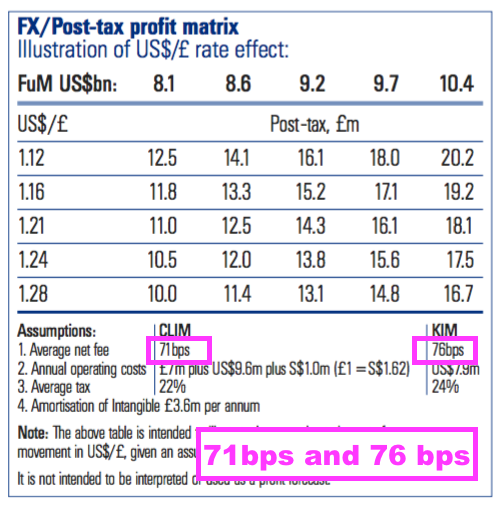
- With group fee rates now at 70 basis points, I surmise fee rates have declined significantly at both CLIM and KIM.
- The CLIM/KIM merger document (point 5) — published only three years ago! — claimed KIM enjoyed a “fairly stable” net fee rate of 80 basis points.
“Q3. Fee margins have clearly been under pressure. How well is the company doing in the current markets?
A3. The company is doing well, but is obviously under ongoing pressure, particularly from institutional clients and their consultants (those consultants often being paid on an incentivised basis linked to success in reducing fees charged by CLIG). Pricing with HNWIs [high net worth individuals] is more stable. The days when fees were materially higher (pre-financial crash) will not return. In essence, the company agreed that it had to grow FuM in order to generate any extra revenue.”
- I was not aware consultants employed by clients were incentivised to reduce fees paid to CLIG.
- I believe fee rates will not stabilise until CLIM’s investment performance improves.
- After all, if typical CLIM clients have indeed earned net annual returns of c3% (i.e. 300 basis points) during the last five years, then fees at 70 basis points a year would have captured c20% of their gains.
- In contrast, holders of that S&P 500 ETF delivering double-digit returns would have given away c1% of their gains through fees of ten (or less) basis points.
Exchange-rate/post-tax profit matrix, other assumptions and employees
- The absence of an exchange-rate/post-tax profit matrix for this FY was perhaps not surprising given the change to USD reporting.
- The matrix had previously provided a guide to possible earnings based on FuM and the GBP:USD exchange rate:
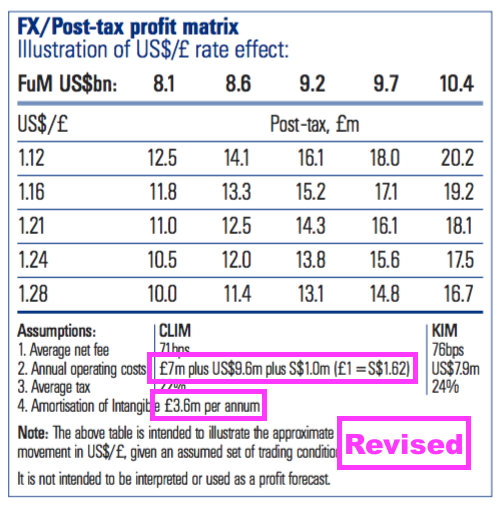
- But the matrix also supplied useful assumptions for shareholders to track, not least fee rates (see Funds under management: net fees rates) and operating costs.
- The matrix had become somewhat obsolete following the KIM merger, as the profit-share assumption shown up until FY 2020 was dropped…
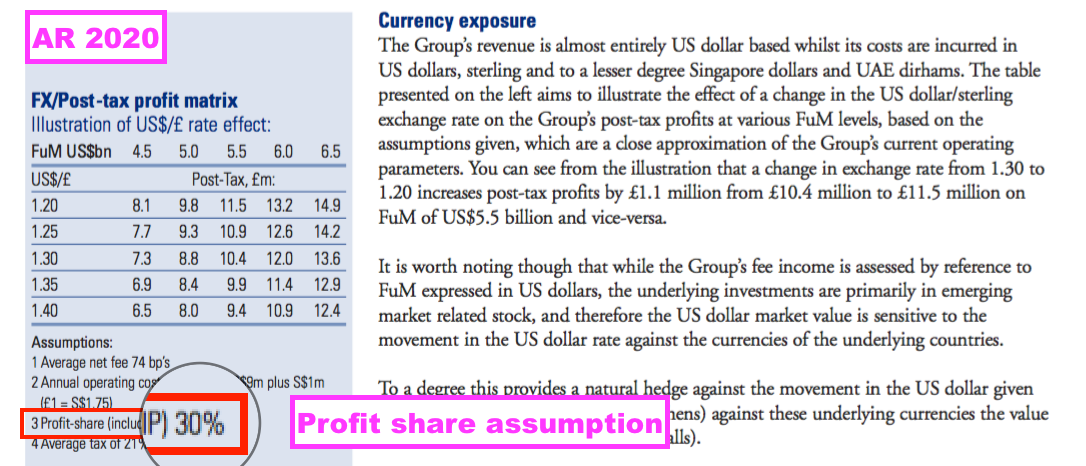
- …and the projected earnings could not be independently calculated.
- This FY saw CLIG drop its overhead assumptions within its dividend-cover template:
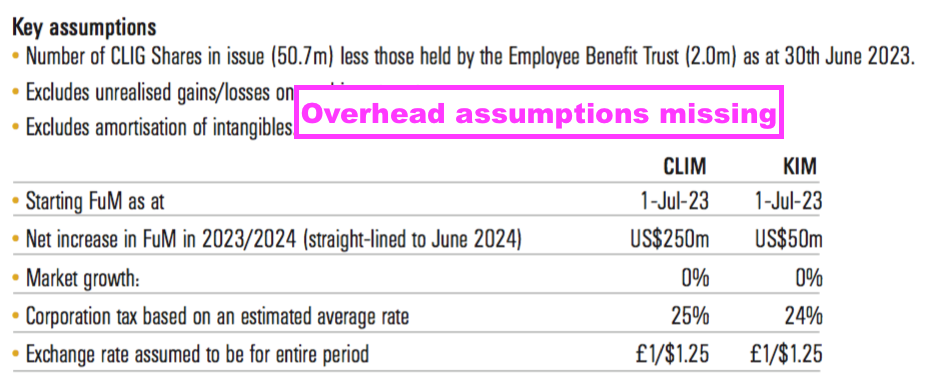
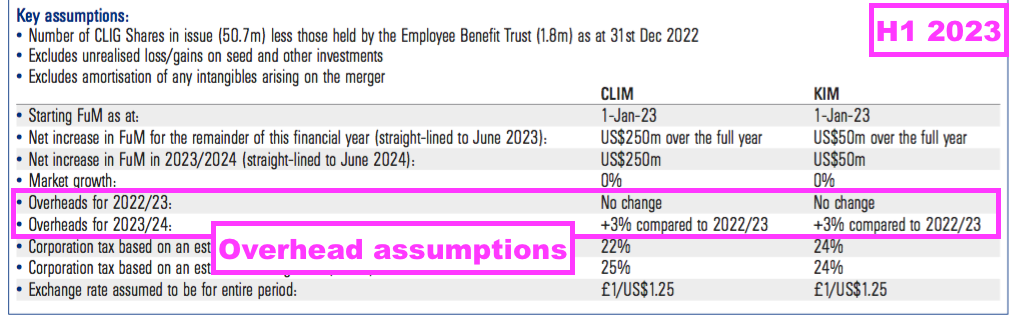
- Dropping the overhead assumptions raises suspicions of overheads continuing to increase.
- CLIG admitted FY overheads (excluding certain items) in GBP advanced by 14%, but claimed they would not advance as much for FY 2024:
“Total overheads before profit share, EIP, share option charge and investments gains/(losses)* for the year to 30th June 2023 rose by 14% to £22.5 million (2022: £19.7 million), reflecting higher business development spending in comparison with the previous year, when Covid-related travel constraints limited outlays on marketing initiatives, together with ongoing investment in the Group’s IT infrastructure and inflation-related increases in payroll costs. Although cost inflation remains a concern, it is anticipated that the rate of growth in the Group’s cost base will moderate in the coming year.“
- I calculate those overheads climbed 3% in USD terms.
- CLIG’s largest overheads are employee salaries and the staff profit-share scheme.
- This FY indicated a 26.5% profit share (in GBP), versus 23.9% for FY 2022 and 22.2% for FY 2021:
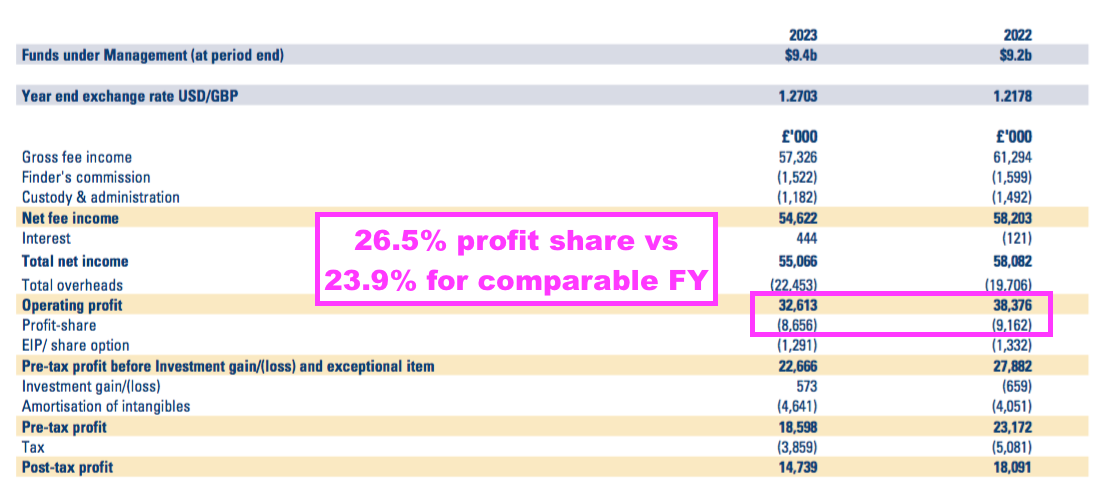
- Did employees deserve a higher percentage profit share during this FY, which saw average FuM decline, average fee rates decline and profit decline?
- I have never been sure whether CLIG’s profit-share scheme has actually incentivised the workforce to expand the business.
- Between FYs 2015 and 2023, CLIG’s wages and salaries totalled $88m… and were enhanced 80% by aggregate profit-sharing payments of $70m.
- Yet the same nine-year period also witnessed a minimal aggregate inflow of net client money (see Funds under management: inflows and outflows):
- The last decade has not shown obvious (USD) revenue-per-employee productivity improvements either:
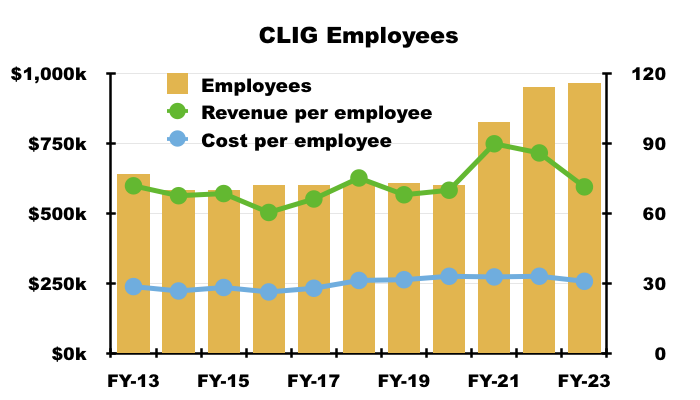
- The average employee cost (including profit share) for this FY was $257k.
Financials
- CLIG remains a high-margin business, although not as high as it once was.
- Operating profit before amortisation represented a super 39% of revenue during this FY. But I estimate the proportion fell from 40% during H1 to 37% during H2:
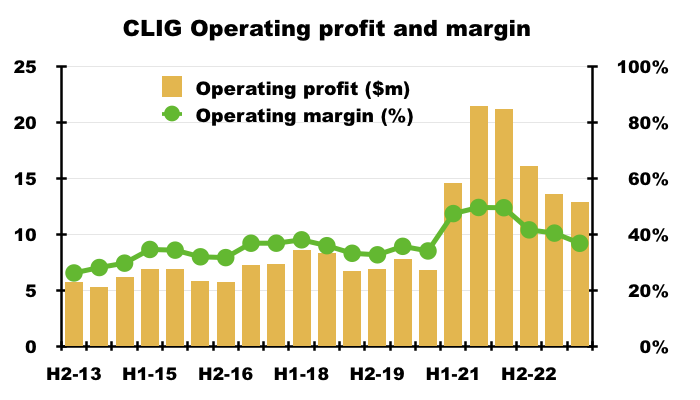
- The margin was 49% during FY 2021 and 46% during FY 2022 — supported by KIM’s super pre-merger 60% margin (point 8).
- The comparable FY suggested KIM’s margin was 54.5% (point 12c):
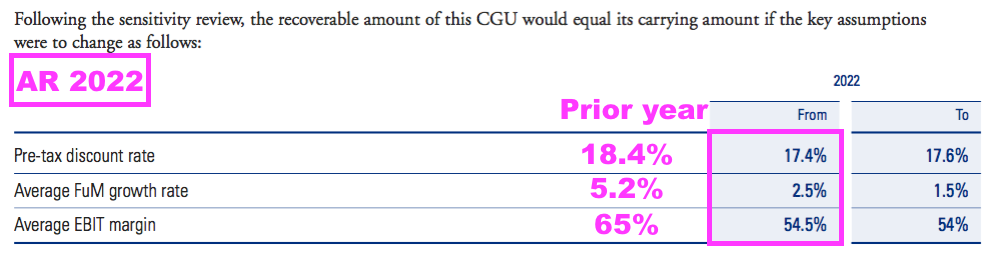
- The same small-print for this FY did not disclose a KIM margin:
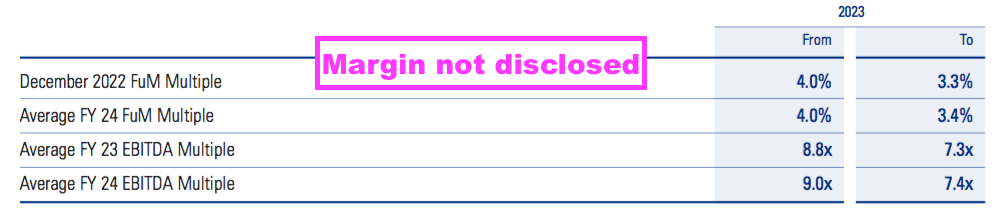
- But the small-print did suggest KIM’s margin would decline further, with costs projected to grow faster than revenue:
“The annual growth rate used for extrapolating revenue forecasts was 1.5% and for direct costs was 3.0% based on the Group’s expectation of future growth of the [KIM] business.”
- Lower fee rates without commensurate FuM advances and/or reduced overheads will inevitably squeeze future margins.
- The text below is a regular fixture within CLIG’s annual reports:
“Keeping overheads down is good business practice as it provides more money for dividends, bonuses and reserves, and thus assists with relative job security.“
- Shareholders can only trust management will indeed maintain this “good business practice” to limit further margin declines.
- The balance sheet showed cash at $28.6m, investments at $10m and conventional bank debt of zero.
- FY interest on the cash was a handy $700k, with nearly $500k earned during H2.
- Cash conversion for this FY was once again very acceptable, with capex remaining low and working-capital management still very creditable:
| Year to 30 June | 2019 | 2020 | 2021 | 2022 | 2023 |
| Operating profit* ($k) | 13,594 | 14,621 | 36,056 | 37,314 | 26,484 |
| Depreciation and amortisation* ($k) | 397 | 368 | 305 | 266 | 283 |
| Net capital expenditure ($k) | (545) | (99) | (125) | (345) | (577) |
| Working-capital movement ($k) | 1,157 | 86 | 3,174 | 3,121 | (143) |
| Net cash and investments ($k) | 23,146 | 22,818 | 41,070 | 36,671 | 38,588 |
(*Excluding intangible KIM-acquisition amortisation)
- Adjusted earnings of $21.4m translated into free cash after tax, capex, working-capital movements and lease payments of $21.9m.
- The $19.3m spent on dividends and a net $3.0m spent on shares for the Employee Benefit Trust (EBT) then left overall cash $0.5m lighter.
- CLIG’s EBT expense reflects the true cash cost of the employee share scheme and is worth monitoring.
- Between FYs 2019 and 2023, the EBT spent $14.2m buying shares to satisfy exercised options and received $2.8m from those exercised options — equating to a net shareholder cost of $11.4m.
- In contrast, the associated accounting charge during that same period was $5.4m.
- Expensing the full EBT cash cost through the income statement would have reduced CLIG’s five-year aggregate $113m adjusted operating profit by 5%.
- The EBT purchased shares at an average 411p during this FY. Purchases subsequent to the year end were undertaken at 350p, 345p and 310p.
- Return on equity and similar ratios don’t seem relevant to CLIG. Earnings growth is driven inherently by attracting greater FuM, which in turn is not directly correlated to profit being retained as cash or reinvested into tangible items such as computers and office furniture.
- CLIG’s accounts remain free of defined-benefit pension obligations.
Valuation
- CLIG’s outlook perhaps optimistically cited a “foundation for growth“:
“Despite a challenging year, we believe the work done over the past twelve months has laid the foundation for growth. With a following wind, we are optimistic that the Group is well positioned to go further together given the complementary strengths of CLIM and KIM, attractive CEF discounts, and value in a number of asset classes managed by the Group.”
- This FY included a revised dividend-cover chart.
- The previous version had predicted earnings of £1.0m would be retained for FY 2024.
- But the new version now predicts £0.6m will be retained for FY 2024:
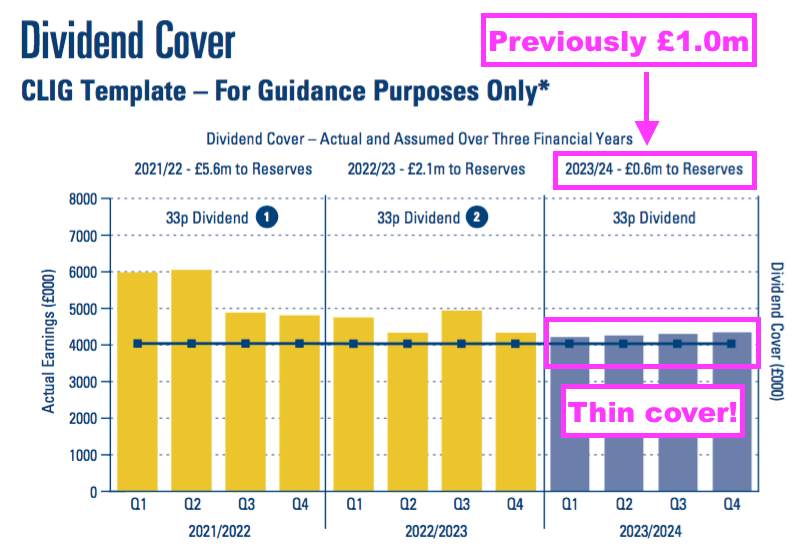
- The revised £0.6m is equivalent to 1p per share and, when added to the 33p per share dividend, implies FY 2024 earnings might now be 34p per share.
- I calculate CLIG’s rolling five-year dividend cover (in GBP) will be 1.24x by FY 2024 assuming:
- Earnings of 34p per share for FY 2024, and;
- The 33p per share dividend is maintained:
- CLIG’s 1.2x target dividend cover for rolling five-year periods — alongside the aforementioned $28.6m (c44p per share) cash position — ought to mean the 33p per share payout can be sustained during FY 2024.
- That said, the Q1 2024 (July-September 2023) update published during October was not encouraging:
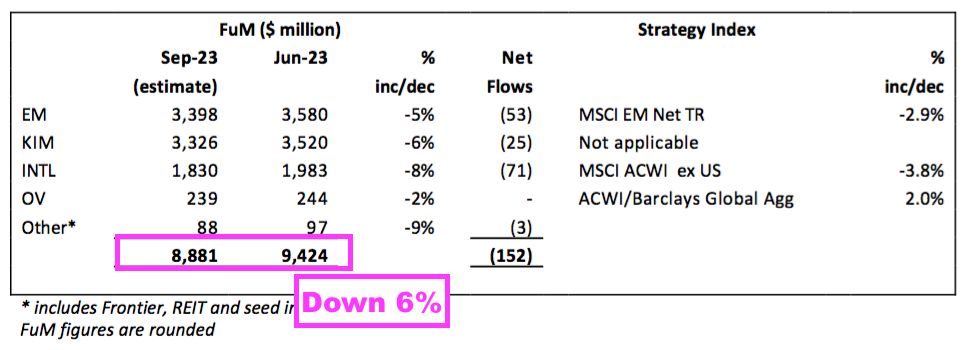
- Q1 2024 FuM declined 6% to $8.9b, with clients withdrawing a net $152m and negative returns losing $391m.
- CLIG’s website then shows FuM sliding further to $8.5b during October:
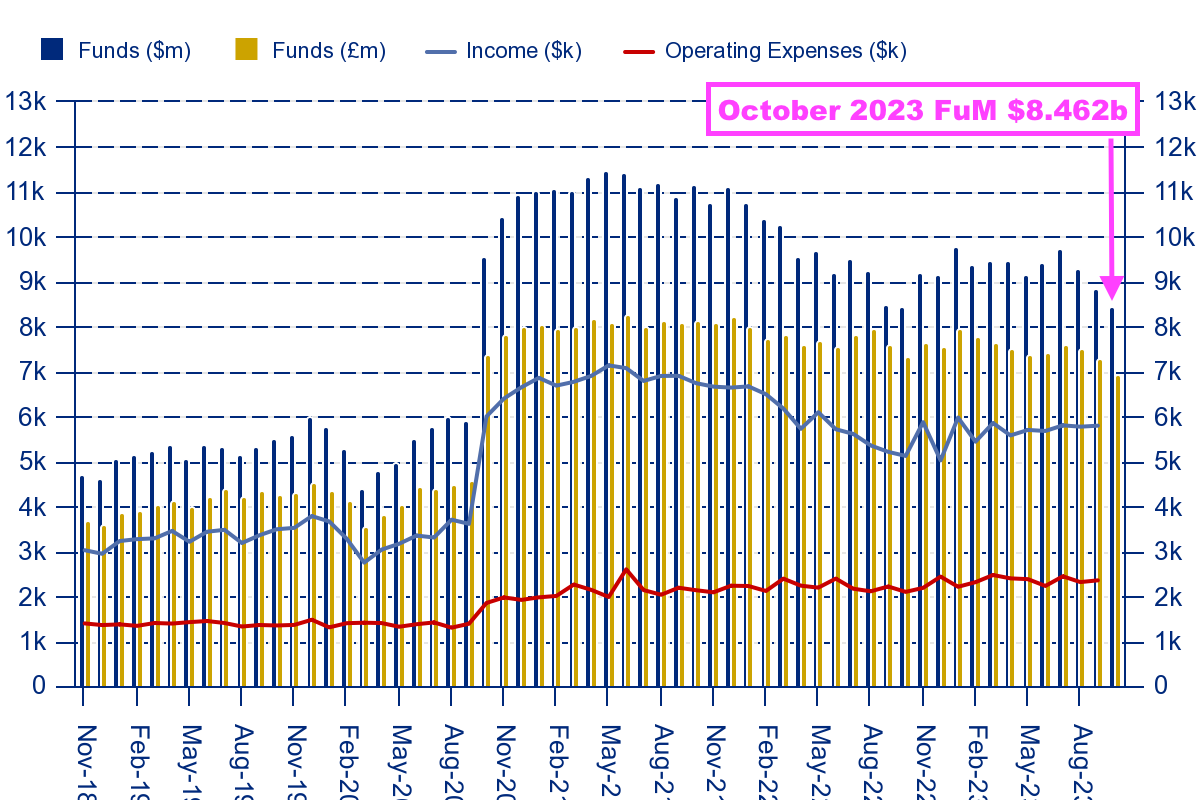
- FuM at October’s $8.5b matches the post-KIM-merger low of October 2022 and is 16% less than the all-time high enjoyed at the end of FY 2021 ($11.4b).
- The Q1 2024 update disclosed CLIG’s first USD profit run-rate:
“The Group’s income currently accrues at a weighted average rate of approximately 70 basis points, net of third party commissions. “Fixed” costs are c.US$2.3 million per month, and accordingly the run‐rate for operating profit, before profit‐share is approximately c.US$3.4 million per month based upon current FuM. “
- $3.4m a month with a 26% profit share and 25% tax would give earnings of $22.6m or 44.6 US cents or 35.7p per share at GBP:USD 1.25
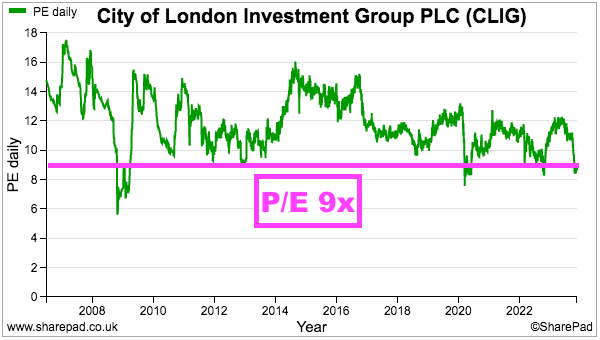
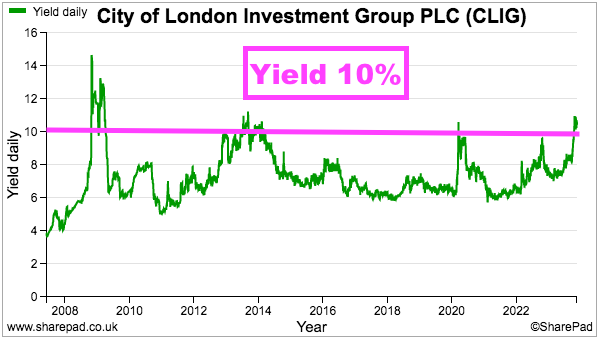
- Possible earnings of 34-36p per share and the trailing 33p per share dividend put the 320p shares on a multiple of approximately 9x and yield of 10%.
- Although CLIG has always traded on a modest rating, the present P/E and yield have been witnessed only a handful of times during the last 15 years:
- Future returns can be judged through CLIG’s (commendably public) total-return ambition, which is said to “stretch the management team“:
“The goal of this KPI is for the total return (share price plus dividends) to compound annually in a range of 7.5% to 12.5% over a five-year period. This KPI is meant to stretch the management team, without incentivising managers to take undue levels of risk.”
- The minimum 7.5% compound annual total return during the next five years appears very achievable, assuming of course the 33p per share dividend is sustained to support that 10% income.
- Should market conditions during the next five years return to those of FY 2021 — which saw FuM peak at $11.4b and the share price rally to 550p — then the compound gains from 320p will be much higher than the 7.5%-12.5% KPI range.
- This FY confirmed the KPI was achieved for the five years ending FY 2023:
“Over the past five years, the average annualised return to shareholders is 8.0%, within the 7.5%-12.5% target range.“
- That five-year 8.0% annualised return was met almost entirely through dividends, as the share price at the start of FY 2019 was 402p and the share price at the end of FY 2023 was 404p.
- But will the KPI be achieved for the five years ending FY 2024?
- The starting share price for the five-year term ending FY 2024 is 406p, and to date dividends of 160.5p per share have been collected but the price has dropped 86p to 320p.
- I calculate another 33p per share dividend and the share price recovering to at least 400p is required to meet the 7.5% CAGR goal for the five years to FY 2024.
- Therefore the KPI may indeed “stretch the management team” during the next year or so.
- The 320p share price was first seen during October 2007…
- …and the general lack of long-term capital appreciation does suggest CLIG’s operating economics, business strategy and/or management talent are not quite what they should be.
- I first bought CLIG during 2011 at 355p and the shares have since delivered a very generous income. Total payouts (ordinary and special) throughout the last twelve years have totalled 371p per share to recoup my initial investment.
- But this FY has heightened the danger of the handsome payout eventually becoming untenable as:
- New clients remain very elusive;
- Markets remain subdued;
- Client returns remain very modest;
- Client fees keep reducing, and;
- Costs keep advancing.
- I wrote in my H1 2023 review:
“I do hope outside shareholders can rely on Mr Karpus — in his new role as “strategic advisor” — to provide frank views to the board on employee productivity.”
- I am therefore pleased the increasing risk of a dividend cut has prompted KIM founder — and 31.5% CLIG shareholder — George Karpus into action.
- Mr Karpus issued a statement at October’s AGM and wants a fresh board:
“I believe this board should be replaced with a seasoned group of directors that understand the enormous potential of CLIG and that can guide the management in profitably growing the company.“
- I have spoken to Mr Karpus and this blog post recaps our conversation.
Maynard Paton

City of London Investment (CLIG)
Trading Update published 22 January 2024
A mixed update, with the fifth consecutive quarterly outflow of net client money counterbalanced by positive market movements to push FuM to its highest level since March 2022.
More interesting perhaps is CLIG cutting costs and seemingly ditching some stale seed funds, which may suggest major shareholder George Karpus has been in touch.
A new dividend-cover template meanwhile indicates a very weak Q2 performance and signals an uncovered dividend for FY 2024. But an earnings improvement is projected for FY 2025.
Here is the full text interspersed with my comments:
——————————————————————————————————————
“City of London (LSE: CLIG), a leading specialist asset management group offering a range of institutional and retail products investing primarily in closed-end funds (CEFs), announces that on a consolidated basis, as at 31 December 2023, FuM were US$9.6 billion. This compares with US$9.4 billion at the Group’s year end on 30 June 2023. A breakdown by strategy follows:
IM Performance
Relative investment performance of the Group’s strategies was mainly positive over the period, with OV and Fixed Income strategies outperforming, International Equity neutral and EM slightly negative. Significant CEF discount widening through late 2023 was partly reversed in Q4 which helped relative performance into year-end while NAV performance was positive.
Over the six-month period, there were net outflows of circa US$294 million across the Group’s strategies, led by EM redemptions at CLIM and required minimum distributions for KIM clients at year end.
Marketing and sales activity has picked up significantly in January as clients and prospects review their investment allocations. We are focused on new mandates in a number of the Group’s asset classes with very good long-term performance as CEF discounts are at compelling levels and there is ample capacity.”
——————————————————————————————————————
Total Q2 2024 FuM of $9,576m is the highest quarterly FuM since Q3 2022 (March 2022) — seven quarters ago — when FuM reached $10,265m.
But the greater FuM is due to market movements; net client withdrawals during H1 were $294m split $152m/$142m during Q1/Q2. After a negative $391m Q1 market return, Q2 delivered a welcome $836m positive return giving a positive $445m addition for H1.
Clients have now withdrawn net funds for five consecutive quarters, with net outflows at EM currently at seven consecutive quarters. Outflows also continue at KIM. Only OV and Other enjoyed Q2 net client inflows, of $15m and $1m respectively.
Clients clearly continue to seek investment opportunities elsewhere, and the share price is unlikely to be re-rated higher until CLIG can sustain net inflows of client money. I calculate investment returns during H1 were c4-5% for CLIG/KIM, which was slightly below the benchmark performances of 4%-6% cited by CLIG.
My calculations suggest total inflow/outflows since the start of FY 2015 come to a negative $549m. So net client money has left CLIG during the last 9.5 financial years. I am therefore glad to read “ Marketing and sales activity has picked up significantly in January“.
——————————————————————————————————————
Operations
The Group’s income currently accrues at a weighted average rate of approximately 70 basis points, net of third party commissions. “Fixed” costs are c. US$2.3 million per month, and accordingly the current run-rate for operating profit before profit-share is approximately US$3.2 million per month based upon current FuM.
The Group has proactively undertaken cost reductions as part of normal operations reflecting the current market environment. Based on actions initiated to date, savings of c. US$2.5 million of costs per annum will be fully realised in the next financial year.
The Group estimates the unaudited profit before amortisation and taxation for the six months ended 31 December 2023 to be approximately US$13.9 million (six months ended 31 December 2022: US$13.8 million, restated in USD based on average exchange rate).
Inclusive of our regulatory and statutory capital requirements, cash and cash equivalents stood at US$28.8 million at the end of the calendar year (US$28.6 million as at 30 June 2023, restated in USD based on closing exchange rate), in addition to the seed investments of US$2.4 million. Our cash reserves will allow us to continue managing the business conservatively through volatile markets while following our dividend policy for our shareholders.
The Company is currently in a close period which will end with the publication of results for the six months ended 31 December 2023 on 23 February 2024.”
——————————————————————————————————————
Fee rates at a net 70 basis points are unchanged from October’s Q1 update. Fixed costs at c$2.3m a month are also unchanged from October’s Q1, but the c$3.2m monthly profit run rate is below the c$3.4m stated during October.
This line is encouraging: “The Group has proactively undertaken cost reductions as part of normal operations reflecting the current market environment. Based on actions initiated to date, savings of c. US$2.5 million of costs per annum will be fully realised in the next financial year.”
I wonder if major shareholder George Karpus has been in touch with CLIG to ask for reduced expenses. He suggested there was scope for cost cutting during our conversation.
Savings of $2.5m a year is equivalent to 5 US cents per share (c3.9p per share).
Pre-tax profit at $13.9m could equate to $10.5m after tax and earnings of c21 US cents per share (c17p per share).
CLIG paid the final FY 2023 22p per share dividend during this H1, which earnings of 17p did not cover. Cash therefore ought to have finished this H1 lower. And yet cash increased a fraction to $28.8m.
CLIG seems to have sold some seeded funds; seed investments stated at $2.4m for this H1 are notably less than the £7.9m mentioned in the 2023 annual report.
Mr Karpus was keen to see CLIG’s ditch sub-scale strategies that were unlikely to take off, and I suspect some have been closed to help generate that aforementioned $2.5m annual saving and bolster the cash position.
——————————————————————————————————————
Dividend
The Board declares an interim dividend of 11p per share, which will be paid on 28 March 2024 to shareholders registered at the close of business on 1 March 2024 (2022: 11 pence).
Shareholders may choose to reinvest their dividends using the company’s Dividend Reinvestment Plan, to do this please visit http://www.signalshares.com or if you hold your shares through a broker please contact them. The deadline to lodge your election is 8 March 2024.
The Board confirms the following interim dividend timetable:
· ex-dividend date: 29 February 2024
· dividend record date: 1 March 2024
· DRIP election date/ deadline for currency election: 8 March 2024
· announcement of USD dividend conversion rate: 14 March 2024
· dividend payment date: 28 March 2024
City of London Investment Group is a UK registered company, listed on the London Stock Exchange and declares its dividends in GBP. Shareholders based in the US can elect to receive dividends in USD, should they wish to do so. The currency conversion rate from GBP to USD will be fixed two weeks before the dividend payment date. The currency election form can be found on our website at https://clig.com/wp-content/uploads/2022/08/Currency-Election-Form-2022.pdf
Alternatively, overseas shareholders may be able to use the International Payment Service (IPS) and receive dividend payments direct to their bank account in local currency. Further information regarding the IPS including terms and conditions, costs and forms for signing up are available from Link Group at https://ww2.linkgroup.eu/ips.”
——————————————————————————————————————
The H1 dividend is maintained at 11p, although payout cover during Q2 fell well below 1x…
——————————————————————————————————————
Dividend cover template
Please see dividend cover template attached here.
http://www.rns-pdf.londonstockexchange.com/rns/3692A_1-2024-1-20.pdf
The dividend cover template shows the quarterly estimated cost of dividend against actual post-tax profits for last year, the current six months and the assumed post-tax profit for the remainder of the current year and the next financial year based upon specified assumptions.”
——————————————————————————————————————
Here is the new dividend-cover template:
The obvious worry is Q2 earnings of just over £3m, which if maintained at that level would not cover the 33p per share payout (c£16m/year).
Note that CLIG now predicts £0.4m will be transferred FROM reserves for FY 2024 — i.e. the full-year dividend will NOT be entirely covered by reported earnings. The previous dividend-cover template had projected £0.6m would be transferred TO reserves — i.e. earnings would cover the full-year dividend with only £0.6m to spare.
CLIG has now introduced an FY 2025 projection that anticipates £1.8m transferred to reserves, which implies FY 2025 earnings of c35p per share that suggest the 33p per share payout can be maintained.
I am pleased the overhead assumptions have returned to the dividend-cover template and now show reductions to reflect the aforementioned $2.5m savings.
The dividend-cover template still assumes inflows running at $300m a year, which remains very optimistic given the H1 $294m yearly outflow just confirmed.
Maynard
City of London Investment (CLIG)
Publication of 2023 annual report
Here are the points of interest beyond those noted in the blog post above:
——————————————————————————————————————
1) BUSINESS MODEL
No changes in this section here for 2023.
CLIG still claims to be very “risk averse” and “discourages the cult of the individual “. And the ‘team players’ still have a long average tenure:
CLIM’s stock-picking continues to be undertaken using an “array of proprietary tools“:
CLIM’s competitive advantage seems to be its different investment philosophy — although buying investment trusts at discounts to NAV and focusing on “consistent investment performance” are not unique:
KIM’s investment process appears similar to that of CLIM’s, with a mix of top-down and bottom-up analysis:
KIM’s competitive advantage is outlined with more detail than CLIM’s:
2) OUR STRATEGY AND OBJECTIVES
No changes within this section for 2023.
The text repeats how the clients pay the bills, the employees manage the business and the shareholders own the business. A critical issue for CLIG shareholders is where they sit versus the clients and employees. I would argue the balance has swung too much towards the employees from the shareholders. FWIW, CLIG continues to state:
“Our responsibility is to keep these three stakeholders in balance (avoid conflicts) and to ensure that each of their interests is safeguarded.”
One of the strategic goals’ is ‘outperform’, which CLIG then claims:
“CLIM: Our investment horizon is five years, and over this period the three strategies that make up ~99% of CLIM’s Funds under Management are all outperforming their peers and benchmark.
KIM: Long and short-term performance remains solid, with the KIM investment process continuing to add value on behalf of clients in the face of volatile markets.”
I am not convinced CLIM’s funds are “all outperforming their peers” when the strategies are third quartile over five years!
Another strategic goal is “Increase FuM from long-term investors“, and CLIG’s update remains simply: “We have always taken great pride in our client retention outreach programme, and remain open and accountable.”
Yet for the “Corporate citizenship” goal, CLIG’s update remains:
“We encourage employee participation in both local events of national and global charities, as well as local community specific events. Additionally, by the nature of our four-office structure, this means that we are able to offer a wide array of community involvement events to employees, and we have found that a greater variety allows for greater participation throughout the year. In turn, this can also provide for meaningful results as some events will be chosen on a personal level and will have a greater impact for specific employees and their families. These efforts and services work hand in hand to protect cultures and customs not only within the community outreach programmes but also within the workplace.”
The far longer text for ‘Corporate citizenship’ versus ‘Increase FuM from long-term investors’ may tell us where the board’s priorities lie.
3) KEY PERFORMANCE INDICATORS
a) Employee longevity
CLIG continues to employ lots of veteran staff:
“88% of our 24 portfolio managers have worked for Group subsidiary companies for five or more years, and 44% of all employees have worked for Group subsidiary companies for over ten years.”
The previous-year stats were 86% of 21 portfolio managers and 48% of all employees.
b) Client longevity
Useful info on client numbers:
“We have an active client retention programme in place which has both educated and ensured that our clients understand even more about our investment process. As at 30th June 2023, the Group had 938 client entities in the over 10 years category (2022: 926), 400 in 5-10 years (2022: 448) and 563 in 0-5 years (2022: 593).”
938+400+563 = 1,901 clients versus 1,967 for 2022 and 1,999 for 2021.
FuM per client for 2023 was therefore $4.96m versus $4.69m for 2022 and $5.73m for 2021.
The Karpus merger during FY 2021 has significantly influenced FuM per client because Karpus serves mostly individual investors. For 2020, CLIG serviced 173 (institutional) clients with an average $31.81m FuM.
c) Weighted average net fee rate
A comment indicating fee rates declining from 73 to 72bps was due to lower EM FuM:
“In general, the change is on account of a marginal reduction in the proportion of CLIM’s assets in the EM strategy from 64% in 2022 to 61% in 2023.”
4) RISK MANAGEMENT
A small change for 2023. CLIM’s Risk and Compliance Committee is now co-chaired with the US Chief Compliance Officer:
“CLIM’s Board has established an RCC, which is co-chaired by CLIM’s Head of Compliance and US Chief Compliance Officer. The other members of the RCC are the Executive Directors of CLIM and CLIG’s General Counsel.”
KIM’s compliance committee remains staffed only by KIM employees, which does give the impression KIM is becoming the more dominant force within the group.
Both compliance committees now report to the board’s audit committee every quarter, rather than to the board and audit committee.
CLIG’s principal risks remain:
* Key person;
* Technology, IT, cybersecurity and business continuity;
* Material error/mandate breach, and;
* Regulatory and legal.
Only a minor text addition for 2023, concerning ‘key person’ risk:
“In addition, the Nomination Committee regularly reviews talent and succession plans for both Board and key senior management positions.”
5) CORPORATE AND SOCIAL RESPONSIBILITY POLICY
a) Workplace
Less WFH, but George Karpus will probably want to see five days a week:
“Our management team and the Board continued to engage, ensuring open discussion with the wider workforce. As a result of this, we implemented a new hybrid Work from Home (WFH) policy with effect from 1st July 2022 that better achieved the necessary balance of employee flexibility with respect to work/life balance along with the benefits of employees working together in the office. For the next financial year, effective 1st October 2023, we have increased our in-person days in the office to four per week, while providing more flexibility via a bank of optional WFH days for employees.”
New text for 2023 revealing slightly unnerving talk of new recruits deciding to leave:
“Finally, we created a pilot “New Hire Mentor” programme at one Group office, as we attempt to find solutions to better integrate new hires into our subsidiaries, to hopefully reduce new hire turnover. If successful, we will extend this programme to the other offices within the Group.”
I am not convinced about employees spending time on these “trainings” (what an awful American word!) when there remains ample scope to improve the investment returns for clients:
“In this financial year, the titles of the two trainings were “Disrupting our Unconscious Bias” and “Your Words Matter About Disabilities”.”
b) Environment
An environmental consultant has helped produced a thorough TCFD document for this annual report (point 6):
“During the year, the Group engaged with a third-party environmental consultant – ECO3 Partnership Limited (ECO3) to review and enhance our reporting on environmental risks and opportunities. In collaboration with ECO3, the group produced a 2022 TCFD Supplemental Report which was published in August 2023. ECO3 has also helped the Group to produce a detailed Scope 1-3 GHG assessment and SECR summary, which is available on our website.”
6) TASK FORCE ON CLIMATE-RELATED FINANCIAL DISCLOSURES
As noted during my discussion with George Karpus, this annual report contained nine pages of TCFD information:
I am pretty sure this is overkill for a business with 116 people working in four offices.
Among all the charts, these two were the more interesting ones:
The first chart shows electricity-related emissions declining as ‘green’/renewable suppliers have been appointed and some smaller offices have been shut.
The second chart includes emissions relating to business travel (dark blue), which have reduced over time but picked up during 2023 versus 2022.
The TCFD text says business travel may increase for FY 2024:
“We do however anticipate a further increase in business travel in our next financial year to support our strategy meeting… For business flights, due to our geographical spread and client base, we are reviewing our policies.”
So more flights are expected, but they could be worth the time, expense and pollution if they result in extra FuM.
The chairman’s statement gave this business-travel policy:
“The mandated travel policy introduced during the Covid pandemic, which prioritised the use of video conferencing for both internal and external meetings, has become a permanent feature across all Group offices.”
The TCFD text said ESG matters are “considered” when the portfolio managers decide which funds to buy, but “governance factors” take priority:
“ESG is considered at the level of both the CEF corporate and the underlying CEF portfolio. CLIM is a large investor in CEFs and at the corporate level prioritises governance factors over underlying portfolio ESG issues when assessing a potential holding prior to purchase.
In respect of the underlying CEF portfolio, CLIM’s research teams undertake due diligence annually on CEF investment managers which includes their processes for incorporating ESG and for mitigating climate change risks.
Overall ESG risk for all CLIM portfolios as at end December 2022, using Sustainalytics, was 1.4% lower than their respective benchmarks. By strategy, overall ESG risk for the EM strategy was 1.3% below benchmark and for the International Equity and Opportunistic Value strategies it was 1.6% lower. CLIM does not set targets for these measures.
In 2022, 64 CEF portfolios were analysed (71 in 2021) using Sustainalytics data, representing 72% of CLIM’s FuM at the calendar year end (vs. 70%). In those CEF portfolios that were analysed, Sustainalytics covers 92% of the underlying securities on a size weighted basis.”
I wonder how much time CLIG’s portfolio managers spend looking at Scope1&2 emission data within annual reports. If very little, then CLIG’s board may want to consider whether its TCFD reporting is overkill for this type of business.
7) GOVERNANCE INTRODUCTION
The board seems to have taken a pragmatic approach to diversity requirements:
“The Board and Nomination Committee are actively considering measures to comply with the new Listing Rules requirements relating to diversity. Whilst we are committed to having a Board that is diverse in all respects, we are also clear-eyed about some of the challenges of finding a diverse pool of candidates who have the skills and experience in our business sector. To counter this, we have been looking afresh at our Board role specifications to ensure we are able to draw on as wide a pool of talent as possible.
We know we have more work to do to be able to meet the Listing Rules requirements in respect of gender diversity, both in regard to senior Board positions and female representation in the executive management team.
It remains our firm intention to comply fully with best practice in respect of independence, diversity and inclusion both on the Board and throughout the Group, although as we reported last year, the goal of full compliance will need to be achieved in a way that ensures an appropriate level of continuity, rather than within an arbitrary deadline.”
George Karpus was unhappy with the board’s apparent pre-occupation with diversity when I spoke to him last year.
The subsequent H1 2024 results announced a replacement non-exec:
“CLIG is pleased to announce that Sarah Ing will be joining the Board as a Non-Executive Director (NED) on 1st March 2024. Sarah is a qualified chartered accountant with over 30 years of experience in the financial services sector including audit, corporate finance, investment banking and asset management. She is an experienced NED in quoted financial services companies. Previously, Sarah founded and ran an investment management business and was also a top-rated equity research analyst covering the financial sector. Sarah is also an independent NED at CMC Markets plc, XPS Pensions Group plc and Marex Group plc. She is the Chair of the Remuneration Committee at CMC Markets plc, Chair of the Audit and Risk Committee and of the Sustainability (ESG) Committee at XPS Pensions Group plc and at Marex Group plc she is senior independent Director and Chair of the Audit and Compliance Committee.
The Group also announces that Jane Stabile, a Non-Executive Director and Chair of the Nomination Committee, will be resigning from the Board on 29th February 2024, following a request from her to resign due to increasing commitments in her own business. Rian Dartnell will take over as Chair of the Nomination Committee”
CLIG’s board diversity has not improved with the non-exec switch, but I think the level of relevant experience has.
8) BOARD ACTIVITIES
A bit sad three of the non-execs each missed a remuneration-committee meeting:
9) STAKEHOLDER ENGAGEMENT
Almost all the text was unchanged for 2023, although this line from 2022…
“The Board spearheaded an initiative to increase the level of applications being received from candidates from diverse backgrounds by consulting with recruiters and working with Universities to recruit directly.”
…did not refer to “working with Universities to recruit directly” for 2023. Maybe such recruiting led to the high new-recruit turnover (point 5a).
9) BOARD EVALUATION
The findings of a 2022 board evaluation were disclosed within this annual report and concluded three “priority areas“:
“Overall, the results of the 2022 evaluation were positive and showed that the Board continued to perform effectively. The outcomes of the 2022 Board effectiveness review were discussed by the Board at its meetings in October 2022 and January 2023. As a result of reviewing common themes in the feedback Directors provided, three priority areas were agreed: the strategy for growth, succession planning and further refinement of management’s reporting to the Board.”
The ‘strategy for growth’ outcome was reported with the following actions:
“In January 2023 the Board received and considered a paper from the Executive Director which gave a high level overview of the strategy for growth. A strategy discussion was held in April 2023.”
Not much detail here! I would argue CLIG’s ‘strategy for growth’ is vital for shareholders given the outward flows of client money over time. I think CLIG should publish this ‘strategy for growth’ paper or at least summarise it for shareholders to understand what the board’s growth plan actually is.
10) NOMINATION COMMITTEE
CLIG did contemplate an external chairman but decided to go for a current non-exec:
“Rian Dartnell has agreed to succeed Barry Aling as Chair. The Committee considered the merits of seeking an external candidate for the role of Chair, but recommended Mr. Dartnell as the preferred candidate based on his long connection with the Group and his deep understanding of the business itself and the industry in which it operates. We have attempted to strike a balance between refreshing the Board and preserving continuity of experience. We are confident that this appointment and our ongoing work on succession planning mean that the Board will continue to have the right combination of skills and experience to support the Company in delivery of its current strategy.”
More on ‘succession planning’ following the board evaluation (point 9):
“Succession planning has been identified as a priority area in the 2022 and 2023 Board effectiveness reviews and our attention as a Committee will now turn to developing our longer-term succession plans.
To this end, the Committee has considered the composition of the Board and its Committees, taking into account the skills, experience and knowledge of the existing Directors. Following this review, in August 2023 the Committee recommended commencing a search process for an additional independent Non-Executive Director with the assistance of Sapphire Partners, an executive search firm with a focus on diversity.”
Employing an “executive search firm with a focus on diversity” may tell us where the board’s priorities lie, although the outcome of the search did not result in any greater diversity and in fact improved the relevant professional experience (point 7).
The 2023 text included a revamped Board and Committee Diversity Policy, which confirmed CLIG would, among other objectives “consider all aspects of diversity when reviewing the composition of, and succession planning for, the Board and its Committees and executive management recruitment“.
And the text included a new representation-data table:
11) AUDIT & RISK COMMITTEE REPORT
a) Introduction
An entire rewrite of the intro for 2023. This paragraph highlights the main areas of audit-committee concern:
“A key area of focus for the Committee has been the annual impairment review in relation to goodwill and intangible assets challenging the assumptions and methodology of valuation. The Committee also worked closely with the CFO on the selection of a new third-party provider to assist with the review process.
“The Committee has also taken a keen interest in climate-related risk and reporting and oversight of additional ESG disclosures, and has also been considering proposals for realistic longer-term commitments to reaching net zero.“
b) Significant judgments, key assumptions and estimates
The ‘share-based payments’ significant judgement included for 2022 was dropped for 2023.
The other two judgements, ‘goodwill’ and ‘nature of interest in EM REIT fund’, remain the same. Kroll Advisory Limited has replaced BDO for double-checking the goodwill sums, which now include “financial multiples” in the assessment.
c) Other
No major changes throughout the rest of the committee text. I note those reporting to the committee now include the “the US Chief Compliance Officer“:
“The Committee is responsible for assisting the Board in maintaining an effective internal control environment. To achieve this objective, the Committee receives regular reports on compliance and internal control procedures from CLIG’s General Counsel, the US Chief Compliance Officer, CLIM’s Head of Compliance, KIM’s Chief Compliance Officer and CLIG’s management.”
12) REMUNERATION COMMITEE
a) Introduction
Confirmation of changes to the executive remuneration policy that were mentioned within the 2022 report.
“The Remuneration Committee completed its most recent review of our three-year Group Directors’ Remuneration Policy (the Remuneration Policy) in October of 2022. During that review, the Company incorporated post-employment shareholding requirements within the policy, to comply with the Code and align with investor expectations. The Company also extended the vesting period for awards made to the Executive Director under the Employee Incentive Plan (EIP) so that RSAs will vest one-third each year after the third, fourth and fifth anniversaries of grant, applicable to awards to be granted from October 2024 onwards. These changes were incorporated into the Company’s Remuneration Policy that was approved by shareholders.”
b) CLIG’s KPI relationship to our directors’ remuneration policy
No changes to this text for 2023. But a useful reminder of CLIG’s thinking behind the group’s single KPI — which is to generate a total return CAGR of between 7.5% and 12.5% over five years.
As per my blog post above, the KPI will indeed present a challenge for the year to FY 2024:
“This volatility is also why total return of CLIG over a market cycle which is defined as a rolling five-year period has been selected as the KPI. This KPI presents a challenge for the management team to achieve, without incentivising managers to take undue risks. We have a conservative approach to risk. We do not charge performance fees and there is no debt on our balance sheet.”
I reckon the share price had to reach 400p by the end of June 2024 to meet the minimum KPI target. The price ended June at 370p.
More on the team-style process:
“We have developed and nurtured a team investment process which does not rely on “star” fund managers, but rather upon experienced fund managers using a disciplined analytical process that can produce repeatable and sustainable first or second quartile performance versus our peers.”
Other charts in the annual report indicated third-quartile performances for CLIM.
Interesting text below — “If we do our job well…“:
“If we do our job well, our FuM and fee income can grow over time. Proactively managing operating costs is the lever that allows us to maintain profitability levels. Profits lead to shareholder value through dividends, retained earnings and the CLIG share price increases. ”
I suppose shareholders can argue CLIG has not done its job well because FuM and fee income have not really grown over time.
Confirmation of the 30% profit-share pool maximum:
“Employees are compensated through a combination of salary and profit-share. Salaries are a fixed cost and are managed to account for the volatility of earnings. The profit-share pool is fixed at a maximum of up to 30% of operating profit of the Group and aligns employees’ variable income component of total compensation with Group profitability and shareholder value.”
As per the blog post above, the profit-share proportion has been increasing over time and was 26.5% during FY 2023. Could the 30% be reached within a few years?
This text makes sense in theory:
“Rather than making large numbers of employees redundant during market downturns and negatively impacting the business, the variable component of compensation can take the brunt of reduced revenues.”
But salaries can (and have) been edged higher to soften the lack of profit share during a downturn. And the profit-share proportion can be lifted, too.
I am not sure about the absence of individual KPIs either:
“Individual KPIs are not relevant to a business that employs a team-based approach to operating a business, which in many respects is similar to a partnership. In fact, individual KPIs would not only be divisive, but would introduce unnecessary risks. Our team approach to managing the business, with a profit-share pool based on operating profit, aligns the constituents of our business…”
Surely even among a team-style process, some employees work harder and/or are more talented than others. How do they get recognised? And are poor investment decisions by the fund managers challenged? If portfolio managers are not being assessed individually, is that why some many of them have long tenures (i.e. nobody fires them) and the funds do not have incredible performances?
c) Single total figure of remuneration
The board’s pay in full:
The CEO is paid in USD and his apparent GBP-denominated pay rise reflected currency movements:
“Tom Griffith’s CEO salary (including Director’s fee) was US$332,500 (FY 2022: US$332,500) and he did not receive a pay rise during the year (no pay rise in FY 2022 either). His salary is paid in US dollars and reported in sterling. The difference is due in part to a stronger US dollar to the pound this year as compared with last year.”
The previous 2022 report said the CEO last received a pay rise on 1 January 2021 of 2%.
The CEO receives a healthy 12.5% pension contribution:
“All employees*, including the Executive Director, are entitled to membership of the Group’s defined contribution pension arrangements. Contributions are capped at 12.5% of annual salary. Employer contributions in respect of all Executive Directors were 12.5% for the period under review
The CEO’s total fixed pay was 1.40x his total variable pay versus 2.09x for 2022 and 1.96x for 2021.
Lower variable pay is welcome given the year witnessed average FuM decline, average fee rates decline and profit decline, but still collecting £442k variable and £758k total might not cause the CEO too many sleepless nights.
Unusually perhaps, the CEO’s bonus continues to be dependent in part on employee feedback:
”The Executive Director’s performance is appraised annually and, in keeping with the Group’s team-based approach, derives partly from daily, honest feedback solicited from the open office environment in which the Group operates. Discretion is applied appropriately, with bonus awards being adjusted upwards or downwards depending on the outcome of the annual performance appraisal.”
Payments for the non-execs were lifted part-way through the year:
One of the non-execs claimed £10k taxable benefits and the small-print reveals why:
“Taxable benefits for Non-Executive Directors relate to reimbursed accommodation expenses whilst attending UK Board and Committee meetings. ”
George Karpus hinted last year he was not happy with director expenses.
d) Further remuneration disclosures
This table implies employees have seen their wages rise by 5%, 8% and 16% during the last three years:
The footnotes explained:
“Based on average cost per employee. The increases during the year are due to full year cost of replacing relationship managers and assistants, primarily due to retirements, and the full year impact of restoring employee health care benefits at KIM.”
Also of interest is this footnote:
“George Karpus joined the Board part way in FY2021 and 2022 % increase reflects full year impact of his base and corporate advisory fee. George Karpus ceased to receive the corporate advisory fee from 30th September 2022.”
The non-payment of the advisory fee suggests Mr Karpus had already decided to leave the board, which was hinted at during the October 2022 AGM and formally announced during May 2023.
e) Governance disclosures
Full details of the board shareholdings, including the token shares held by three of the non-execs that annoyed George Karpus:
The CEO owns 36,059 EIP shares and 40,5000 options as well as 492,338 ordinary shares.
The 2021 and 2022 AGM voting indicated shareholders were happy with board pay:
The 2023 AGM did not vote on board pay.
13) INDEPENDENT AUDITOR’S REPORT
a) Key audit matters
A reduction from four to two key audit matters for 2023.
The matters that stay are ‘Accuracy and completeness of management fees’ and ‘Impairment of goodwill and intangible assets’.
The matters that depart are ‘Breach of investment mandates’ and ‘Regulatory requirements’.
The auditor’s report did not explain why two of the key audit matters were dropped for this year, which is not ideal. Often, an auditor will explain a key audit matter is no longer relevant (e.g. work relating to a particular acquisition, the introduction of a new accounting standard etc)
The dropped key audit matters were key audit matters for 2018, 2019, 2020 and 2021 as well as 2022. The auditor, RSM, has been CLIG’s auditor since 2018, so a change of auditor is not the reason for the reduced number of key audit matters.
Within the ‘Accuracy and completeness of management fees’ matter, the text contained a few extra lines this year:
* “Whilst the computation of fees is not inherently complex or judgemental, revenue is material in the context of the financial statements as a whole…”
* “…checking that the correct fund values had been used to calculate the fee”
* “We used data analytics software to test the revenue cycle for all external revenue transactions, investigating a sample of outliers identified and performed a targeted review of a sample of manual journal entries in respect of revenue.”
* “Satisfactory explanations were obtained for a sample of outliers identified in our data analytics testing”
* “No unusual or unexpected manual journal entries were identified in our testing.”
Maybe the extra lines reflected the extra audit work given the absence of the ‘Breach of investment mandates’ key audit matter. Indeed, this line from 2022 was not repeated for 2023:
“Our review of investment mandates also provided additional evidence of the operation of management controls over fee income.”
The text for the ‘Impairment of goodwill and intangible assets’ key audit matter also contained a few extra lines or changes:
This line was new: “Assessing the reasonableness of comparable companies used in the market comparable approach.”
And this line was revised: “Challenging management on key assumptions in the fair value model including selected AUM and EBITDA multiples, calibration to original transaction date and comparison against market comparables.“.
The prior year had instead referred to AUM growth and EBITDA margins.
Plus, checking the “accuracy of the discount rate calculation and basis for 2022 was replaced by checking the “accuracy of supporting data used in the fair value estimate.”
The extra text for ‘Impairment of goodwill and intangible assets’ was due to the (somewhat uncomfortable) revised methodology for goodwill impairment testing (point 20).
FWIW, the key audit matters dropped for 2023 involved the following work (taken from the 2022 report)…
“Our audit work included review and testing of the design and implementation of controls over reports generated by the Group’s trade order management system. For a sample of days during the year, we checked that the daily control sheets are being reviewed on a daily basis and that any breaches identified in respect of investment mandates were properly recorded and addressed in a timely manner. For parts of the Group where specific mandates are not applicable, we tested a sample of management fee transactions and confirmed that the fees were calculated in accordance with the investment management agreements.”
…and:
“Our audit work included reviewing the controls in place to ensure ongoing compliance with the FCA regulatory requirements including reporting to the Board. In addition, we completed work to review compliance with the FCA laws and regulations.Our audit work in respect of KIM’s compliance with the SEC regulatory requirements included holding discussions with US colleagues, KIM’s Chief Compliance Officer and review of compliance documentation prepared by both management and an external consultant, including the outcome of an SEC regulatory examination.”
This work still appears important and could have still been undertaken, but not disclosing why two audit matters were dropped is poor form.
b) Materiality and scope
Overall materiality remained the standard 5% of profit before tax while full-scope audits covered 100% of revenue and 95% of profit before tax.
The 2022 report indicated the auditor “carried out analytical procedures” at two funds…
“RSM UK Audit LLP carried out analytical procedures at Group level on the overseas subsidiary based in Singapore and specific audit procedures for the International REIT Fund and Global Equity CEF Fund, based in the United States of America.”
…but this 2023 report disclosed the “analytical procedures” were limited to the Singapore subsidiary only.
The funds still exist, so this text revision seems further evidence of the auditor not performing as much work as the previous year.
14) SIGNIFICANT ACCOUNTING POLICIES
No major changes here.
a) Accounting estimates and assumptions
I note share-based payments is no longer one of the “most significant areas of the financial statements that are subject to the use of estimates and judgments“.
The remaining “significant areas” are the ‘EM REIT fund’ and ‘impairment of goodwill’.
b) Impairment of goodwill and other [acquired intangible] assets
A deviation for 2023. Previously goodwill and other acquired intangible assets were tested annually for impairment. Now just goodwill is tested annually for impairment:
“Other assets are tested for impairment whenever management identifies any indicators of impairment.”
Not sure how management will identify “any indicators of impairment” without a regular (say, annual…) test!
The useful life of the acquired intangibles remain between 7 and 10 years for ‘customer relationships’ and 15 years for ‘trade names’.
15) SEGMENTAL ANALYSIS
Confirmation that the vast majority of fees are earned through clients located in the USA:
The largest client represented 9.4% of gross fee income during 2023, versus 9.5% for 2022 and 9.9% for 2021. The proportion for both 2020 and 2019 was 13.2%, which I assume is higher than the sub-10% level witnessed currently due to the impact of the Karpus merger on the calculation.
16) EMPLOYEES
CLIG employed 116 people during 2023:
I note two fewer people worked in business development/marketing roles, which is not great when CLIG has struggled to attract new clients over time.
Revenue per employee was $594k during 2023, lower than the $700k-plus reported for 2021 and 2022, but within the $503k-$626k range witnessed between 2013 and 2020. Employee productivity has therefore not obviously improved over time.
My calculations show wages, salaries and profit share (in USD) absorbed 33.9% of revenue during 2023, versus 30.3% for 2022 and 29.2% for 2021. Between 2013 and 2020, the proportion ranged between 33.1% and 37.5%.
I see pension contributions are a useful 13% of salaries and wages (£1,575k/£11,590k) while ‘other staff costs’ (I am unsure what they are) were not insignificant at £932k.
17) OPERATING EXPENSES
Statutory audit fees up £16k to £193k, plus £30k of other fees for the auditor:
Not ideal the auditor is charging higher fees but seemingly doing less work after reducing the key audit matters from four to two (point 13a).
The £193k audit fee absorbed 0.3% of revenue, which is not alarmingly high.
18) FINANCE INCOME AND FINANCE EXPENSE
Annual interest earned of £581k:
CLIG’s cash balance averaged £22.5m during the year, suggesting interest earned was c2.6%. George Karpus has agitated for better returns for FY 2024.
19) PROPERTY AND EQUIPMENT
The net book value of office equipment/computers is almost £500k:
£500k is not huge versus underlying earnings of £17.8m, but System1 for example has more than 140 staff and office equipment/computers of only £48k.
20) INTANGIBLE ASSETS
Oh dear. No wonder a “key area of focus” for the audit committee was the annual impairment review for goodwill and other intangibles (point 11a).
This 2023 text suggests the impairment methodology was changed to avoid a goodwill impairment for KIM:
“Goodwill acquired through the business combination is in relation to the merger with KIM and relates to the acquired workforce and future expected growth of the cash generating unit (CGU). The Group has carried out an annual review of the carrying value of the CGU to which the goodwill is allocated to see if it has suffered any impairment. Management also considered whether there were any indicators of impairment of other intangible assets.
The Group had assessed the recoverable amount of the CGU by its value in use, as in the prior period, and found that it was less than the carrying value owing to a higher discount rate and reduced growth forecasts due to changes in market conditions. The Group thus reassessed the recoverable amount by its fair value (Fair Value) less cost of disposal (FVLCOD), which exceeds the carrying value.
The Fair Value is based on the Market Comparable Method (or “Comparable Company Analysis”) that indicates the value of KIM by comparing it to publicly traded companies in a similar line of business. An analysis of the trading multiples of comparable companies yields insight into investor perceptions and, therefore, the value of the subject company i.e., the value of KIM.
FuM and EBITDA multiples were selected and applied to the historical and forecasted metrics of KIM. The multiples were evaluated and selected based on the relative growth potential, operating margins and risk profile of KIM vis-a-vis the publicly traded comparable companies and also to reflect the degree of control and lack of marketability of the interest held in KIM. As such, FuM multiple of 4.0% and EBITDA multiples of 8.8x and 9.0x (calendar year 2022 and 2023, respectively) were selected based on the Comparable Company Analysis prior to concluding the Fair Value of KIM on a weighted average basis. This Fair Value is classified within Level 3 of IFRS 13 fair value hierarchy.”
Applying a different methodology arrived at £4.5m surplus to the goodwill of £71m carried in the books:
“The recoverable amount of the CGU exceeded the carrying amount of the CGU at 30th April 2023 by £4,534,000 (2022: £1,392,000).”
The forecast KIM growth rates are not ideal; a lowly 1.5% for revenue growth and a higher 3% rate for direct costs (i.e. direct costs are expected to outpace revenue):
“The Group’s forecasts are based on its most recent and current trading activity and on current financial budgets for twelve months that are approved by the Board. The key assumptions underlying the budgets are based on the most recent trading activity with built in organic growth, revenue and cost margins. The annual growth rate used for extrapolating revenue forecasts was 1.5% and for direct costs was 3.0% based on the Group’s expectation of future growth of the business.”
Anyway, here are CLIG’s intangibles:
21) OTHER FINANCIAL ASSETS
Investments of £7.9m:
From elsewhere in this annual report:
“The Group had invested US$5 million (£3.9 million) in seeding its two REIT funds at the start of January 2019. By the end of June 2023, these investments were valued at £3.8 million (2022: £3.8 million), with the small unrealised gain (2022: loss) taken to the income statement. The Group had also invested US$2.5 million (£1.9 million) in seeding the Global Equity CEF in December 2021 and US$2.5 million (£1.9 million) in SPACs in March 2022. By the end of June 2023, these investments were valued at £4.1 million (2022: £3.6 million), with the realised gain of £0.3 million and unrealised gain of £0.2 million (2022: unrealised loss of £0.2 million) taken to the income statement.”
From point 27, the investments of £7.9m reflect the holdings owned by CLIG’s seeded funds. The unlisted investments are held by the SPAC fund while the listed investments are owned by the other funds.
22) TRADE AND OTHER RECEIVABLES
Accrued income represents revenue recognised for services performed but not yet invoiced to the client:
CLIG’s fees are derived from a percentage of FuM, which I presume are calculated and charged in arrears. Total trade receivables and accrued income of £4.7m is equivalent to c8% — or approximately one month — of revenue. Prior to the KIM merger, the proportion used to be 14% or more, suggesting KIM’s individual clients are not extended the same payment terms as CLIM’s institutional clients.
23) CASH AND CASH EQUIVALENTS
Evidence that CLIG has listened to George Karpus and utilised KIM’s money-market skills:
Almost £12m was held in short-term treasuries/money-market funds at the year end.
24) TRADE AND OTHER PAYABLES
Pretty sure the £8.2m figure almost entirely represents staff bonuses accrued during the year but not yet paid:
25) SHARE BASED PAYMENTS
Conventional options are limited to 291k or 0.5% of the share count:
Details of the EIP scheme:
I note the actual charges incurred by the scheme have been very close to the original estimated charge. Mind you, the real economic impact of the EIP is the cash CLIG spends to purchase the shares to satisfy the scheme’s obligations. CLIG has spent a net £9m (i.e. after proceeds from option exercises) over the last five years buying shares for the EBT to service the EIP — with the associated EIP charge at £4.2m over the same time.
The EBT owns almost 2 million shares:
“The number of own shares purchased by the Company’s Employee Benefit Trust during the year was 622,746 (2022: 552,730). The number of own shares held by the Trust as at 30th June 2023 was 1,989,355 (2022: 1,708,763), of which 290,900 shares (2022: 328,750) were subject to options in issue. The Trust has waived its entitlement to receive dividends in respect of the shares held. The trust will abstain from voting on resolutions that concern a change of control in the Company. The Trust also holds 1,003,944 shares (2022: 682,437) in custody for employees under the terms of the Employee Incentive Plan”
26) RELATED PARTY TRANSACTIONS
An interesting note. Key management (and families) paid fund fees of £62k…
“One of the Group’s subsidiaries manages funds for some of its key management personnel, for which it receives a fee. All transactions between key management and their close family members and the Group’s subsidiary are on terms that are available to all employees of that Company. The amount received in fees during the year was £62,371 (2022: £58,232). There were no fees outstanding as at the year end. ”
…which if charged at the 0.7% average rate for all clients, implies key management (and families) have nearly £9m invested in CLIG’s funds. I am sure staff will enjoy a company discount on fees, so the sum invested may well surpass £10m.
27) FINANCIAL INSTRUMENTS
Snippets disclosing the investments held by two seeded funds are all listed (point 21)…
“The Group’s International REIT and Global Equity CEF funds have been consolidated as controlled entities, and therefore the securities held by the funds are reported in the consolidated statement of financial position under investments. At 30th June 2023, all those securities were listed on a recognised exchange.”
…and indicating an absence of bad debts:
“The majority of debtors relate to management fees due from funds and segregated account holders. As such, the Group is able to assess the credit risk of these debtors as minimal. For other debtors a credit evaluation is undertaken on a case by case basis. The Group has zero experience of bad or overdue debts.”
28) CHANGE IN PRESENTATIONAL AND FUNCTIONAL CURRENCY
Details about the change from GBP to USD reporting for FY 2024:
“As from 1st July 2023, the Group has changed its presentational currency from sterling to US dollars, to mirror the primary economic environment that it operates in. This will enable both investors and other stakeholders to have more transparency of the Group’s performance and reduce foreign exchange volatility on its income and costs. Currently almost all of the Group’s revenue and a large portion of its costs are incurred in US dollars. Therefore, for the year ending 30th June 2024 the Group will present its consolidated financial statements in US dollars.
The report contained handy USD versions of the GBP figures:
Maynard