01 July 2023
By Maynard Paton
H1 2023 results summary for City of London Investment (CLIG):
- “Choppy” market conditions causing funds under management (FuM) to slide 18% to $9b led to revenue dropping 9% and profit diving 26%.
- Significant new clients remain very elusive, with H1 outflows of $107m negating the inflows enjoyed during FY 2022 and aggregate withdrawals reaching $404m at merger partner KIM.
- Rising staff costs represented 42% of revenue following a 24% profit share, and questions remain as to whether i) employees rank ahead of shareholders, and ii) the total-return KPI really stretches management.
- The follow-up Q3 update admitted fee rates had declined from 73 to 71 basis points, as clients seemingly chip away at charges after perhaps watching the cheaper S&P 500 continue to outrun their CLIG portfolios.
- Reduced FuM, lower fees and greater expenses now point to earnings of 34p per share that just about support the 33p dividend and 7.8% yield. Capital gains meanwhile look dependent entirely on a broad market recovery. I continue to hold.
Contents
- News links, share data and disclosure
- Why I own CLIG
- Results summary
- Revenue, profit and dividend
- Funds under management: inflows and outflows
- Funds under management: capacity limitations and growth plans
- Funds under management: investment performance
- Funds under management: fee rates
- Management
- Exchange-rate/post-tax profit matrix
- Financials
- Valuation
News links, share data and disclosure
News: Interim results and presentation for the six months to 31 December 2022 published 22 February 2023, Q3 2023 trading update published 25 April 2023 and board changes published 26 May 2023.
Share price: 425p
Share count: 50,679,095
Market capitalisation: £215m
Disclosure: Maynard owns shares in City of London Investment. This blog post contains SharePad affiliate links.
Why I own CLIG

- Fund manager that employs a “risk-averse” strategy of buying investment trusts at wide discounts through a team-based approach (point 1).
- Accounts showcase a super 40% margin, significant net cash and ability to distribute majority of earnings via dividends.
- Yield of 8% offers meaningful income potential with capital-gains upside linked to a wider market recovery — or winning extremely elusive new clients!
Further reading: My CLIG Buy report | All my CLIG posts | CLIG website
Results summary
Revenue, profit and dividend
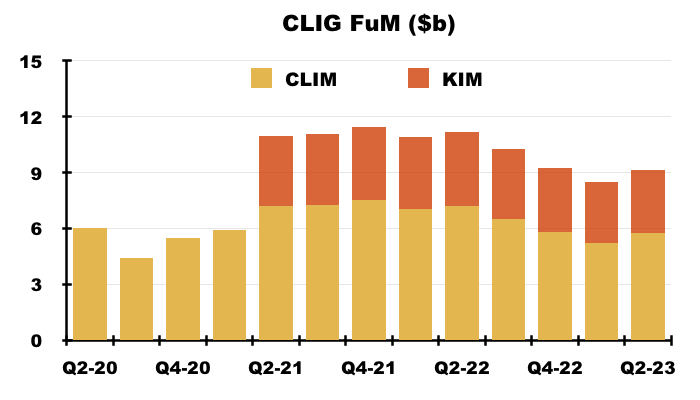
- This H1 2023 performance was never going to sparkle after a Q1 update during October and a Q2 update during January indicated funds under management (FuM) had essentially stagnated during the six months.
- FuM dropped 8% during Q1 but rebounded 8% during Q2 to leave FuM at $9.2b, down 1% from the preceding H2 2022 and down 18% from the comparable H1 2022:
- CLIG described the markets as “choppy” and claimed the FuM performance reflected a “challenging time for the global economy with the combination of rising interest rates, COVID-related disruption in China and supply-chain bottlenecks elsewhere”.
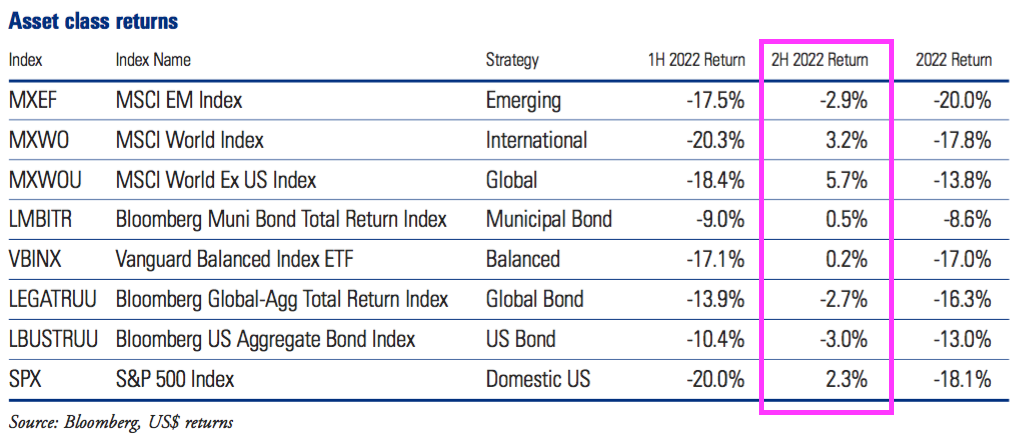
- CLIG emphasised a variety of indices had delivered modest performances during this H1:
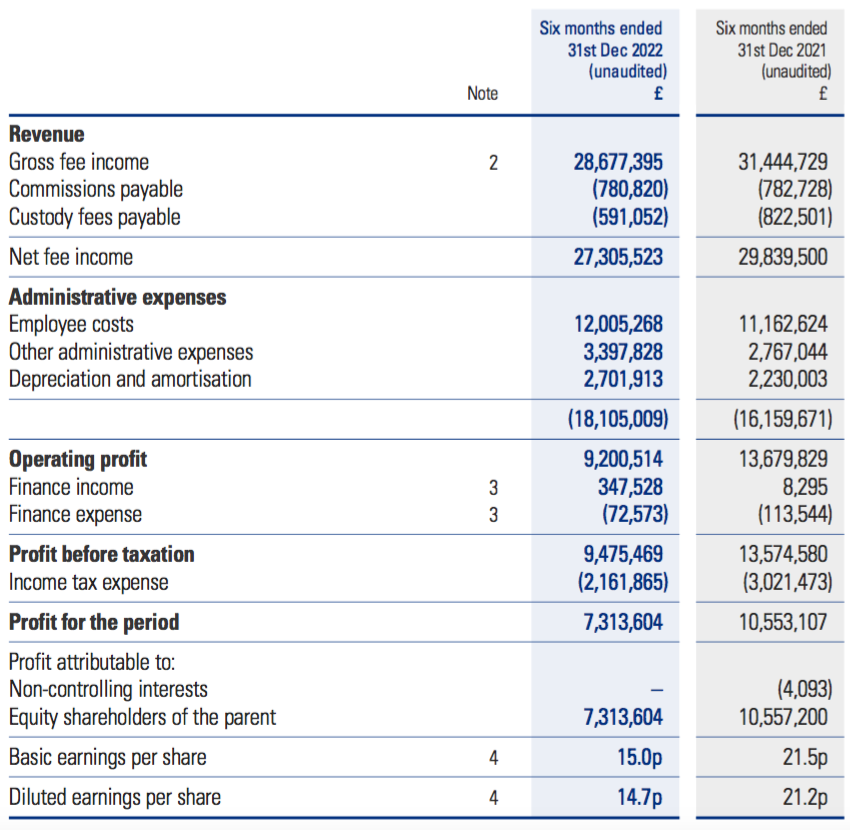
- January’s Q2 update estimated an underlying profit before tax of “approximately £11.9m” for this H1.
- Underlying profit before tax was in fact below the projected £11.9m at £11.7m.
- These H1 results were the first following the £102m merger with Karpus Investment Management (KIM) that were not distorted by a part-year KIM contribution.
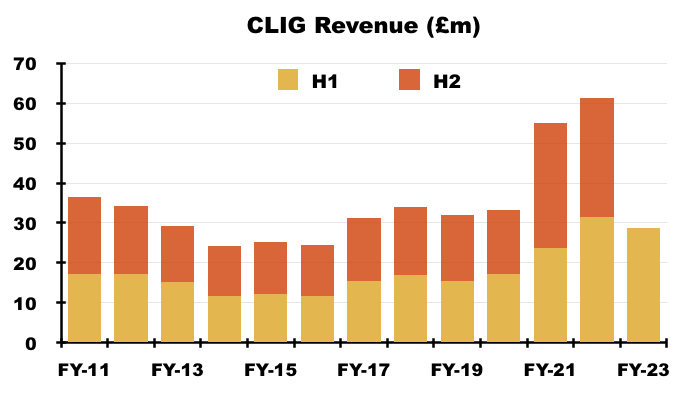
- The lower FuM during this H1 caused revenue to fall 9% to £28.7m:
- CLIG did not publish KIM’s revenue contribution for this H1 2023.
- Nor did CLIG publish KIM’s revenue for FY 2022 despite previously revealing the contribution for FY 2021 (nine months: £15.5m) and H1 2022 (£10.9m).
- Amalgamating KIM’s revenue with that of CLIG’s original City of London Investment Management (CLIM) division is not helpful towards evaluating the post-merger progress of both operations.
- But CLIG still publishes the average fee rates for both divisions, which were maintained at 71 basis points for CLIM and 76 basis points for KIM (see Exchange-rate/post-tax profit matrix).
- Excluding amortisation of £2.4m associated with the KIM merger, H1 operating profit was £11.6m and 7% less than the preceding H2 2022 (£12.4m) and 26% less than the comparable H1 2022 (£15.6m):
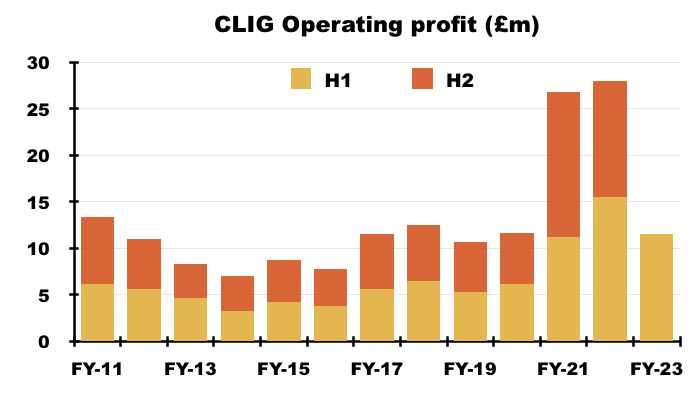
- The sizeable £4m profit shortfall versus the comparable H1 reflected lower revenue of £2.7m and extra costs of £1.2m.
- A stronger USD versus GBP helped this H1.
- The group’s H1 revenue was “almost entirely” denominated in USD, with the GBP:USD rate of 1.18 during this H1 comparing favourably to the 1.36 rate witnessed during the comparable H1.
- The recent GBP:USD rate of 1.27 suggests H2 2023 will not enjoy similar currency benefits (see Valuation).
- This H1 experienced a disappointing FuM development.
- After CLIG reported a run of four consecutive quarters of net client-money inflows, January’s Q2 update admitted clients had withdrawn a net $147m between October and December 2022 (see Funds under management: inflows and outflows).
- CLIG’s Q3 update during April disclosed a further $48m net outflow of client money (see Valuation).
- I had previously speculated whether the choppier markets of 2022 had prompted clients to gravitate towards CLIG’s ‘value’ style of buying investment trusts at wide discounts.
- But management comments at October’s AGM seemed to scotch that idea (“Analysis of our portfolios would show equal growth and value investments“).
- CLIG held the H1 payout at 11p per share and appeared to base that decision on a few weeks of “stable” markets:
“While it is prudent to retain a cautious approach to the coming year, the more stable conditions of recent weeks provide a degree of encouragement and it is with this in mind that your Board is declaring an unchanged interim dividend of 11p per share, despite lower profits for the period .“
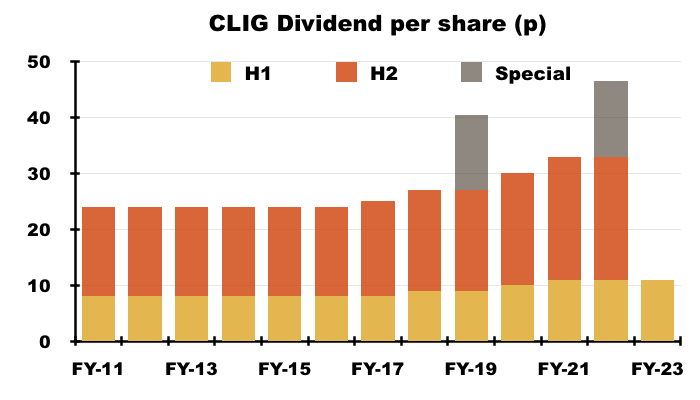
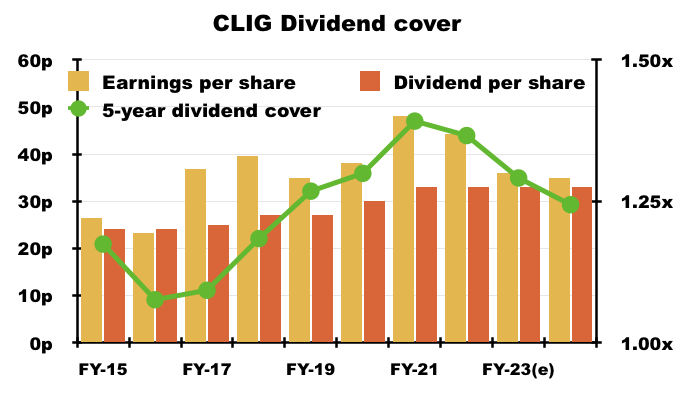
- Perhaps with one eye on trailing twelve-month dividend cover at 1.15x — and near-term dividend cover perhaps falling to 1.1x — CLIG reiterated its 1.2x dividend-cover target remained “appropriate” over rolling five-year periods.
- For the five years to December 2022, aggregate earnings were 203p per share and aggregate ordinary dividends were 152p per share to give rolling five-year dividend cover of 1.34x (see Valuation).
Funds under management: inflows and outflows
- CLIM’s FuM can be divided into two main categories:
- Emerging Markets (EM), and;
- Other strategies, which cover:
- Developed (or “International“) markets outside the United States;
- “Opportunistic Value“;
- “Frontier” markets, and;
- Seeded funds (REITs and “Global“).
- Both categories apply CLIG’s long-standing value approach of buying investment trusts at wide discounts and occasionally taking an activist stance.
- KIM meanwhile manages a mix of US equities (including investment trusts) and bonds.
- For years CLIG has struggled to attract significant sums of new client money.
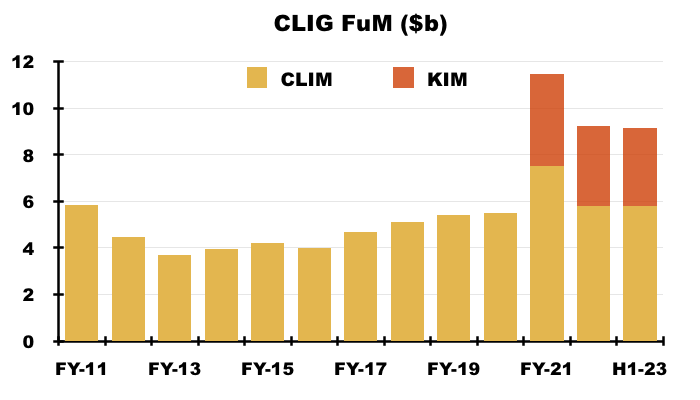
- The (very thin) red bars on the chart below show new client money has been minimal since FY 2016:
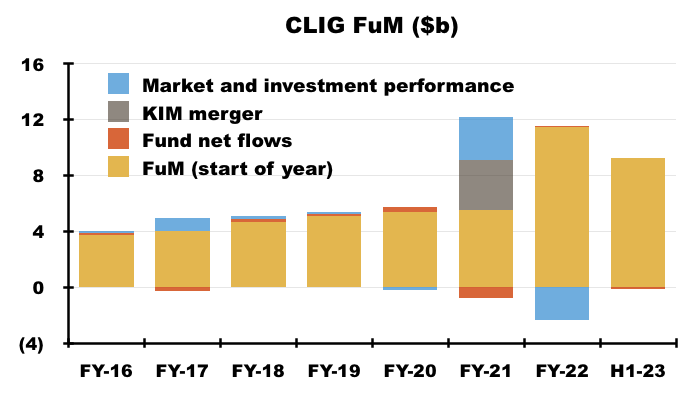
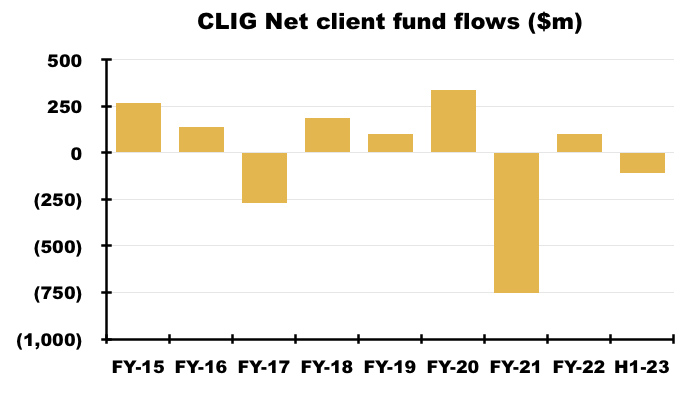
- Indeed, this H1 witnessed net withdrawals of $107m that negated the net inflows of $102m enjoyed during FY 2022…
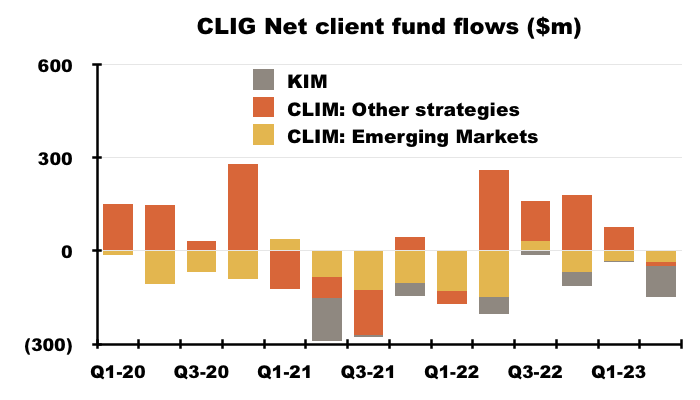
- …while FY 2021 witnessed net withdrawals of $752m, which almost entirely offset the aggregate net inflows of $758m enjoyed during the prior six years:
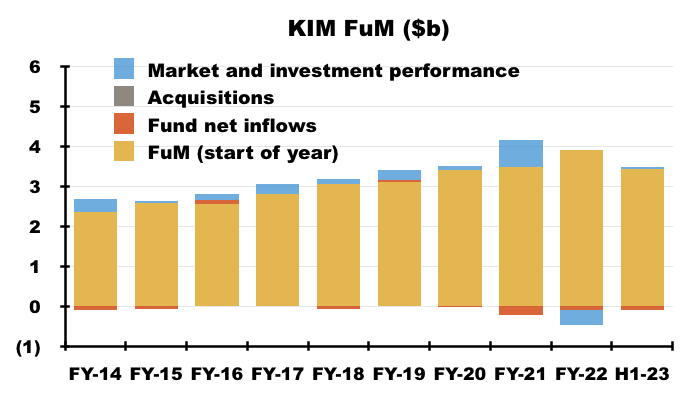
- Withdrawals at KIM remain frustrating.
- KIM’s clients withdrew a net $103m during this H1 to take total net withdrawals since the merger to $404m. CLIG blamed “loss aversion” among KIM’s retail investors for the latest outflow.
- KIM has yet to report a material net quarterly inflow of client money since the merger. Management during October’s AGM said KIM suffers “natural” outflows of $100m a year through clients withdrawing capital and income for retirement.
- Higher rates on cash were also a factor for KIM’s withdrawals:
“Additionally, due to the increase in interest rates in the US, financial institutions can offer Certificates of Deposit directly to [KIM’s] retail investors at higher interest rates compared to recent history.”
- KIM FuM at $3.4b remains less than the $3.6b enjoyed at the time of the (October 2020) merger.
- At least CLIG stated action had been taken at KIM:
“New business development remains a high priority for the KIM team in 2023 … A number of seasoned professionals have been added to the client-facing area of the firm who can leverage the improved systems and reporting capabilities that have been a focus of the integration post-merger. Client communications have been upgraded, along with a redesigned website, to improve KIM’s ability to share its story.“
- This H1 witnessed outflows of EM money extending to 12 of the last 14 quarters. CLIG blamed “asset class rebalancing” and “pension plan de-risking” for these latest EM withdrawals.
- CLIG’s Other strategies garnered a welcome $61m of net client money during this H1, albeit with net inflows recorded during Q1 and net withdrawals recorded during Q2.
- I am pleased CLIG has recognised the persistent client withdrawals have to be addressed:
“Clearly more effort is required on client retention – this remains a Group-wide priority.”
- The H1 movements had little effect on how FuM is split, with 39% still in EM, 37% still in KIM and 24% still in Other strategies:
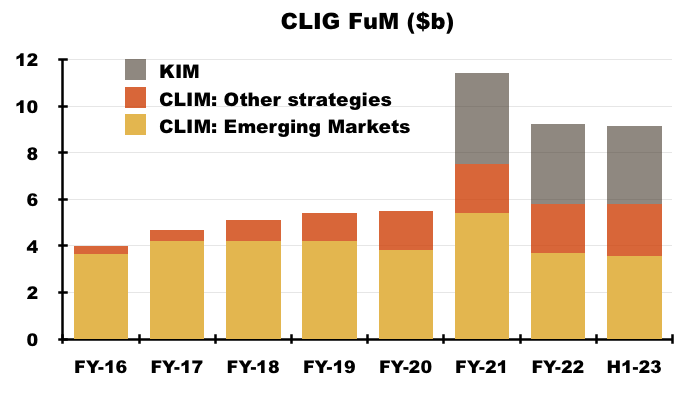
- 39% is the lowest proportion of EM FuM in CLIG’s history.
- EM funds represented 90% of client money during FY 2017, since when CLIG has deliberately tried to diversify its FuM by developing the Other CLIM strategies and undertaking the KIM merger.
- CLIG’s largest client appears not to have withdrawn too much money during this H1. Its gross fees declined 9% to match the general revenue decline versus H1 2022:
“Included in revenues are fees of £2,711,686 (year to 30th June 2022 – £5,825,226; six months to 31st December 2021 – £2,966,412) which arose from fee income from the Group’s largest client. No other single client contributed 10% or more to the Group’s revenue in any of the reporting periods.”
Funds under management: capacity limitations and growth plans
- CLIG said all of its CLIM strategies could accept extra client money:
“Given the market falls of 2022, all of CLIM’s strategies have the capacity to take additional funds and with face-to-face meetings now possible, the marketing effort in the institutional space will be given renewed impetus in the coming months.“
- Mind you, the results powerpoint reminded shareholders the EM strategy has “capacity” limitations:
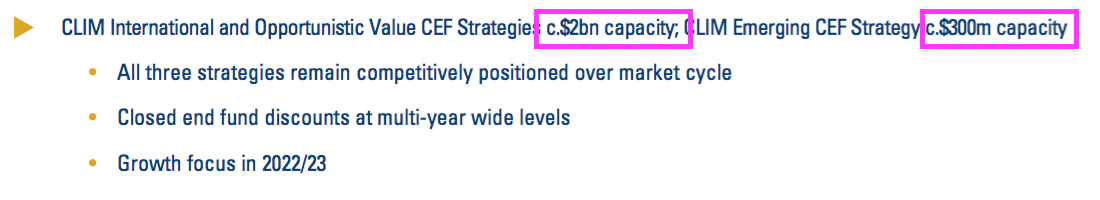
- Capacity problems occur when a fund becomes too large to outperform because of the restricted size of its target universe of stocks.
- Available capacity of $300m for EM is equivalent to only 8% of total EM FuM of $3.6b.
- At least the presentation reiterated the International and Opportunistic Value strategies could handle extra client money of $2b, which is almost double the $2.1b FuM invested in such approaches.
- Despite capacity limitations remaining unchanged and new staff being hired, CLIG has reined in its expectations of new money.
- The preceding FY 2022 had reckoned new client money of $385m could have been obtained during FY 2023:
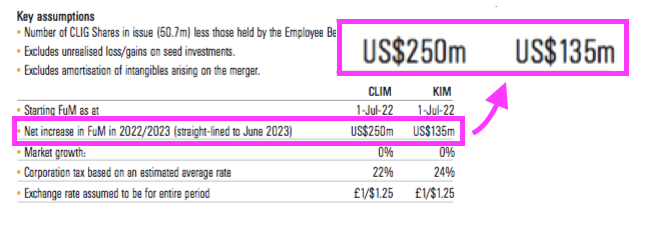
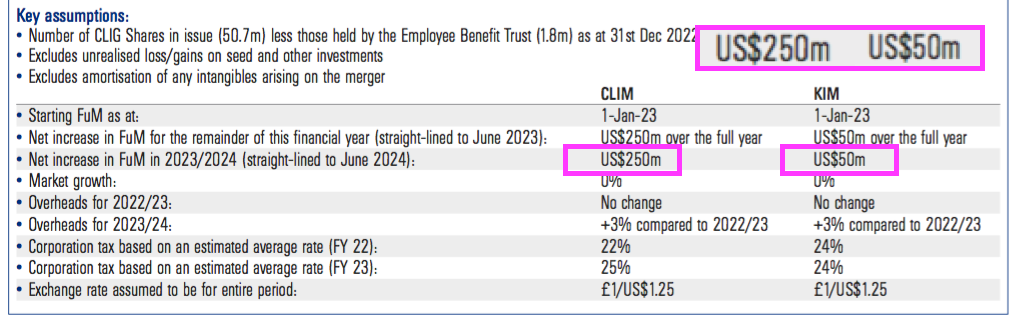
- But this H1 suggested $300m could be received during the next twelve months:
- For perspective, the preceding twelve months brought in net client money of $108m.
- An extra $300m is equivalent to only 3.3% of total H1 FuM of $9.2b.
- I note projected new KIM client money has been reduced from $135m to $50m.
- Continuing to expect any new KIM money seems quite ambitious given the division has suffered net withdrawals of $404m since the October 2020 merger:
- Expecting new client money of $250m for CLIM is not completely outrageous; CLIM attracted $338m during FY 2020 and $265m during FY 2015.
- New employees have been recruited to help win new client money:
“We have taken the opportunity in these six months to continue to invest in our two subsidiaries, CLIM and KIM at a time in the market cycle when other, less-conservatively run companies, may be under pressure. We have hired talented individuals at both Companies to support investment management, business development, and marketing. “
- This H1 did not mention anything about the fledgling Global strategy that was revealed during the preceding FY 2022.
- CLIG still seems prepared to buy somebody else’s FuM:
“We will also continue to evaluate external business opportunities that may appear in the aftermath of a challenging 2022 for many investment advisers.“
- Total FuM at CLIM and KIM has grown from $8.0b to $9.2b since 2011 — equivalent to an average annual growth rate of only 1.2%:
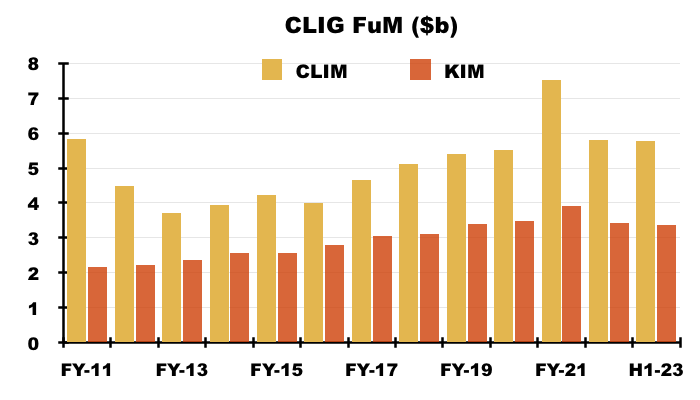
- The average annual growth rate for combined CLIM and KIM FuM since FY 2017 is 3.2%.
Funds under management: investment performance
- CLIG used various positive terms to describe its investment performance:
“The key driver in attracting additional assets across all strategies is performance and results for the most recent six-month period across both operating entities were highly encouraging.
Each of CLIM’s core strategies registered relative outperformance against their respective benchmarks while all but two of KIM’s seven strategies registered both positive returns and relative outperformance against their benchmarks, maintaining an excellent record through the full cycle of rising and falling markets of recent years.
Of particular note once again was the strong returns generated in KIM’s fixed income assets despite a widening of discounts in closed-end funds (CEFs) through most of 2022.“
- CLIG claimed its EM, International and KIM approaches had outperformed their associated benchmarks during the last five years:
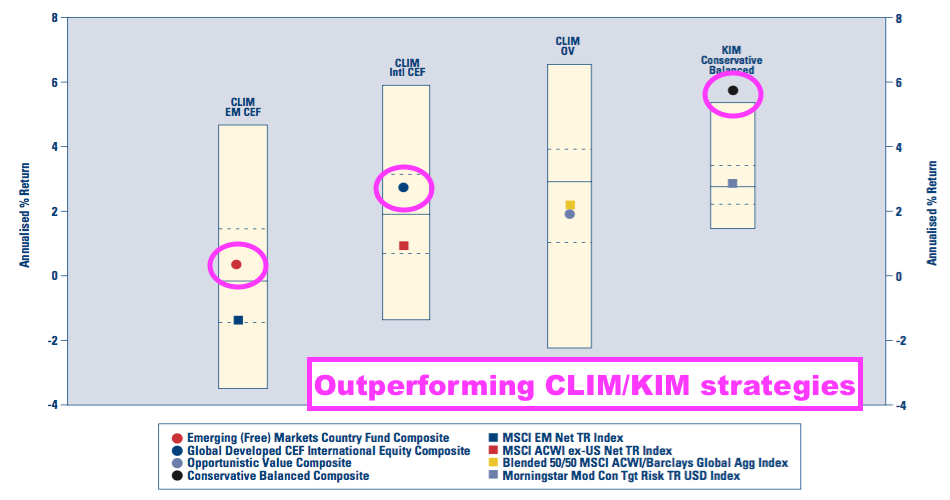
- The chart above suggests CLIG has delivered client returns of between 1% and 5% a year (before fees).
- The 3% mid-ground seems about right, given total CLIM/KIM FuM has gained 3% per annum since FY 2017 and new money received has been minimal.
- If CLIG claims its investment performance has been so great, why have new clients been so elusive?
- Well… CLIG introduced a new chart during the preceding FY 2022 that finally admitted what long-term clients (and shareholders) have almost certainly known for some time…
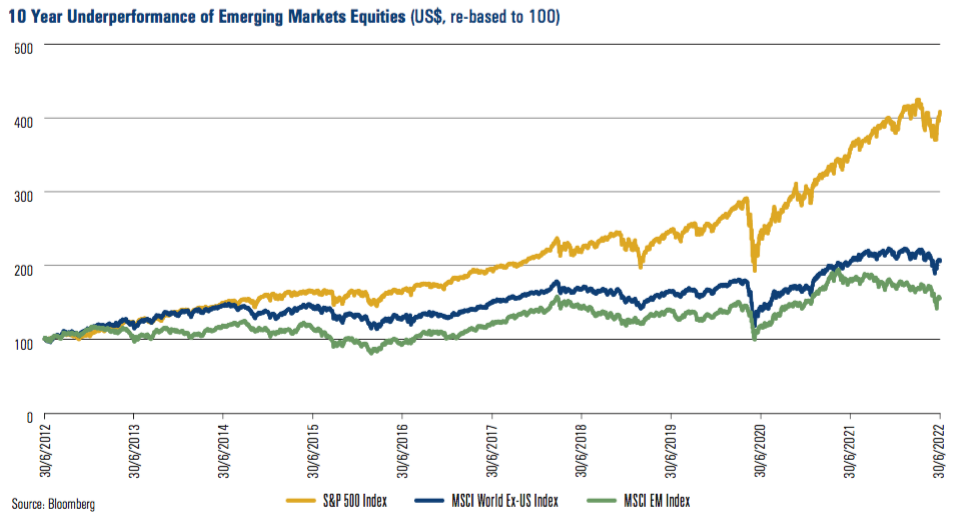
- …namely the S&P 500 has trounced emerging markets (and CLIM’s EM funds) over the last ten years.
- My calculations indicate the S&P 500 (in USD) has outperformed CLIM’s EM and Other strategies during FYs 2016, 2018, 2019, 2020 and 2022…
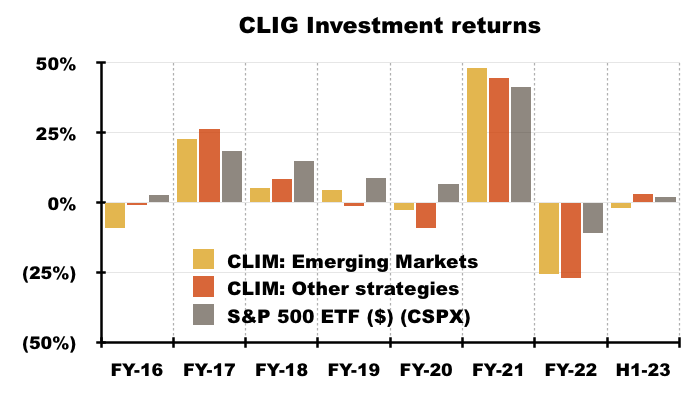
- …and gained 2% during this H1 versus a negative 2% for EM and plus 3% for CLIM’s Other strategies.
- The iShares S&P 500 ETF (CSPX) has gained 108% (in USD) between FY 2016 and this H1, versus my estimated 30% for CLIM’s EM approach and my estimated 33% for CLIM’s Other strategies.
- Prospective clients have perhaps compared CLIM’s funds to the S&P 500 rather than CLIM’s chosen benchmarks, which may explain the minimal new client money won during recent years.
- I raised the subject of the S&P 500’s outperformance during October’s AGM.
- Management admitted at the AGM that some clients have asked in trustee meetings: “What are we doing in emerging markets when the S&P 500 has outperformed?”.
- Management explained at the AGM that clients:
- “Still want diversification“;
- Swap from EMs to other strategies to stay with CLIM;
- “Completely understand” why CLIM may underperform against the S&P 500, and;
- Exhibit prudence and don’t go “all in” on particular asset types.
- Management suggested the S&P 500 outperformance would one day revert to underperformance:
“Things can not go up for ever, they will eventually stop”
- CLIG’s relative returns have not improved following this H1.
- During CLIG’s Q3 2023 (January to March 2023), CLIM’s strategies returned between 3% and 6%, KIM’s portfolios returned 4% while the S&P 500 returned 7% (see Valuation).
Funds under management: fee rates
- CLIG said group fee rates had dropped a basis point to 73 basis points versus the comparable H1…
“Net fee income currently accrues at a weighted average rate of approximately 73 basis points (31st December 2021: 74 basis points) of FuM.”
- …while April’s Q3 2023 update admitted the group’s fee rate had declined a further two basis points to 71 basis points:
“The Group’s income currently accrues at a weighted average rate of approximately 71 basis points of FuM, net of third‐party commissions“
- This latest reduction appears due to clients chipping away at fees.
- CLIG’s fee rates had declined for years before the KIM merger…
| Year to 30 June | 2016 | 2017 | 2018 | 2019 | 2020 |
| CLIM net fee rate (bps) | 86 | 84 | 80 | 76 | 75 |
- … and I had accepted the introduction of lower-fee strategies such as International had influenced the overall group fee rate.
- But with CLIG’s FuM split remaining at 39% EM, 37% KIM and 24% Other strategies during Q3 2023, I can’t see different FuM proportions affecting the overall group fee rate this time.
- Markets generally suffered a rough 2022, and I speculate clients kicked off 2023 by demanding lower fees.
- The H1 exchange-rate/post-tax profit matrix highlighted CLIM fees at 71 basis points and KIM fees at 76 basis points…
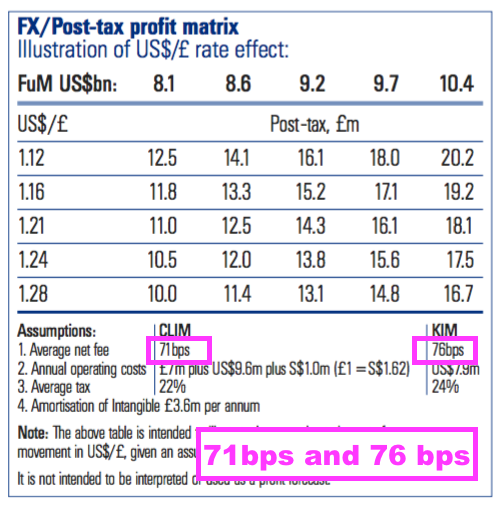
- …which has now become stale following the subsequent Q3 2023 group fee of 71 basis points (see Exchange-rate/post-tax profit matrix).
- Reduced disclosure also hints at clients chipping away at fees. The latest Q3 2023 update referred only to the group fee rate, while the comparable Q3 2022 update referred to both CLIM’s fee rate (then 71bps) and KIM’s fee rate (then 76bps).
- I raised the subject of reduced fee rates during October’s AGM.
- Management said the whole industry was “facing lower fees”, and the decline also reflected the lower fees charged by the International strategy.
- Management added that fee rates charged by particular strategies would not be disclosed, and the defensive tone of management’s AGM replies about fees gave the distinct impression the matter was very sensitive.
- Note how KIM’s fee rate has reduced.
- The merger document (point 5) claimed KIM enjoyed a “fairly stable” net fee rate of 80 basis points.
- But the FY 2021 results said KIM fees were 77 basis points, and this H1 revealed KIM fees at 76 basis points.
- I speculate fee rates will not stabilise until CLIG’s investment performance improves.
- After all, if typical long-term clients have indeed earned annual gross returns of c3% (i.e. 300 basis points), then fees at 71 basis points will capture 24% of their gains.
- While many clients may indeed employ CLIG for “diversification” purposes, the attractions of an S&P 500 ETF that:
- Absorbs fees of 10 (or less) basis points, and;
- Continues to outperform CLIG’s funds…
- …must surely prompt doubts about their diversification stance.
Management
- My FY 2022 review highlighted this intriguing small-print from the 2022 annual report:
“George Karpus will continue to serve on the Board for the 2022-2023 financial year and we will provide an update prior to next year’s AGM regarding his future plans.“
- George Karpus founded KIM during 1986, led the business until the 2020 merger and then retired to become a CLIG non-exec. Mr Karpus remains a significant, 36%/£78m CLIG shareholder:
- I wrote in my FY 2022 review:
“I plan to attend the 2022 AGM and I hope Mr Karpus is there to shed some light on his future plans.”
- Mr Karpus did indeed attend October’s AGM and management (surprisingly) disclosed he would stand down from the board during 2023.
- CLIG confirmed in May — seven months after the AGM — that Mr Karpus would indeed stand down from the board at the end of July.
- Mr Karpus and the rest of CLIG’s board were expecting me at the AGM. All the directors had seemingly read my FY 2022 review and Mr Karpus even commented:
“You made some good points in your thesis. You were spot on about a couple of things“.
- Mr Karpus did not elaborate on the things on which I was “spot on“, but I trust elusive new clients were among them.
- CLIG announced during May:
“Whilst Mr. Karpus will be stepping down from his Director role, the Company will retain Mr. Karpus as a strategic advisor to the Board.“
- My impression from the AGM was Mr Karpus could be a vocal “strategic advisor” to the board.
- That May statement also said:
“George Karpus commented, “I have enjoyed my time on the Board of CLIG and look forward to supporting the Company in the future as the management works to add value for clients, shareholders and employees.” “
- No doubt I am reading far too much into this, but Mr Karpus listed shareholders ahead of employees in that above farewell…
- …while CLIG within this H1 listed employees ahead of shareholders:
“The Group exists for the mutual benefit of our three primary stakeholders: Clients, Employees and Shareholders.”
- I have never been quite sure whether CLIG is run for the benefit of its employees or for the benefit of its shareholders.
- CLIG noted this H1 had witnessed “increased” salaries:
“In the shorter term, the rate of unemployment in the US remained at historically low levels resulting in fewer candidates for open positions. That, along with inflationary pressures, had an impact on increased salary levels.”
- Shareholders meanwhile received an unchanged H1 dividend.
- Mr Karpus knows how to run a tight ship. Before the merger, KIM enjoyed a superb c60% operating margin, with FuM per employee 27% greater and revenue per employee 31% greater than the respective levels at CLIM (points 8 and 9).
- I do hope outside shareholders can rely on Mr Karpus — in his new role as “strategic advisor” — to provide frank views to the board on employee productivity.
Exchange-rate/post-tax profit matrix
- CLIG’s exchange-rate/post-tax profit matrix has been revised again:
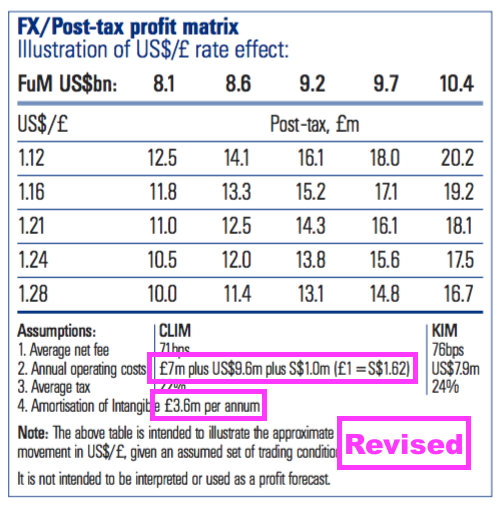
- Revisions to the matrix since FY 2022 include:
- CLIM costs increasing from “£6.7m plus $9.4m” to “£7m plus $9.6m”, and;
- “Amortisation of intangible” increasing from £3.4m to £3.6m.
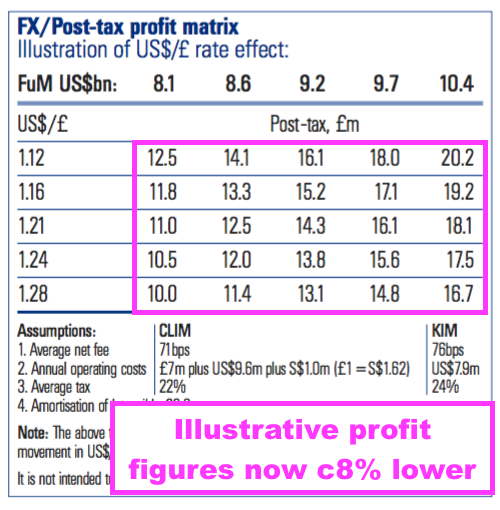
- The greater CLIM costs have reduced the associated illustrative earnings by approximately 8%.
- For example:
- FuM of $9.2b at GBP:USD of 1.16 now indicates earnings of £15.2m versus £16.5m previously, and;
- FuM of $10.4b at GBP:USD of 1.28 now indicates earnings of £16.7m versus £18.1m previously:
- The illustrative matrix-profit figures appear to correlate with this H1’s underlying earnings.
- CLIG said GBP:USD averaged 1.18 and its website shows FuM averaging approximately $9.1b during this H1…
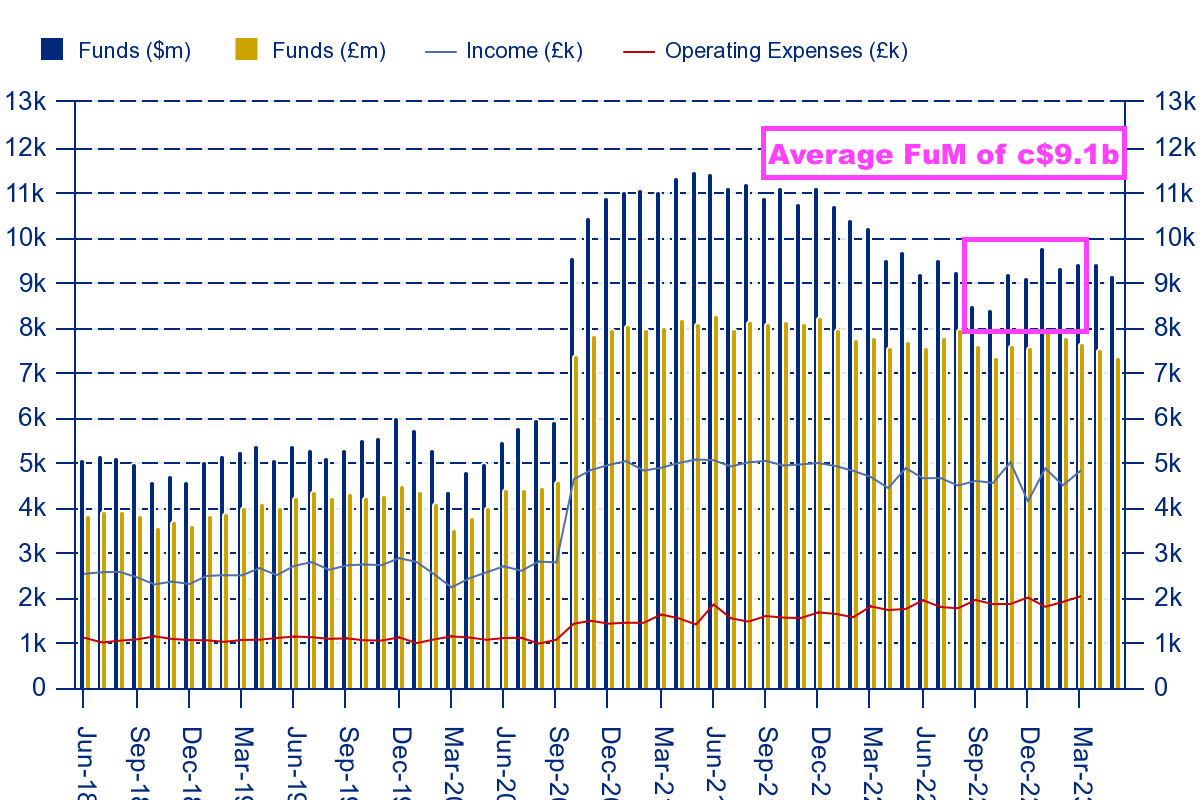
- …which I estimate would give earnings of £14.4m if GBP:USD of 1.18 and FuM of $9.1b were applied to the revised matrix.
- CLIG declared underlying H1 earnings of £9.0m…
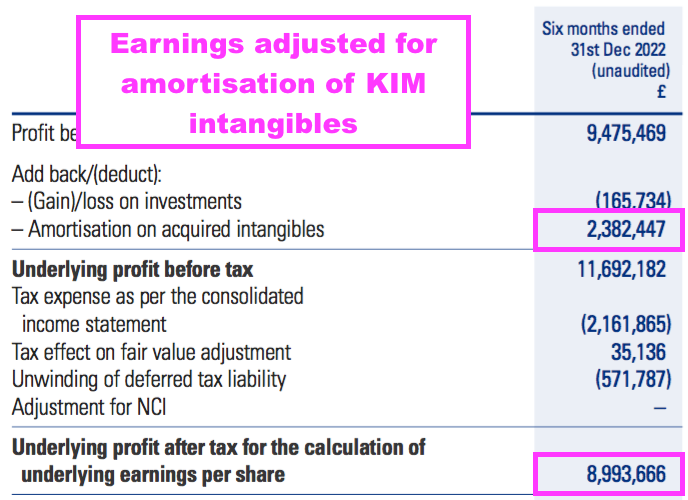
- …which doubled up gives £18.0m.
- The £3.6m difference (£18.0m less £14.4m) is (I think) explained by the amortisation of the acquired KIM intangibles, which was cited at £3.6m within the illustrative matrix’s assumptions.
- I believe currency movements explain why the matrix cites £3.6m for amortisation while actual trailing twelve-month amortisation was £4.6m (the acquired KIM intangibles are denominated in USD but translated into GBP for the group accounts).
- Older matrices have noted the 30% profit share for the CLIM division:
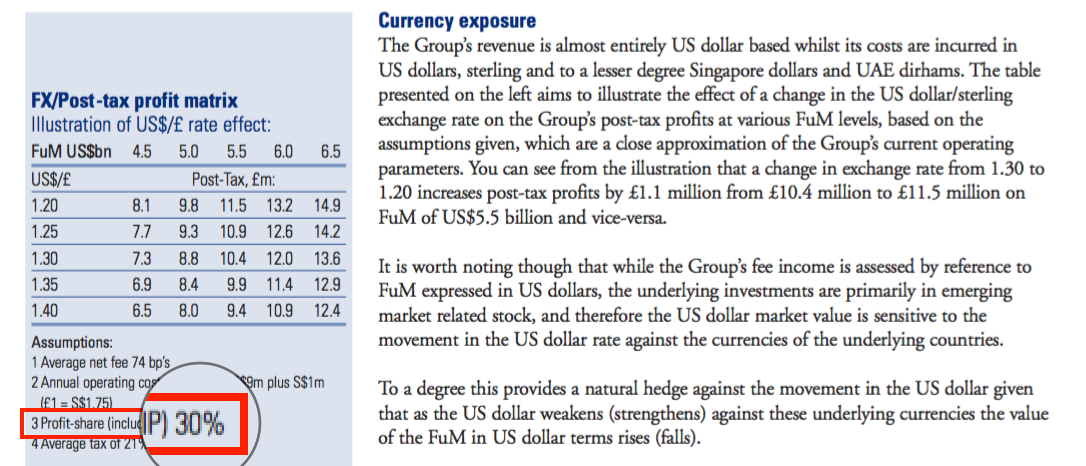
- But following the KIM merger, the profit-share assumption was removed and the illustrative post-tax figures can no longer be derived from the matrix assumptions that remain.
- Mind you, CLIG has always said the matrix is “not intended to be interpreted or used as a profit forecast.”
- This H1 indicated a 24% profit share:
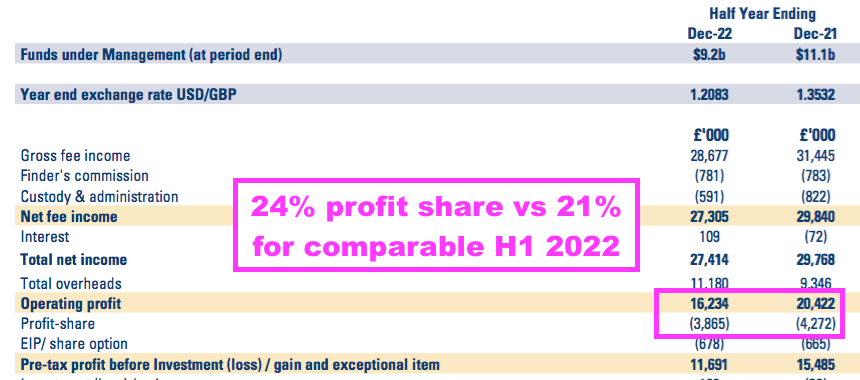
- The 2022 annual report confirmed a maximum possible 30% profit share, and earnings will suffer if the full 30% is ever paid.
- I raised the subject of profit share reaching 30% during October’s AGM.
- Management replied that during “down markets with less profit“, CLIG would be “shooting ourselves in the foot” to take a higher percentage.
- CLIG might have already shot itself in the foot. The 24% profit share for this H1 compares to 21% for the comparable H1 — a higher proportion despite pre-profit-share profit being 20% lower.
- Management also said during the AGM the profit share was a “cultural thing” and “if shareholders do well, employees should be doing well“.
- But should employees be doing well if shareholders are not doing well?
- I have never been entirely sure whether the profit-share scheme has actually incentivised the workforce.
- Between FYs 2015 and 2022, CLIG’s wages and salaries totalled £55m… and were enhanced 82% by aggregate profit-sharing payments of £45m.
- The same eight-year period meanwhile witnessed a minimal aggregate inflow of net client money (see Funds under management: inflows and outflows).
Financials
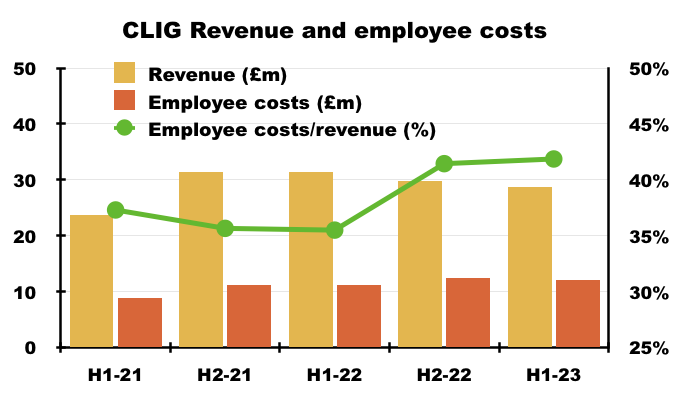
- Despite rising salaries, CLIG remains a high-margin business. Operating profit before amortisation represented a super 40% of revenue during this H1:
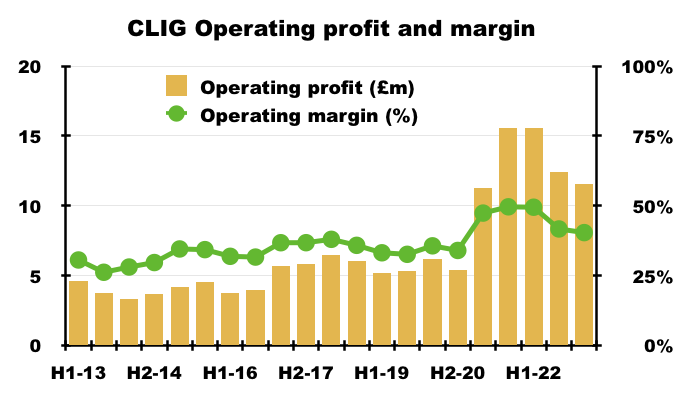
- Mind you, the margin touched 50% during H2 2021 just after the KIM merger (helped by KIM’s then c60% margin!) and had already reached 38% during H1 2021 (prior to the KIM merger).
- Margins are therefore not what they were, with employee costs extracting 42% of revenue during this H1:
- CLIG noted the stronger US dollar lifted costs during H1:
“…[A]dministrative expenses rose by c.12% to £18.1 million, reflecting a combination of higher payroll costs, ongoing investment in IT systems and business development. It is important to note, however, that c.64% of Group overheads arise in US dollars so the average 14% fall in the £/US$ exchange rate YoY translates to correspondingly higher costs when expressed in sterling terms.”
- Granted, the text above is accurate,
- But revenue is “almost entirely” denominated in USD as well…
- …which means CLIG is an overall beneficiary of a stronger USD as this H1 in fact confirmed:
“It is evident that a stronger US dollar increases sterling post-tax profits, whilst a weaker US dollar causes the opposite”
- As mentioned earlier, the H1 exchange-rate/post-tax profit matrix revealed CLIM costs had increased from “£6.7m plus $9.4m” to “£7m plus $9.6m”.
- The balance sheet showed cash at £19.1m, investments at £7.6m and conventional bank debt of zero.
- H1 interest on the cash was a handy £182k, versus only £5k for the comparable H1.
- Cash conversion for this H1 was once again quite acceptable. Adjusted earnings of £9.0m translated into free cash after tax, capex and lease payments of £8.6m.
- The £10.7m to fund the final FY 2022 dividend and £1.5m spent on shares for the Employee Benefit Trust (EBT) then left overall cash £3.6m lighter.
- CLIG’s EBT expense reflects the true cash cost of CLIG’s staff share schemes and is worth monitoring.
- During FYs 2020, 2021 and 2022, and this H1, the EBT spent £8.7m buying shares to satisfy exercised options and received £1.5m from those exercised options — equating to a net shareholder cost of £6.2m.
- In contrast, the associated accounting charge during that same period was £2.9m. I would therefore venture reported earnings are not a true reflection of shareholder profit because of the EBT expenditure.
- The EBT purchased shares at an average 391p during this H1. Purchases made after the half year have been undertaken at prices between 427p and 440p.
- CLIG’s accounts remain free of defined-benefit pension obligations.
Valuation
- CLIG’s chairman acknowledged his previously “premature” optimism…
“While I may have been a little premature in my September statement to shareholders in expressing a degree of optimism…”
- …although he still refers to “green shoots“:
“If, as indicated in recent weeks, inflation subsides in the coming months, policy makers are likely to be more willing to rein back from further monetary tightening, thereby easing the growing wage inflation pressures that otherwise threaten a return to trend growth in 2023. Thus, while it may be premature to voice optimism for the year ahead, there are sufficient green shoots to suggest that the significant dislocation to the global economy, which was the feature of 2022, will prove transitory.”
- This H1 included a revised dividend-cover chart.
- The previous version had predicted earnings of £3.9m would be retained for FY 2023.
- But the new version now predicts £1.5m will be retained for FY 2023, and also predicts £1.0m will be retained for FY 2024:
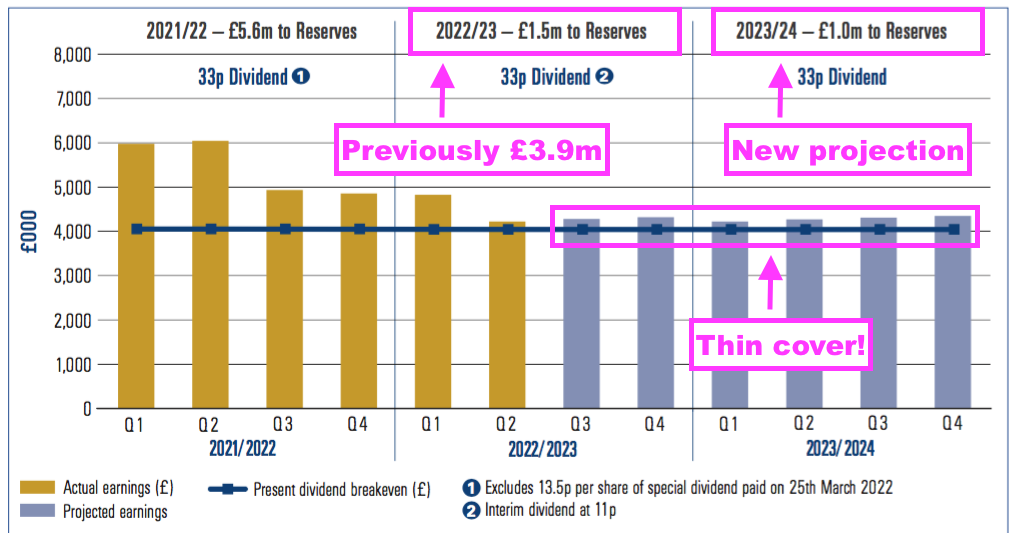
- The revised £1.5m is equivalent to 3p per share and, when added to the 33p per share dividend, implies FY 2023 earnings might now be 36p per share.
- But retained earnings of £1m for FY 2024 signals earnings of 35p per share, leaving prospective dividend cover rather thin given the 33p per share payout.
- I calculate CLIG’s rolling five-year dividend cover will be 1.24x by FY 2024 assuming:
- Earnings of 36p and 35p per share for FYs 2023 and FY 2024, and;
- The 33p per share dividend is maintained:
- CLIG’s 1.2x target dividend cover for rolling five-year periods — alongside the aforementioned £19m (c37p per share) cash position — ought to mean the 33p per share payout can be sustained for FY 2023 and hopefully FY 2024 as well.
- That said, the Q3 2023 (January-March 2023) update published during April gave a mixed picture:
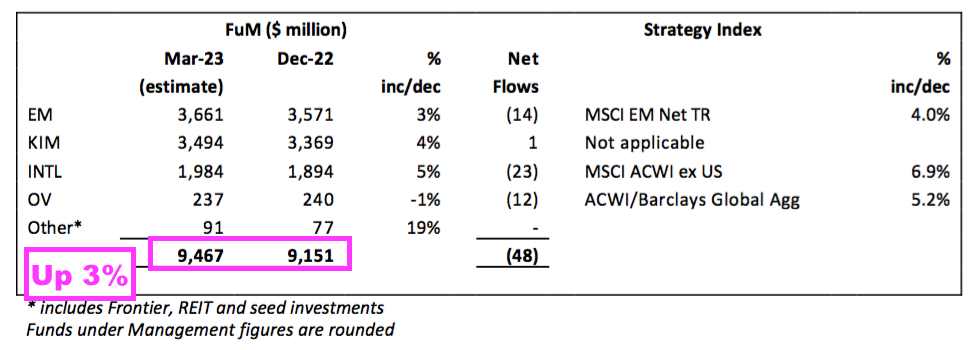
- The good news was Q3 FuM advanced 3% to $9.5b, CLIG’s highest level for twelve months.
- The not-so-good news was clients withdrew a net $48m (although KIM recorded its first ever inflow following the merger with a $1m positive inflow!)
- The 3%, 4% and 5% Q3 increases to client money reported for EM, KIM and International compared to a 7% advance for the S&P 500.
- FuM at Q3’s $9.5b is 8% less than the level seen twelve months prior ($10.3b) and 17% less than the all-time high level enjoyed at the end of FY 2021 ($11.4b).
- The bad news from the Q3 update was CLIG said pre-profit-share profit during Q3 ran at £2.5m a month:
“‘Fixed” costs are c.£2.0 million per month, and accordingly the current run‐rate for operating profit before profit‐share is approximately £2.5 million per month based upon current FuM and a US$/£ exchange rate of US$1.2337 to £1 as at 31 March 2023.”
- The rate for Qs 1 and 2 was £2.7m:
January 2023 (Q2): “Fixed” costs are c. £1.9 million per month, and accordingly the current run-rate for operating profit before profit-share is approximately £2.7 million per month based upon current FuM and a US$/£ exchange rate of US$1.2083 to £1 as at 31 December 2022.
October 2022 (Q1): “Fixed” costs are c.£1.8 million per month, and accordingly the run-rate for operating profit, before profit-share is approximately c.£2.7 million per month based upon current FuM and a US$/£ exchange rate of US$1.117 to £1 as at 30 September 2022.“
- £2.5m a month with a 24% profit share and 25% tax would give earnings of £17.1m or 34p per share.
- Possible earnings of 34p per share compare with:
- The adjusted 44p per share reported for the preceding FY 2022;
- The 36p per share projected by the revised dividend-cover template, and;
- The trailing 33p per share twelve-month dividend.
- CLIG’s website shows FuM falling back to $9.1b during May 2023…
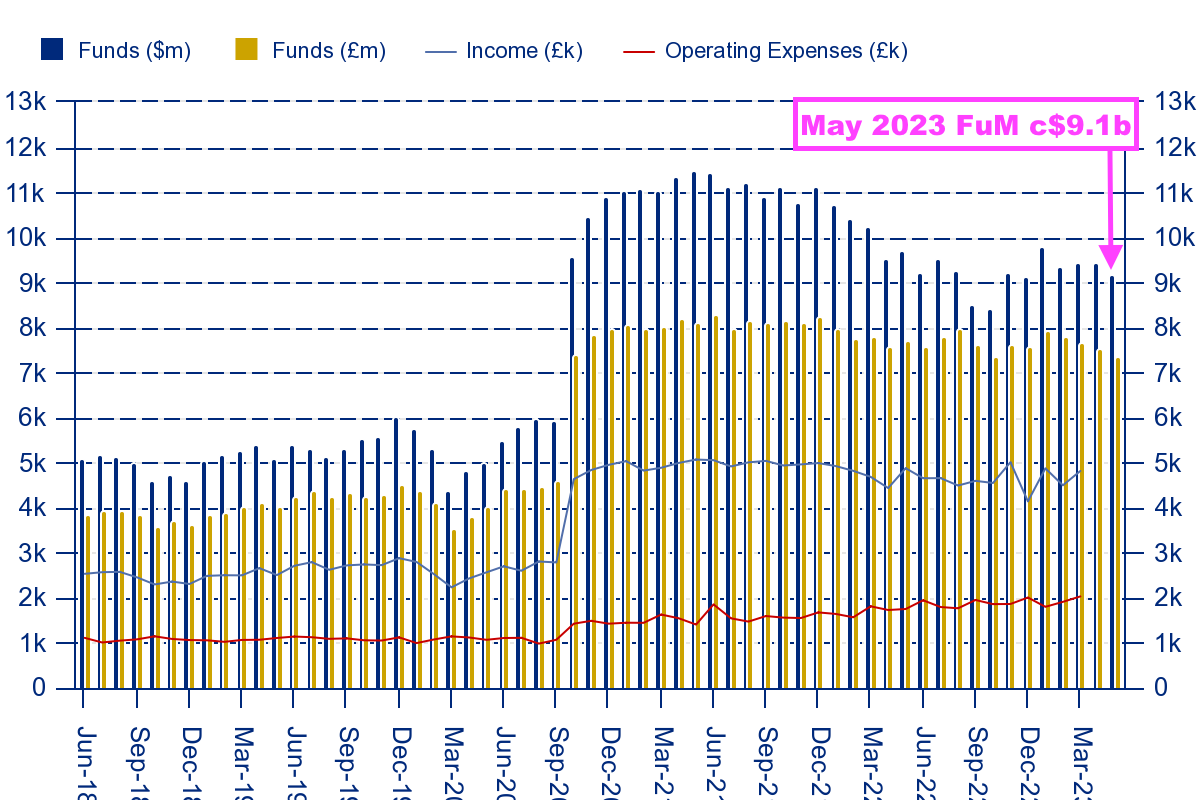
- …which suggests current earnings are more likely to be running at 34p than the 35p-36p per share implied within the dividend template.
- Earnings of 34p per share for the next twelve months would cover the trailing 33p per share dividend 1.03x and give a rolling five-year dividend cover of 1.27x.
- Earnings of 34p per share and the trailing 33p per share dividend put the 425p shares on a multiple of 12-13x and yield of 7.8%.
- CLIG’s rating does not look expensive, but the trailing P/E has frequently been less than 12 and trailing yield has almost always offered more than 6%:
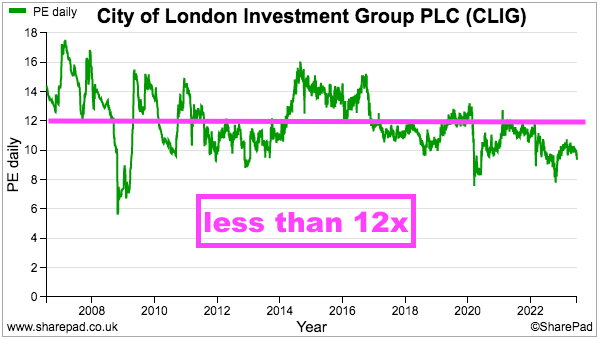
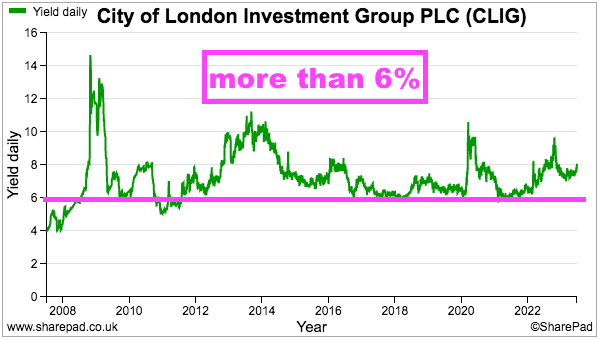
- For some perspective, I last bought CLIG shares during October 2022 when the price was 353p, the trailing P/E was 8 and the trailing yield topped 9%.
- Future returns can be judged through CLIG’s (commendably public) total-return ambition:
“CLIG’s management team has a share price Key Performance Indicator (KPI), which is for the total return (share price plus dividends) of a CLIG share to compound annually in a range of 7.5% to 12.5% over a rolling five-year period. This KPI is meant to stretch the management team, without incentivising managers to take undue levels of risk.“.
- The minimum 7.5% compound annual total return during the next five years appears very achievable, assuming of course the 33p per share dividend is held to support that 7.8% income.
- But whether maintaining the dividend for five years will actually “stretch the management team” is another matter.
- The 425p share price is back to where it was more than ten years ago…
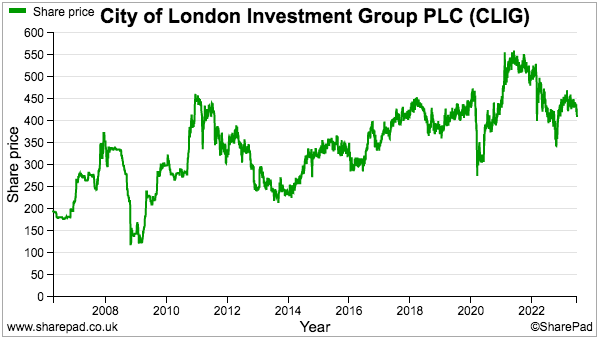
- …and until George Karpus kicks up a fuss about finding new clients, the handsome yield continues to be the major attraction — with capital gains seemingly dependent on a broad market recovery.
- I first bought CLIG during 2011 at 355p and the shares have since delivered a very generous income. Total payouts (ordinary and special) throughout the last twelve years have totalled 349p per share to almost recoup my initial investment.
- But the increasing danger for myself and long-term shareholders is the handsome payout eventually becomes untenable as:
- New clients remain elusive;
- Markets remain subdued;
- Client fees keep reducing, and;
- Costs keep advancing.
Maynard Paton

Very impressive, thank you Maynard for your review. It’s already 10 years I am a shareholder (bought at 2,40£). It is a small position for me so I don’t monitor as well as you do.
Thanks Eric. You must have made your entire investment back through dividends?!
Maynard
City of London Investment (CLIG)
Trading Update published 25 July 2023
Not an inspiring statement. Funds under management (FuM) experienced their third consecutive quarterly net outflow while prospective dividend cover remains very thin for FY 2024.
Here is the full text interspersed with my comments:
——————————————————————————————————————
City of London (LSE: CLIG), a leading specialist asset management group offering a range of institutional and retail products investing primarily in closed-end funds (“CEFs”), provides a pre-close trading update for its financial year ended 30 June 2023. The numbers that follow are unaudited.
On a consolidated basis, Funds under Management (FuM) were US$9.4 billion (£7.4 billion) at 30 June 2023. This compares with US$9.2 billion (£7.6 billion) at the Group’s year end on 30 June 2022. A breakdown by strategy follows:
Although wider discounts were a headwind for all CEF strategies, investment performance was ahead of benchmark for the bulk of CLIM’s assets due to strong NAV performance in the Emerging Market strategy. The International strategy was slightly behind benchmark over the period while the Opportunistic Value strategy outperformed. KIM’s taxable fixed income, conservative balanced and SPAC strategies outperformed their market indices over the period, while equity strategies lagged their benchmarks.
Net investment outflows were US$357 million for the Group over the period as clients reduced exposure to markets due to ongoing volatility, pension fund de-risking and competition from cash products. Attractive discounts across the strategies will be the focus of marketing efforts in the second half of 2023.”
——————————————————————————————————————
Total Q4 FuM of $9,424m was only $43m less than the $9,467m reported for Q3. But the net outflows of $357m for the FY mean Q4 witnessed net outflows of $202m — the largest quarterly net outflow since Q3 2021 ($278m, Jan-Mar 2021). Q4 outflows were mostly EM at $127m with $41m for International, $27m for KIM and $7m for OV and Other.
Those Q4 outflows mean CLIG has reported net outflows for three consecutive quarters. Clearly clients continue to seek better opportunities elsewhere, and the share price is unlikely to be re-rated higher until CLIG can sustain net inflows of client money. Disappointing also that outflows were experienced throughout different product strategies despite some strategies outperforming.
My calculations suggest total inflow/outflows since 2015 come to a negative $255m. So net client money has left CLIG during the last nine financial years.
——————————————————————————————————————
Operations
The Group’s income currently accrues at a weighted average rate of approximately 71 basis points of FuM, net of third party commissions.
The Group’s overheads for the year to 30 June 2023 are expected to be £22.5 million (2022: £19.7 million), primarily as a result of weaker sterling against USD as well as higher employee retention and retirement costs during the year. “Fixed” costs are c.£1.9 million per month, and accordingly the run-rate for operating profit, before profit-share and amortisation of intangibles is approximately £2.6 million per month based upon current FuM and a US$/£ exchange rate of US$1.2703 to £1 as at 30 June 2023.
For the year to 30 June 2023, the Group estimates that the unaudited profit before amortisation of intangibles and taxation to be approximately £23.4 million (2022: £27.2 million profit before amortisation of intangibles).
Profits after an anticipated tax charge of £3.9 million (representing 21% of profits before taxation) will be approximately £14.8 million (2022: profits of £18.1 million after a tax charge of £5.0 million, representing 22% of profits before taxation). Basic and fully diluted earnings per share are expected to be 30.4p and 29.8p respectively (2022: 36.9p and 36.4p).
——————————————————————————————————————
I am pleased clients have not chipped away further on fees, with 71 basis points of FuM thankfully matching the rate declared within the preceding Q3 update. I am also pleased ‘underlying’ operating profit is running at £2.6m a month rather than the £2.5m a month cited within the preceding Q3 update.
Pre-tax profit before amortisation at £23.4m less tax of £3.9m gives ‘underlying’ earnings of £19.5m or c38.5p per share, with £10.5m/c21p apparently delivered during H2.
——————————————————————————————————————
Dividend
The Board is proposing to recommend a final dividend of 22p per share (2022: 22p), subject to approval by shareholders at the Company’s Annual General Meeting to be held on 23 October 2023. This would bring the total dividend payment for the year to 33p (2022: 33p, special dividend 13.5p). Rolling five-year dividend cover based on underlying profits, excluding the special dividend equates to 1.24 times (2022: 1.34 times).
The Board confirms the final dividend timetable for the year to 30 June 2023:
· Ex-dividend date: 28 September 2023
· Dividend record date: 29 September 2023
· DRIP election date/deadline for currency election: 6 October 2023
· Announcement of USD dividend conversion rate: 13 October 2023
· Dividend payment date: 27 October 2023
City of London expects to announce its final results alongside publication of its Accounts for the year to 30 June 2023 on 18 September 2023. The Group’s Annual General Meeting will be held on 23 October 2023.
City of London Investment Group is a UK registered company, listed on the London Stock Exchange and declares its dividends in GBP. Shareholders based in the US can now elect to receive dividends in USD, should they wish to do so. The currency conversion rate from GBP to USD will be fixed two weeks before the dividend payment date. The currency election form can be found on our website at https://www.clig.com/investor-reports/Currency-Election-Form-2022.pdf
Alternatively, overseas shareholders may be able to use the International Payment Service (IPS) and receive dividend payments direct to their bank account in local currency. Further information regarding the IPS including terms and conditions, costs and forms for signing up are available from Link Group at https://ww2.linkgroup.eu/ips.
——————————————————————————————————————
A final 22p per share dividend is as I had anticipated within the blog post above, giving 33p per share for the third consecutive year.
If FY 2023 EPS is in fact 38p, then I make rolling 5-year dividend cover to be 1.30x. Not sure if CLIG’s 1.24x calculation takes into account some KIM integration costs or investment gains/loss that were deemed non-underlying at the time. More importably perhaps is future dividend cover…
——————————————————————————————————————
Dividend cover template
Please see dividend cover template attached here: http://www.rns-pdf.londonstockexchange.com/rns/0093H_1-2023-7-24.pdf
The dividend cover template shows the quarterly estimated cost of dividend against actual post-tax profits for last year, the current year and the assumed post-tax profit for next financial year based upon specified assumptions.
——————————————————————————————————————
Here is the new dividend-cover template:
Two changes from the preceding H1 version:
i) A seemingly better H2 now sees retained earnings for FY 2023 increase £0.6m to £1.5m, and;
ii) Possible retained earnings for FY 2024 have decreased by £0.4m to £0.6m.
Retained earnings of just £0.6m after paying a 33p per share dividend suggests EPS of 34p — and wafer-thin dividend cover.
The template still assumes inflows running at $250m a year, which remains optimistic given the $357m yearly outflow just confirmed.
——————————————————————————————————————
Functional and reporting currency change
The functional currency of the Company and the presentational currency of the Group will change to US dollars with effect from 1 July 2023.
The Group’s revenue is almost entirely US dollar based and the Board believes that this change will provide investors and other stakeholders with greater transparency of the Group’s performance and reduced foreign exchange volatility.
There will be no change in the Group’s dividend policy, and dividends will continue to be declared in GBP with an option for shareholders based in the US to elect to receive dividends in USD.
Following the change in the Group’s presentational currency with effect from 1 July 2023, the Group’s interim results for the six-month period ended 31 December 2023, and all subsequent financial information, will be prepared using US dollars as the presentational currency. Comparative information will also be provided in US dollars as required by the relevant Accounting Standards.
——————————————————————————————————————
The switch from GBP to USD for reporting purposes seems sensible enough, and comparisons year-on-year will have less exposure to currency movements. But currency movements will influence USD-denominated profit as approximately a third of costs are GBP-denominated.
I do wonder if the presentation-currency change could allow a dividend cut by the back door. CLIG says dividends will be declared in GBP, but surely the payouts will be determined first in USD and then translated into GBP… and that translation may one day result in less than the current 33p per share. In theory the reporting-currency switch should not make a difference, but the prospective wafer-thin cover does worry me about an effective cut (at least in GBP).
Maynard
You missed an interesting AGM for CLIG this morning, Maynard. There were five or six individual shareholders in attendance, but I was the only one to ask any questions. I recall that you had the same experience last year. I will try to do a short post about this when I have some spare time. However, the most interesting bit came right at the start of the Q&A (held before the formal AGM business)when a BNY Mellon representative attending as proxy on behalf of George Karpus read out a statement on his behalf.
The statement started by rehearsing the compelling logic for the CLIG/Karpus merger and the vision to create a world leading fund management business. He went on to say that he was even more confident in that vision today, notwithstanding current market headwinds and that he could see the business doubling in 5 years and tripling in 10 (one of the things I asked some questions about later). However, he then went on to lambast the directors collectively (as distinct from the managers) who he said had shown no vision and no commitment- including a failure to invest personally in the business or to effect introductions. He also said that they were wasting money on too many consultants. The conclusion was that he called for the entire board to be replaced and added that that explained his voting on the resolutions (so the RNS recording the poll results later today should also make interesting reading).
I was not expecting any of this, although I suspect that the Board knew what was coming. The Board confirmed to me that they would be responding in due course (as they are required to) and I hope that Mr Karpus’ statement is also published, as I may not caught all of it. The BNY Mellon representative did not make any follow up points at the meeting. My guess is that we will see further board changes following this statement.
Andrew
Thanks Andrew. Kicking myself for not going now, although at last year’s AGM everything seemed quite cordial between Mr Karpus and the rest of the board. Although Mr Karpus did say my blog was ‘spot on’ about a couple of points. I have been somewhat critical about the ‘sleepy’ nature of the group, and I am pleased Mr Karpus has become somewhat active with his voting. AGM results are here. I would like to think Mr Karpus is more likely to achieve changes (albeit with a limited 25% vote) as the board contains only ‘hired hands’. CLIG now joins SYS1 and MTVW as the third share I own with unhappy investors!
Please do post any more information about the AGM if you can.
Maynard
Thanks Maynard.
I could have done with your presence this morning, as asking all the questions and trying to take comprehensive notes when responses are coming thick and fast from various people is hard work!
I am happy to post, but it will probably be more lengthy than usual for your blog. However, I guess you can decide whether it needs editing or is appropriate when you review for approval. I would much rather post it here rather than on the likes of ADVFN/LSE, although I think that the views of some of the ADVFN posters are well worth a read.
One thing that I am scratching my head about is why Mr Karpus decided to make his grievances public rather than resolving matters in private. I can only assume that his efforts to do so have been unsuccessful and that he decided that he needed to engage a wider audience. Arguably, it puts the company in play.
Andrew
CLIG AGM – Q&A
The entire Board attended the AGM, plus the CFO (not a board member, but on the Group Executive Committee) and a number of senior management people, including the entire GEC (Carlos Juste, Dan Lippincott, Deepranjan Agrawal, Mark Dwyer and Tom Griffith). My questions were handled in the main by a combination of Barry Ayling, Tom Griffith, Ryan Dartnell, Carlos Juste and Mark Dwyer, with others chipping in. I think that the Company should be commended for providing that level of engagement with shareholders.
Q1. One year ago, you were cautiously optimistic that you could increase FUM in the short term. Obviously, that has not happened, perhaps understandably, given the state of the markets. How optimistic are you that you can reverse the outflow of funds during the next 12 months, or is it more a case of trying to hang on to the current clients and funds that you have?
A1. Certainly the latter is a key focus. Not a great marketing environment, particularly when clients can get around 6.5% pa on cash deposits. Distinction drawn between the behaviour of HNWIs (I think mainly on the Karpus legacy side of the business) and institutional investors. The latter have been more willing to stay invested in funds. The company believes that markets could rebound very quickly if some of the current headwinds subside and that it is very well placed for that time (not holding my breath!). Apparently some bright spots. The performance of the REITs portfolio was highlighted.
Barry Ayling added that he thought that the company had performed well in comparison to its peer group and noted that FUM had slightly increased in the FY 2022/23. I said that I was looking at the present position – or at least the Q1 trading update of 13 October, which showed FUM down by around USD 0.5 billion.
Q2. Given the difficulties in growing FUM and the fact that other fund managers are finding the going tough, is the company actively considering M&A opportunities, rather than relying on organic growth?
A2. Never say never, but not a current focus. A material acquisition would be difficult at the moment in any event, given the weak share price (I.e. would not use paper) and the relatively low cash/cash equivalents available (I think around USD 28.5 million or circa 5% of net assets, but I forgot to ask what the fully up to date position is).
Q3. Fee margins have clearly been under pressure. How well is the company doing in the current markets?
A3. The company is doing well, but is obviously under ongoing pressure, particularly from institutional clients and their consultants (those consultants often being paid on an an incentivised basis linked to success in reducing fees charged by CLIG). Pricing with HNWIs more stable. The days when fees were materially higher (pre-financial crash) will not return. In essence, the company agreed that it had to grow FUM in order to generate any extra revenue.
Q4. Many (probably most) shareholders invest for the yield and that is even more true at the moment given the low share price. You give guidance supporting the current dividend payment (33p in FY 2022/23), but how sustainable is that over the next few years and is at least maintaining that dividend level a priority for the board?
A4. It is a priority and the board believes that this dividend level is sustainable. Refererence made to the track record over many years, despite all manner of challenges.
Q5. The share price has plunged significantly in this calendar year alone – down from 435p in January 2023 to 304p at one point this morning (FWIW I added at 308.7p early in the day). So, although this has not been done in recent years, is the company now actively considering share buybacks?
A5. Yes – now under active consideration (N. B. This has changed post meeting. Now off the table, given that resolution 15 was blocked).
Q6. I had not expected the opening statement on behalf of Mr Karpus. Understood that the board will need time to formally respond, but presumably it will give a detailed response? (And I hope that it publishes the text of the statement made by Mr Karpus).
A6. Yes. The board will respond and has a duty to do so under the UK Governance Code. (No timescale volunteered, beyond the 6 month limit in the Code. The response I was given is detailed in the RNS issued by the company, setting out the poll results (N. B. If Mr Karpus still holds 31.5% of the company’s shares, then he only voted part of his holding against the resolutions. I guess this may be because some of the shares may be beneficially owned by family or others).
The above is correct to the best of my recollection, but 100% accuracy obviously not guaranteed!
Andrew
Hi Andrew
Brilliant work and very much appreciated. Not easy asking questions, writing down the answers and then responding thoughtfully to the answers! Always frustrating how other investors turn up to these meetings and never say anything.
Pleased the board recognised FUM has to grow to improve revenue, although winning new clients has been very slow going over the years. This I think is one of the grievances of Mr Karpus; the business-development side of CLIM has been poor, despite the funds (at least according to CLIG) beating their benchmarks over time.
A bit sad the board said now was ‘not a great marketing environment’. Message to clients should be along the lines of ‘asset class is cheaper than it has been for years and here’s why it is likely to beat cash at 6.5%’. This perhaps underlines the poor business-development side of CLIM.
Pleased the dividend is a priority for the board. Shareholders will not be happy if the payout is cut. I do wonder if the switch to USD reporting opens a backdoor for a dividend reduction in GBP albeit with CLIG still meeting the rolling 5-year 1.2x dividend cover policy.
On the voting, the AGM RNS says:
“Following the completion of the merger with Karpus Management, Inc. on 1 October 2020, the Company has a “Controlling Shareholder Group”, which has agreed to limit their voting rights to the lower of: (i) the number of shares held by them; and (ii) 24.99 per cent. of the votes cast on any resolution by all shareholders. The Controlling Shareholder Group cast votes in excess of 24.99 per cent. of the votes cast on the resolutions by all shareholders and, accordingly, the number of votes stated above as being cast “in favour”, “against” and those “withheld” have been reduced accordingly.”
I read this as reducing Mr Karpus’ voting to 24.99% for each resolution. I note the CEO had 15m votes withheld on his re-election, which seems like a warning sign to him from Mr Karpus and other shareholders.
Hopefully more info will follow from CLIG and perhaps Mr Karpus. But I am encouraged Mr Karpus is not happy with the board and/or performance of CLIG, with Mr Karpus in the same boat as us small-time outside shareholders.
The protest votes at the 2022 SYS1 AGM eventually led to a general meeting to vote on various board changes, and I dare say the GM option is open to Mr Karpus.
Maynard
Many thanks to Andrew and Maynard for your AGM feedback and viewpoints. Very helpul indeed.
I will be watching with interest how things pan out. I see it as a positive that George Karpus has lobbed in a timely grenade to trigger Management into (some) action. I hope they respond in a positive manner.
My general impression has been that marketing efforts in recent times have been lethargic and the Board have been simply sitting back waiting for the next bull market to bail them out.
Maynard’s point regarding how they should be messaging clients is well made. It’s not exactly rocket science is it.
The business needed a shake up and I very much welcome the intervention of George Karpus.
Peter Broughton
Thanks, Maynard.
Yes; I agree with all your comments on the voting. Tom Griffith has been around for a long time and would have worked very closely with Barry Olliff and then the Karpus team, so I was surprised by the size of the of the vote against re-electing him (albeit smaller than the votes against reappointing the non-execs).
Clearly, the restructuring (slimming down) of the board a year or so ago and the creation of the GEC to undertake management post the Karpus merger has not been a resounding success, in practice. Pure speculation, but I wonder if George Karpus wants to see. the likes of Mark Dwyer back on the main board?
I also suspect (and hope) that Barry Olliff is involved in the discussions. His shareholding may be much reduced, but he obviously knows the company inside out and back to front. I should have mentioned that the statement from George Karpus specifically referred to his discussions and shared ambitions with Barry Olliff.
Whatever happens, I hope that they get on with it. The current uncertainty is far from ideal.
Andrew
Hi Andrew,
I have managed to contact George Karpus, obtain a copy of his AGM statement (reproduced below) and garner some further comment that I intend to feature in an upcoming blog post. I think it’s fair to say he is fed up with the board!
Maynard
—————————————-
AGM statement by George Karpus:
CLIG Board Meeting
October 23, 2023
About four years ago Barry Olliff, founder of the City of London and I, George Karpus, founder of Karpus Investment Management became serious about the merger of our two companies, hoping the merger would then make us the biggest and the best worldwide with respect to using closed-end funds in achieving excellent absolute and relative performance for a select group of institutional as well as individual investors.
In June 2020 we announced the merger that closed October 1, 2020. Our shared belief that strong absolute and relative performance for a select group of individual and corporate clients could be enhanced by combining our two firms that would create greater depth and backup that would continue this unique investment style beyond our years. Furthermore, shareholders would be rewarded through synergies and cost savings associated with doubling the companies in cash flow (accounting, compliance, listing costs, systems, and auditing).
I am more confident today that I was three years ago that Tom Griffith and Carlos Yuste can lead this company in achieving excellent performance for clients, a wonderful place to work for employees and growth with dividends for shareholders.
Blame the Covid lock down for the lack of in person meetings that allowed the double weighting in Russian securities prior the invasion of Ukraine that caused the underperformance that wiped out seven years of outperformance in the largest investment mandates within CLIM. Also, the rise in interest rates in the last three years has caused the worst bond market in history and widening closed-end bond fund discounts have caused poor short term relative performance at KIM.
Discount widening occurs when an asset class goes from in favour to out of favour and is normal but a painful part of the investment process and has been present for a good part of the last couple of years causing outflows, lower revenues, profits, and CLIG shareholder pain. For most of 2021 the stock was trading over five hundred pence and is now down to 334 pence painfully reflecting the lower revenue during this part of the investment cycle.
However, I believe CLIG is well positioned to perform well in the future and have most of the staff in place to make that happen. I can see the firm doubling in five years and tripling in ten years.
The generous dividend is protected in the near future by substantial after-tax cash reserves that now should be earning 6% annually or about 2.1 million during this fiscal year.
I am optimistic for the future of CLIG given the right advice and direction.
Having been on the Board of Directors for nearly three years, I have found that most of the board members do not understand the business and do not appreciate the excellent money management that has taken place over the years at CLIG. Attesting to this is the fact that not even one director has opened a personal account at CLIM or KIM. Not only have they not done business on a personal basis with CLIM or KIM, but they have also not referred any business in the last three years. Their stock ownership is small, and they have not provided good direction for the integration of CLIM & KIM. They have been slow to embrace changes to our reserves (cash management) that would improve returns and reduce risk. They have directed the management team into pursing non synergistic fits for the company. They discriminate in their selection of future board members and spend a lot of money on consultants instead of putting together a team of board members that can properly guide CLIG into doubling over the next several years.
I believe the future board should consist of individuals with different skill sets that believe in the great future of CLIG. The board members should trust the investment experience with their own monies as well as their friends’ monies. They should have a combination of experience and skills, so they do not have to rely on outside consultants and advisors. They should also be willing to align their interests with shareholders by agreeing to take the minimum of 50% of their board compensation in CLIG stock that cannot be sold for two years. This is why I voted against the current board.
I believe this board should be replaced with a seasoned group of directors that understand the enormous potential of CLIG and that can guide the management in profitability growing the company.
—————————————-
Maynard,
Thanks for this. How long do we have to wait until the Board issues a formal response? They must have known well in advance what was coming and so I had hoped for a formal response by now (over three weeks and counting). Your posting today is to my knowledge the first time that this statement is in the public domain, other than my earlier summary on this blog.
Mr Karpus has a very significant shareholding and so the reality is that there will have to be change. I continue to add to my holding at depressed prices and I still rate the company, but the sooner that this unrest is resolved, the better for all concerned.
Andrew
Hi Andrew
With timescales, the AGM results RNS gave the standard ‘within six months’:
“The Board notes that a recent advisory report published by ISS, relating to the Company’s proposed resolutions at the AGM, recommended voting in favour of all resolutions without exception. Notwithstanding this report, the Board notes with disappointment the opposition to a number of the resolutions tabled at the AGM primarily from a single shareholder and commits to further consultation, therefore, with a view to providing an update within six months, as required by the UK Corporate Governance Code.”
So we should hear something by late April! My only experience of such protest votes and formal responses is through MTVW, which takes the mandatory six months to publish an update that does not provide any further information (example below):
“Following the meeting, the Company identified, as far as possible, those shareholders who did not support the resolutions and attempted to engage with them to seek their views. Some shareholders did not wish to engage, other shareholders raised matters which are under consideration by the Board. The Board is grateful to those shareholders who took part in the engagement process and value the feedback provided. The Company re-affirms its commitment to ongoing shareholder engagement and will continue to offer to have discussions with shareholders and will take into account their concerns and considerations in the future.”
These things tend to be discussed behind the scenes and one day we may just receive a ‘board update’ RNS. I also believe the executives have to take some responsibility here; ultimately they are employed to bring in FuM and it’s that lack of client growth that has left CLIG’s performance somewhat stagnant over time. Agreed, in reality there will have to be change — which may be accelerated if FuM continues to fall and margins continue to be squeezed to leave the dividend uncovered. Anyway, fingers crossed some positive action occurs soon.
Maynard