21 October 2022
By Maynard Paton
Results summary for City of London Investment (CLIG):
- Rough market conditions causing funds under management (FuM) to fall 17% to $9.2b led to H2 net fee income dropping 5% and H2 profit diving 20%.
- A post-year update showed FuM sliding a further 8% to $8.5b, but also the fourth consecutive quarter of net FuM inflows that may signal clients re-appraising CLIG’s ‘value’ approach.
- Buying SPACs at discounts to cash helped merger partner KIM outperform the original CLIM division with 6% five-year annualised returns versus 3-4%.
- Revenue “100%” denominated in the stronger USD, handy cash conversion plus net funds and investments of £30m counterbalanced an H2 margin squeezed to ‘only’ 42%.
- Near-term earnings could now be running at 36p per share, which should still support the 33p per share dividend and 8%-plus yield at 400p. I continue to hold.
Contents
- News links, share data and disclosure
- Why I own CLIG
- Results summary
- Net fee income, profit and dividend
- Funds under management: inflows and outflows
- Funds under management: capacity limitations
- Funds under management: investment performance
- Funds under management: fee rates
- Management
- Exchange-rate/post-tax profit matrix
- Financials
- Valuation
News links, share data and disclosure
News: Annual report and presentation for the twelve months to 30 June 2022 published 20 September 2022 and Q1 2023 trading update published 17 October 2022.
Share price: 400p
Share count: 50,679,095
Market capitalisation: £203m
Disclosure: Maynard owns shares in City of London Investment. This blog post contains SharePad affiliate links.
Why I own CLIG

- Fund manager that employs a lower-risk strategy of buying investment trusts at wide discounts through a “team approach to investing” (point 6b) .
- Accounts showcase wonderful 40%-plus margins, hefty net cash and ability to distribute majority of earnings via dividends.
- P/E of 11 and yield of 8% offer meaningful upside potential should a wider market recovery ever bolster funds under management.
Further reading: My CLIG Buy report | All my CLIG posts | CLIG website
Results summary
Net fee income, profit and dividend
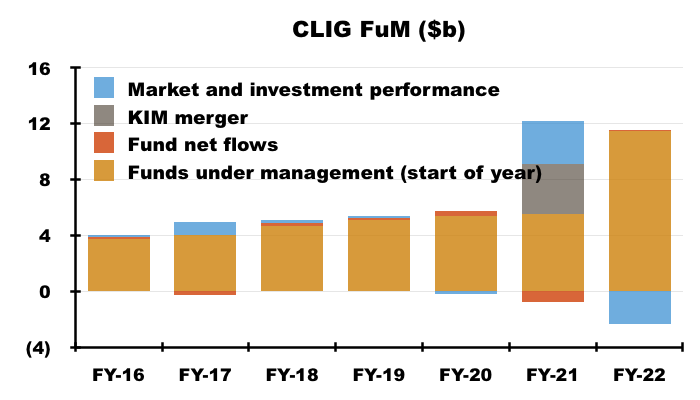
- These FY 2022 results were never going to be fantastic after a Q3 update during April and a Q4 update during July indicated lower funds under management (FuM).
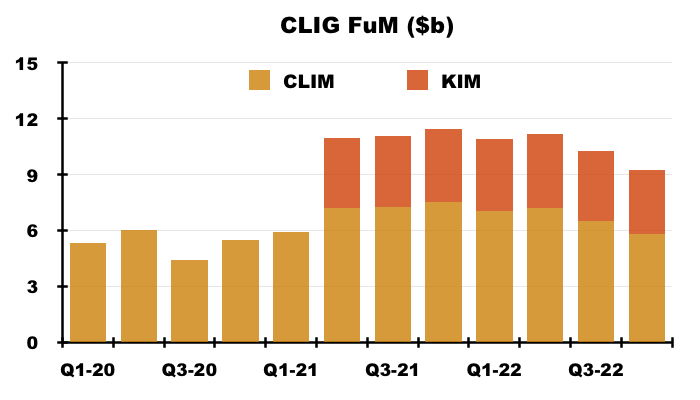
- FuM dropped 8% during Q3 and a further 10% during Q4 to leave FuM down 17% since the end of H1 and down 19% since the end of FY 2021:
- CLIG claimed the FuM performance was due “in large part to matters beyond [its] control” and was “mirrored across the asset management industry as a whole“.
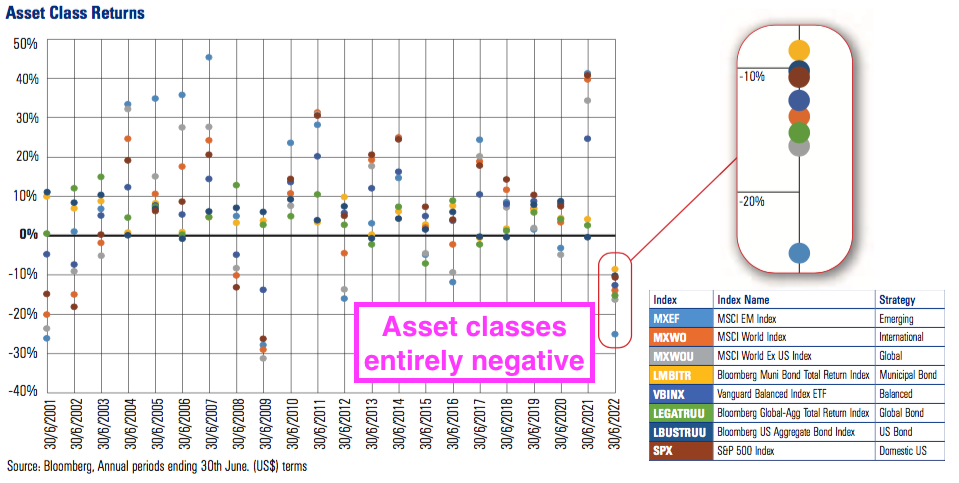
- CLIG noted a variety of asset classes delivered negative returns:
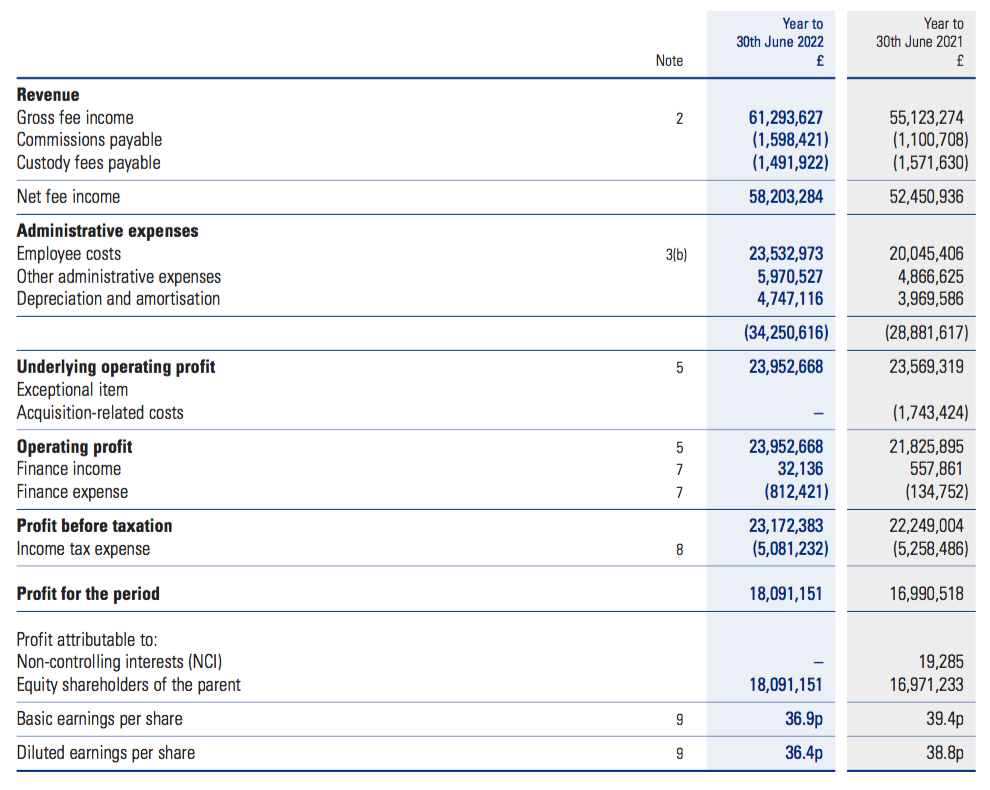
- July’s Q4 update said this FY 2022 statement would show underlying profit before tax at approximately £27.2m and earnings at approximately £18.1m.
- Underlying profit before tax was £27.2m as projected and earnings were £18.1m as projected.
- Bolstering progress was a full twelve-month contribution from Karpus Investment Management (KIM).
- The £102m merger with KIM mid-way through H1 2021 led to the comparable FY 2021 enjoying only a nine-month KIM contribution.
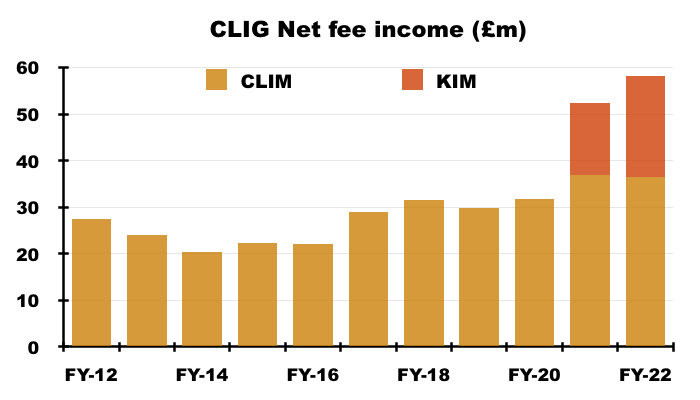
- Total net fee income increased 11% to a record £58.2m:
- CLIG did not publish KIM’s net fee income for FY 2022 despite previously revealing the contribution for FY 2021 (nine months: £15.5m) and H1 2022 (£10.9m).
- Following my request to disclose KIM’s net fee income for FY 2022, CLIG replied: “KIM’s net fee income can be estimated based on the proportion of KIM’s year-end FuM as a % of the Group’s year-end FuM (c. 37%)“
- 37% of £58.2m equals £21.7m.
- Companies House supports that £21.7m net fee calculation for KIM.
- Companies House shows CLIG’s City of London Investment Management (CLIM) division reporting revenue of £38.0m and custody fees of £1.5m, which led to net fee income of £36.5m for FY 2022:
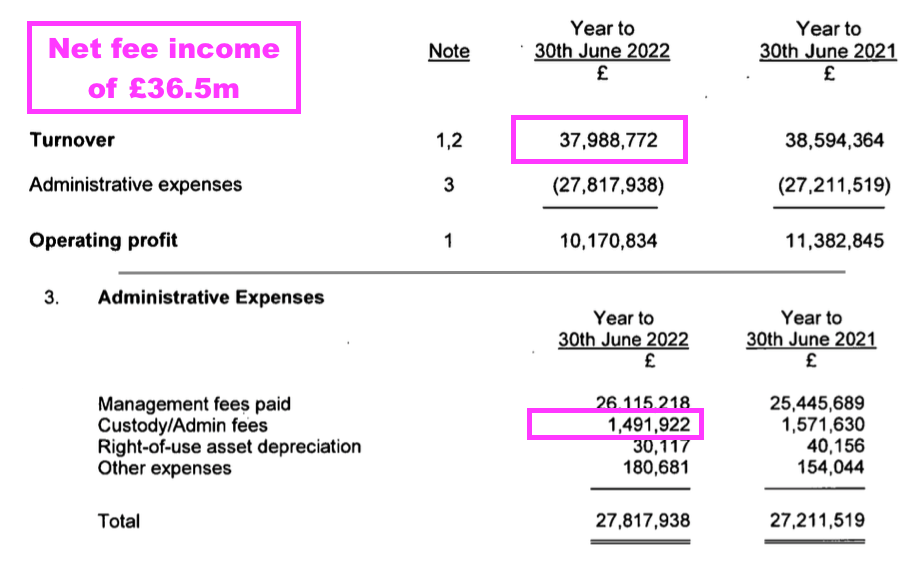
- The Companies House information indicates net fee income for CLIM dropped 1%, and implies net fee income for KIM (pro-rata twelve months) gained 5% to £21.7m.
- Charges associated with the KIM merger influenced profit comparisons, and consisted of:
- Exceptional merger expenses of £1.7m incurred during FY 2021, and;
- Amortisation of acquired intangibles, which came to £4.1m during FY 2022 and £3.3m for the comparable FY 2021.
- Adjusting for the KIM merger costs and amortisation, FY 2022 operating profit climbed 4% to £28.0m:
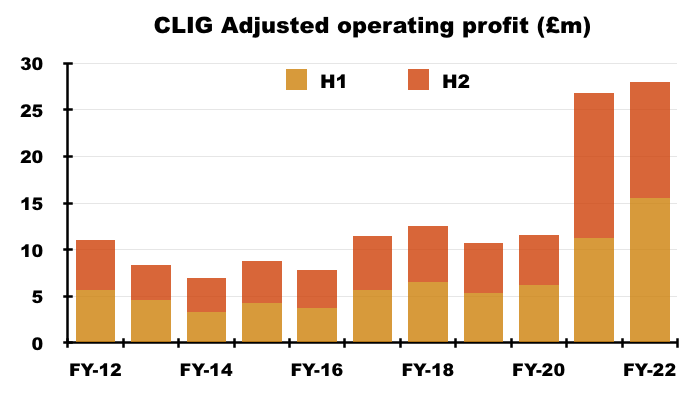
- H2 adjusted operating profit of £12.4m was 20% lower than the £15.6m struck during both the preceding H1 2022 and comparable H2 2021.
- The H2 profit shortfall was a result of:
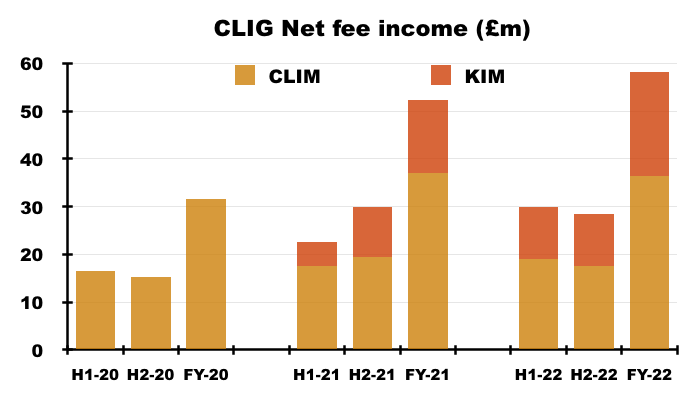
- Lower H2 net fee income (£28.4m) versus both the preceding H1 2022 (£29.8m) and comparable H2 2021 (£29.9m), and;
- Higher H2 costs (£15.9m) versus the both the preceding H1 2022 (£14.3m) and comparable H2 2021 (£14.3m) (see Financials).
- My calculations suggest KIM’s H2 net fee income (down 1% on H1 2022 to £10.8m) held up better than CLIM’s H2 net fee income (down 7% on H1 2022 to £17.6m):
- CLIG remains a beneficiary of a stronger USD versus GBP. The group’s clients are almost all located within the US and “100% of revenue” was apparently earned in USD last year.
- A potentially significant FuM development occurred during H2 2022 — CLIG extended its run of consecutive quarters of net client-money inflows to three following five consecutive quarters of outflows (see Funds under management: inflows and outflows).
- The Q1 2023 statement then repeated the trick with a further quarterly inflow of client money (see Valuation).
- Wishful thinking perhaps, but maybe clients continue to re-appraise CLIG’s ‘value’ style of investing following the choppier market conditions of the last year or so.
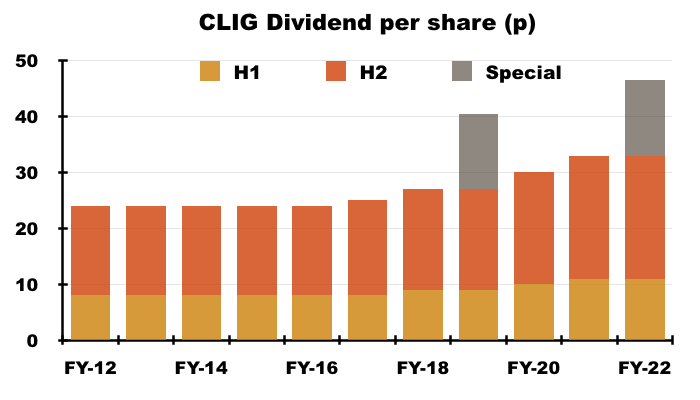
- The preceding H1 2022 statement had suggested the final dividend could be lifted:
“The option of increasing the final dividend at year end, dependent upon market conditions, remains open.”
- But the “dependent upon market conditions” proviso was activated and the final payout was held at 22p per share:
Funds under management: inflows and outflows
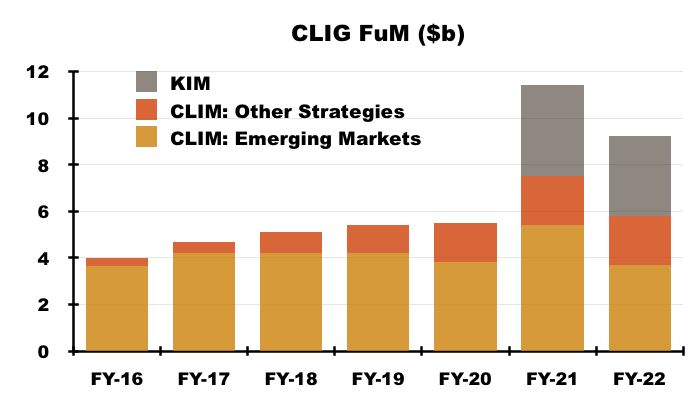
- CLIM’s FuM can be divided into two main categories:
- Emerging Markets (EM), and;
- Other Strategies, which cover:
- Developed (or “International“) markets outside the United States;
- “Opportunistic Value“;
- “Frontier” markets, and;
- Seeded funds (REITs and “Global“).
- Both categories apply CLIG’s long-standing value approach of buying investment trusts at wide discounts and occasionally taking an activist stance.
- KIM meanwhile manages a mix of US equities (including investment trusts) and bonds.
- For years CLIG has struggled to attract significant sums of new client money.
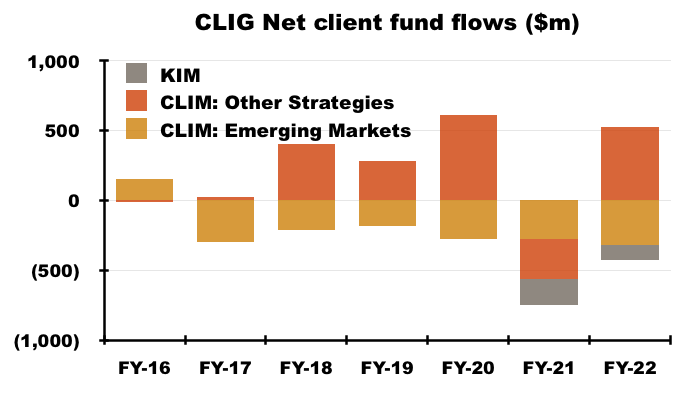
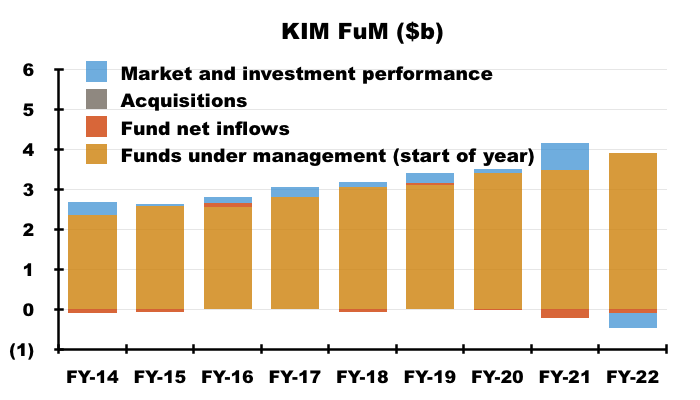
- The (very thin) red bars on the chart below put the client money inflows and outflows into perspective:
- The preceding FY 2021 in fact witnessed client net withdrawals of $752m, which almost entirely offset the aggregate net client inflows of $758m enjoyed between FYs 2015 and 2020:
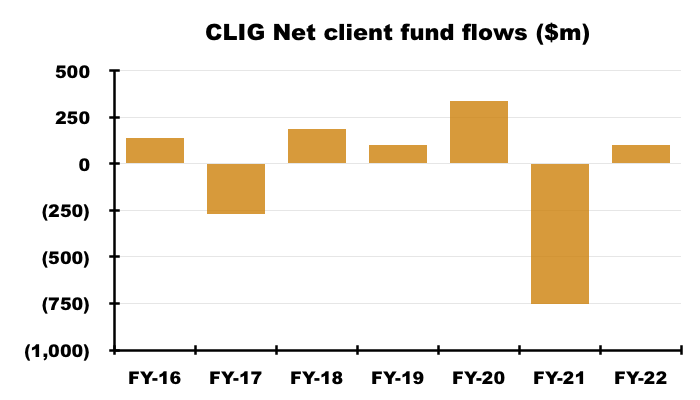
- The outflows continued during Q1 2022, but became inflows during Qs 2, 3 and 4:
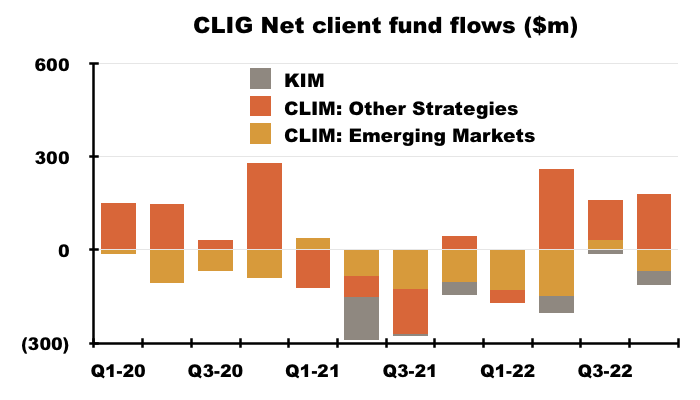
- CLIG said the International strategy had once again been the lead attraction for new money after re-opening to new clients:
“At CLIM, the International (INTL) strategy has been the main driver of inflows during this financial year after re-opening to new clients earlier in 2022. The INTL strategy has now seen net inflows for five of the last six financial years.”
- Let’s hope the International strategy does not have to close again.
- Year-end International FuM topped $1.8b versus less than $0.5b for FY 2018, and represented the vast majority of CLIM’s Other Strategies FuM:
- CLIM’s “flagship” EM division has consistently suffered net outflows since FY 2017:
- CLIG explained:
“The geopolitical concerns that have arisen in EM countries, including Russia/Ukraine, North Korea/South Korea, and China/Taiwan, have given some investors pause, despite attractive valuations and wide discounts. The underperformance of EM vs Developed equities over the past ten years, shown in the chart on the following page, has also had a negative effect on investor sentiment towards the asset class.”
- CLIG blamed client nerves for KIM suffering a $110m outflow during FY 2022:
“KIM had net outflows for the financial year, as their primarily High Net Worth client base reduced exposure to markets given the higher volatility, especially in the second half of the financial year.“
- KIM has witnessed net client withdrawals of more than $300m since the merger and has not yet enjoyed a quarter showing a net inflow.
- Year-end KIM FuM at $3.4b was less than the $3.6b enjoyed at the time of the (October 2020) merger.
- CLIG encouragingly anticipated further inflows for the wider group:
“With a resumption of more active marketing opportunities in the post- pandemic world, we are hopeful that the healthy pipeline will translate into further inflows in the months ahead.”
- CLIG’s largest client remains content. Its gross fees advanced 6% on FY 2021, with H2 fees of £2.9m matching those from the preceding H1 2022 and H2 2021:
“Included in revenues are fees of £5,825,226 (2021: £5,470,051) which arose from fee income from the Group’s largest client. No other single client contributed 10% or more to the Group’s revenue in either of the reporting periods.”
Funds under management: capacity limitations
- CLIG’s “capacity constrained” EM strategy remains an ongoing drawback. CLIG reiterated:
“As a specialist in Closed End Funds, the universe of EM equity investment options is capacity constrained.”
- Capacity problems occur when a fund becomes too large to outperform because of the restricted size of its target universe of stocks.
- CLIG added:
“The INTL, Global, OV and EM REIT strategies have significant capacity and will remain a focus for marketing.“
- The presentation implied the International and Opportunistic Value approaches could handle extra client money of $2b, which is double the year-end FuM invested in such approaches:
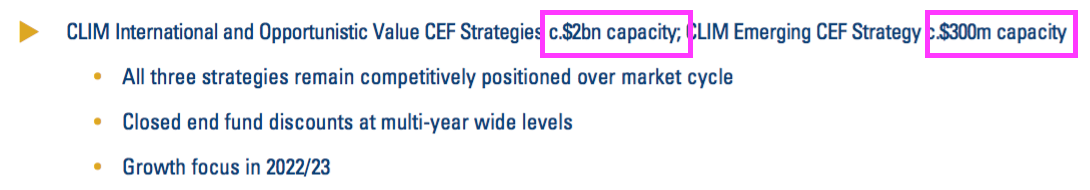
- The presentation also implied the “flagship” EM strategy could handle only an extra $300m, versus the $3.7b managed at the year-end.
- Year-end EM FuM represented 40% of group FuM, down from 43% at the half year, 47% at the FY 2021 year-end and 69% at the FY 2020 year-end.
- Although 40% is the lowest year-end proportion of EM FuM in CLIG’s history, the percentage remains significant and the associated capacity constraints will not help overall FuM growth.
- CLIM’s Opportunistic Value, REIT and Frontier FuM remains small at $276m.
- These FY 2022 results revealed a new Global investing approach:
“Robust new CEF issuance increased the universe by over US$30 billion in the twelve months ending June 2022. An enlarged universe of global CEFs (funds that invest in world markets including the USA) and US equity focused CEFs encouraged CLIG to seed a Global CEF strategy. This product invests in global equity markets including the USA (in contrast to the INTL CEF strategy which excludes the USA) and fills a niche for US institutions that prefer a “one stop shop” solution for their global equity exposure”
- The new Global strategy was seeded with £1.9m and ought to have more scope than CLIM’s previous seeded effort, which invested £3.9m into REITS during early 2019, is worth £3.8m today and no longer has any external investors for the International version.
- CLIG has also seeded a Special Purpose Acquisition Company (SPAC) strategy with £1.9m, with the intention of buying unloved SPACs in the States below cash value.
- KIM has been buying SPACs for its clients:
“Our conservative approach is based on utilising SPACs as a short-term fixed income alternative… By purchasing shares below the cash value of the trust account, we view our approach as buying cash at a discount. Moreover, if the SPAC management company finds what the market perceives to be an attractive acquisition, shares of the SPAC could trade above cash value.”
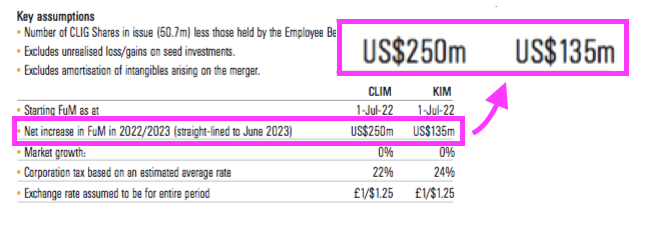
- CLIG still believes new client money of $385m can be obtained by June 2023:
- For perspective, the aforementioned run of inflows during quarters 2, 3 and 4 of FY 2022 brought in net client money of $274m.
- An extra $385m is equivalent to only 4.1% of year-end FuM of $9.2b.
- Continuing to expect new KIM money of $135m a year seems very ambitious, given the division has yet to attract net inflows since the merger two years ago.
- But expecting new client money of $250m for CLIM is not completely outrageous; CLIM attracted $338m during FY 2020.
- CLIG gave this short message about future marketing:
“Marketing efforts will continue to be targeted at investment consultants, foundations, endowments and pension funds. We will also continue to introduce our capabilities to family offices, outsourced CIO firms, and alternative consultants.“
- And CLIG now seems prepared to buy somebody else’s FuM:
“We will also continue to be selective in identifying potential acquisitions, which we believe will inevitably appear given the difficult market conditions of the past year.“
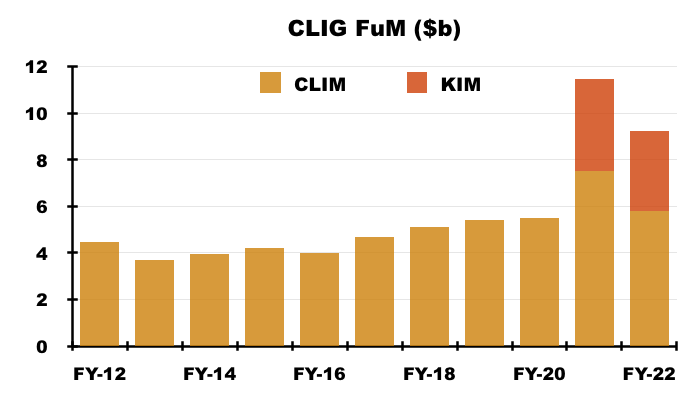
- Total year-end FuM at CLIM and KIM has grown from $6.2b to $9.2b since 2010 — equivalent to an average annual growth rate of 3.3%:
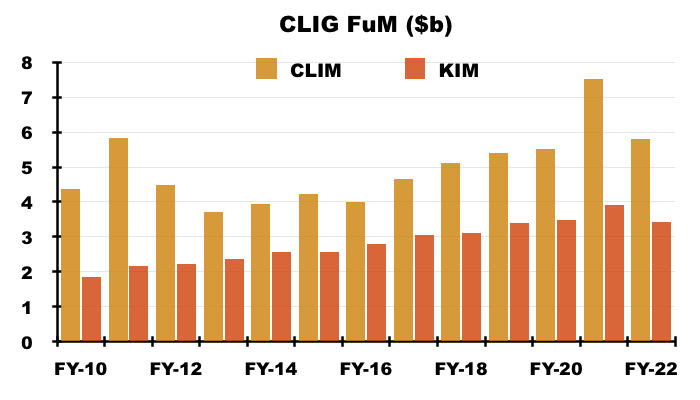
- The average annual growth rate for combined CLIM and KIM FuM over five years is 3.6%.
Funds under management: investment performance
- CLIG said during the preceding H1 statement that relative returns had been “strong“:
“Relative investment performance at both CLIM and KIM was strong during the six months ending 31st December 2021 and for calendar year 2021.”
- The tone changed within these FY 2022 results after H2 witnessed “significant geopolitically driven asset dislocations“.
- CLIG admitted its EM and International strategies had underperformed during the year due to:
- Exposure to funds owning small, high-growth equities;
- Russian shares being marked to zero, and;
- Widening fund discounts, apparently created by “retail investors” turning “cautious“.
- CLIG claimed it was not the only fund manager to have suffered of late:
“Active equity managers generally struggled to outperform over the period.”
- CLIG also claimed more than 95% of CLIM’s FuM remained ahead of their associated benchmarks over the last five years:
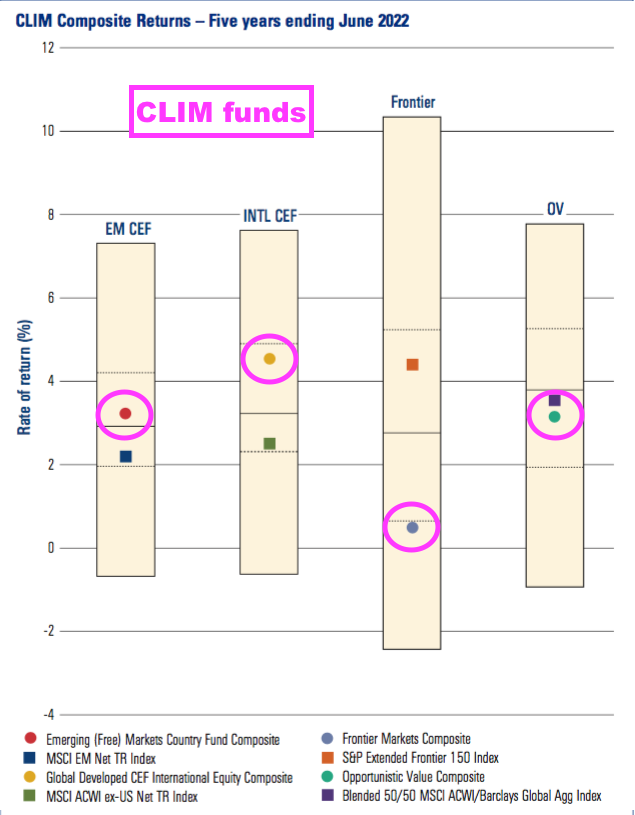
- The chart above suggests EM and International returns have averaged approximately 3%-4% a year (before fees).
- CLIG introduced a new chart for FY 2022 that finally admitted what long-term clients (and shareholders) have probably known for some time…
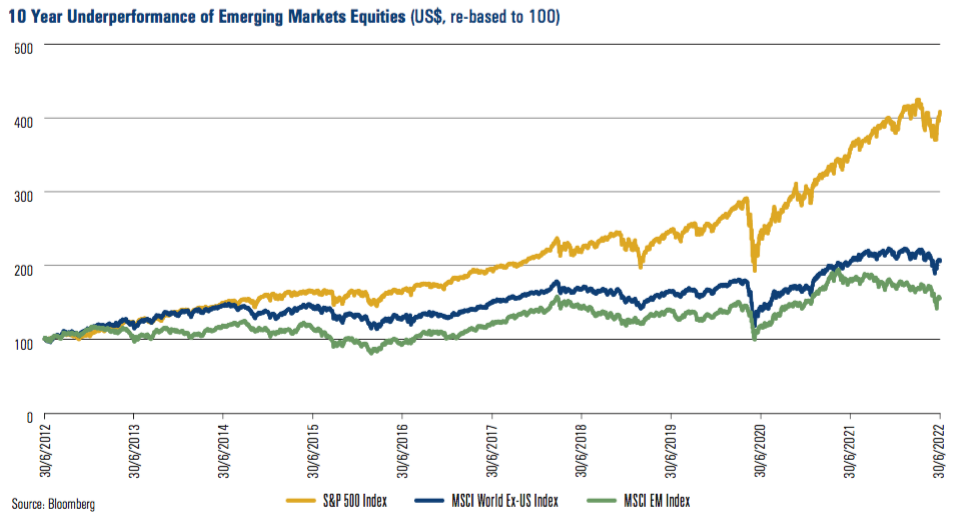
- …namely the S&P 500 has trounced emerging markets (and CLIM’s EM funds) over the last ten years.
- My calculations indicate the S&P 500 (in USD) has outperformed CLIM’s EM and International strategies during FYs 2016, 2018, 2019, 2020 and 2022…
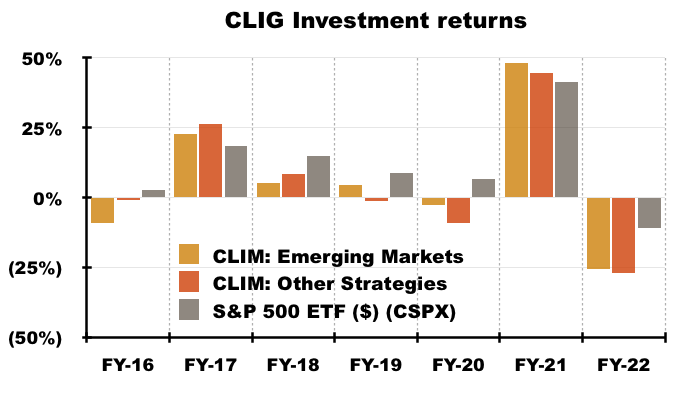
- …and was not exactly a distant third during FYs 2017 and 2021.
- The iShares S&P 500 ETF (CSPX) has gained 104% during the last seven years (in USD), versus my estimated 32% for CLIM’s EM approach and my estimated 29% for CLIM’s Other Strategies.
- Prospective clients have no doubt compared CLIM’s funds to the S&P 500 rather than CLIM’s chosen benchmarks, which may explain the minimal new client money won during recent years.
- CLIG admitted:
“The underperformance of EM vs Developed equities over the past ten years… has also had a negative effect on investor sentiment towards the asset class“.
- CLIG talked about meeting client expectations:
“Our focus on exploiting discount volatility has served clients well for over thirty years in both bull and bear markets. Wide discounts and persistent discount volatility give us confidence that our [Closed End Fund] strategies will continue to meet our clients’ longer term performance expectations.”
- But CLIG did not make clear whether clients expect to underperform the S&P 500.
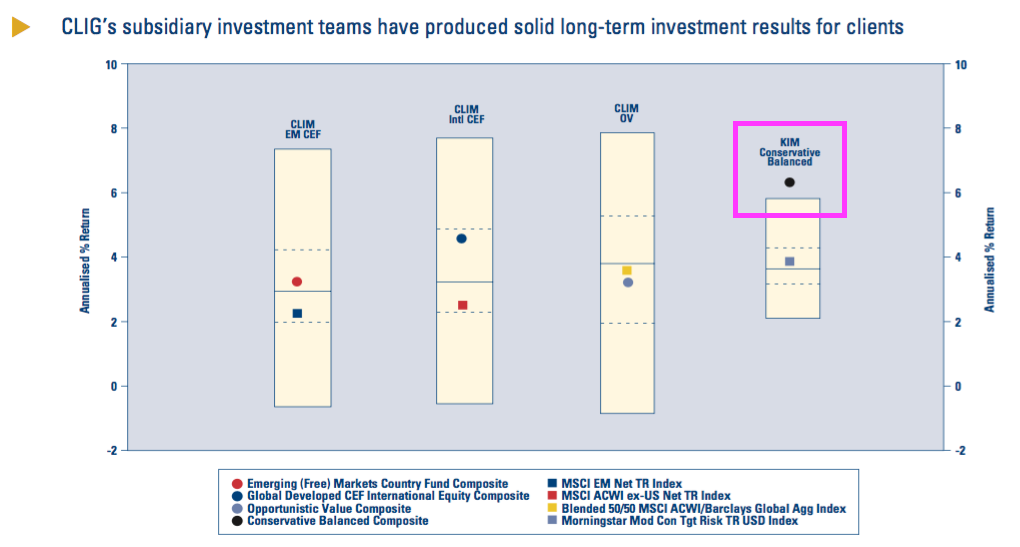
- CLIG described KIM’s relative performance as “outstanding” following some “tactical” selling and SPAC buying:
“Relative performance at KIM has again been outstanding… driven in large part by our tactical reduction of closed-end funds (CEFs) and our significant allocation to special purpose acquisition companies (pre-acquisition) (SPACs) trading at discounts to trust value.”
- CLIG said SPACS were “one of the few asset classes that produced positive returns over the twelve months.”
- KIM’s ‘Conservative Balanced’ approach has delivered 6% per annum average returns during the last five years:
- CLIG’s returns have not improved following the FY 2022 year-end.
- During CLIG’s Q1 2023 (July to September 2022), CLIM’s strategies returned an estimated negative 11% while KIM’s portfolios matched the S&P 500 and lost 3% (see Valuation).
Funds under management: fee rates
- CLIG said group fee rates had dropped a basis point to 73 basis points:
“Despite the ongoing competitive pressure on fees in the institutional market-place, the Group’s average revenue margin declined slightly to 73bp (2021: 74bp).
- The “ongoing competitive pressure on fees” has reduced CLIM’s management charge over time:
| Year to 30 June | 2016 | 2017 | 2018 | 2019 | 2020 |
| CLIM net fee rate (bps) | 86 | 84 | 80 | 76 | 75 |
- Following FY 2020, CLIM fees rates were then reduced to:
- CLIG frustratingly discloses CLIM’s fee rates within only some quarterly statements, and the aforementioned 73bps group fee rate for FY 2022 includes KIM fees.
- As well as “competitive pressures“, the fee-rate decline since FY 2016 may also be due to the growing proportion of Other Strategies FuM that could levy lower charges.
- CLIG has never disclosed the exact fee rates charged on its EM and Other Strategies funds.
- My algebra suggests EM fees are applied at 90 basis points and Other Strategies fees are applied at 30 basis points to arrive somewhere close to the overall fee rates declared for CLIM:
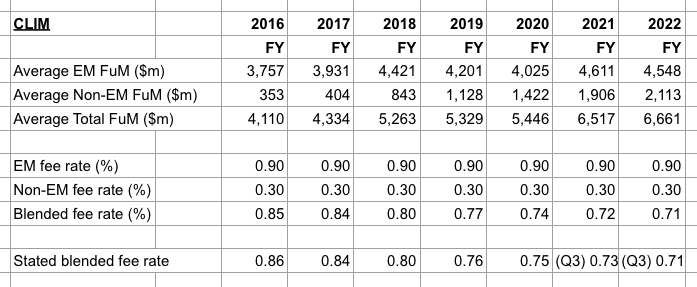
- CLIG disclosing the different fees charged by its strategies would remove any suspicion of clients chipping away at fees throughout all of CLIM’s funds.
- The fee rate at KIM has dropped, too.
- The merger document (point 5) claimed KIM enjoyed a “fairly stable” net fee rate of 80 basis points.
- But the FY 2021 results said KIM fees were 77 basis points, and the Q3 2022 update revealed KIM fees at a net 76 basis points.
- The declining fee trends at CLIM and KIM may well reflect clients mulling the 10 (or less) basis points charged for holding an S&P 500 ETF.
- The Q1 2023 update earlier this week confirmed CLIM’s fees remained at 71 basis points and KIM’s fees remained at 76 basis points.

Management
- The 2022 annual report led with a tribute to CLIG’s founder Barry Olliff:
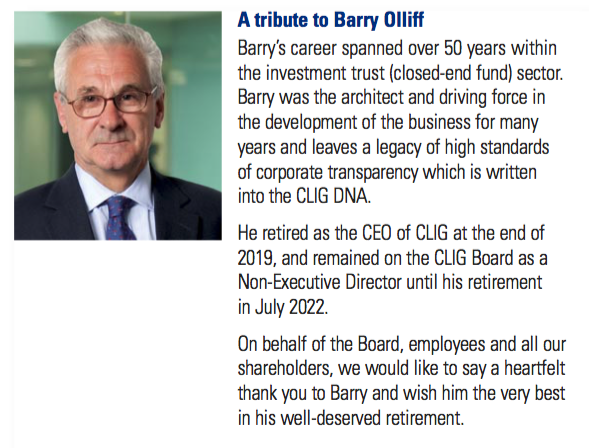
- Mr Olliff retired at the end of July. CLIG said:
“Barry’s laser-like focus on value to both shareholders and clients lies at the core of CLIG’s culture and permeates everything we do for all stakeholders. Barry’s willingness to challenge entrenched orthodoxy in the investment universe is well recognised and represents a hugely positive long-term legacy“.
- I wonder if shareholders ought to challenge CLIG’s “entrenched orthodoxy” towards buying EM trusts at a discount.
- After all, that earlier chart showed the S&P 500 trouncing the EM benchmark, while my sums do not suggest CLIM’s value style of investing has delivered wonderful returns to clients.
- Mr Olliff’s departure and a board re-jig (point 3a) has left the board consisting of:
- The chief exec, and;
- Six non-execs, including KIM founder George Karpus.
- Mr Karpus retired to become a CLIG non-exec just after the KIM merger and retains a significant 36%/£73m CLIG shareholding:

- Whether Mr Karpus is satisfied with CLIG’s all-round progress since the merger is not clear.
- Maybe Mr Karpus is just the person to challenge any “entrenched orthodoxy” at CLIM regarding its EM performance versus the S&P 500.
- The 2022 annual report includes this intriguing small-print:
“George Karpus will continue to serve on the Board for the 2022-2023 financial year and we will provide an update prior to next year’s AGM regarding his future plans.“
- I suppose those “future plans” could include stepping down from the board… although KIM’s founder — and 36% non-exec shareholder — choosing to become an outside, passive investor seems hard to imagine.
- One possibility for Mr Karpus is the role of chairman; the current chairman has confirmed he will not seek re-election at the 2023 AGM.
- I plan to attend the 2022 AGM and I hope Mr Karpus is there to shed some light on his future plans.
- Maybe Mr Karpus would like to shift the board’s attention towards KIM.
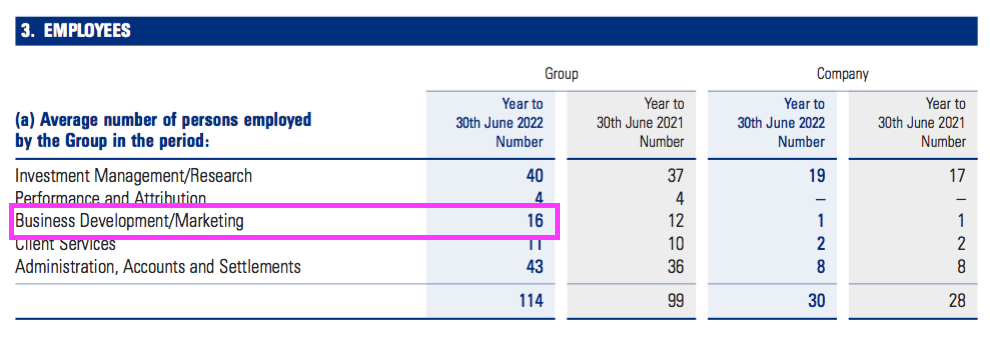
- After all, before the merger KIM FuM per employee was 27% greater and KIM revenue per employee was 31% greater than the respective levels at CLIM (point 9).
- Plus KIM net fee income during the rough H2 was up 4% on H2 2021, versus down 10% at CLIM.
- In addition, the 2022 annual report small-print suggests KIM operates with a terrific 54.5% operating margin:
- Employees working in a business development or marketing capacity have increased from four to 16 since the merger, suggesting KIM is somewhat more proactive in the sales department than CLIM:
- KIM also pays commissions to advisers, which may be further evidence of a keener desire for new clients. CLIM in contrast began to wind down its commission payments during 2009 after taking its marketing in-house.
Exchange-rate/post-tax profit matrix
- CLIG’s exchange-rate/post-tax profit matrix has been revised and continues to confuse:
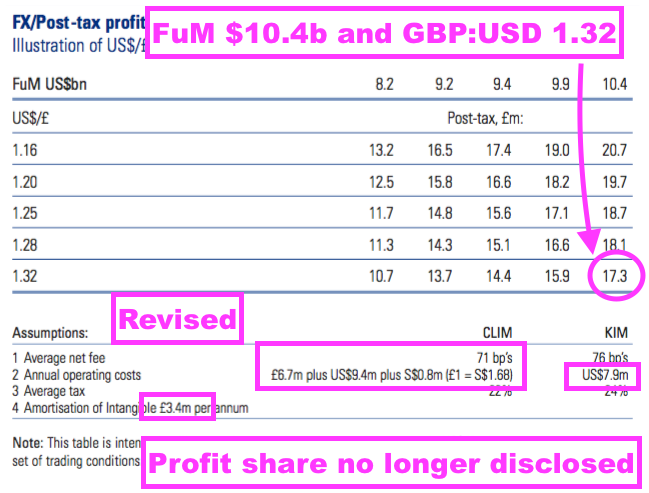
- Revisions to the matrix since H1 2022 include:
- CLIM costs increasing from ‘£6.7m plus $8.5m’ to ‘£6.7m plus $9.4m’;
- CLIM fee rates reducing from 72 basis points to 71 basis points;
- KIM costs reducing from $8.3m to $7.9m, and;
- ‘Amortisation of intangible’ increasing from £3.3m to £3.4m.
- For this H1, the illustrative post-tax profit from the matrix appears to correlate with underlying earnings.
- CLIG said GBP:USD averaged 1.33 and its website shows FuM averaging approximately $10.5b during this FY…

- …which would give earnings of £17.3m if GBP:USD of 1.32 and FuM of $10.4b were applied to that matrix.
- CLIG declared underlying FY 2022 earnings of £21.7m:
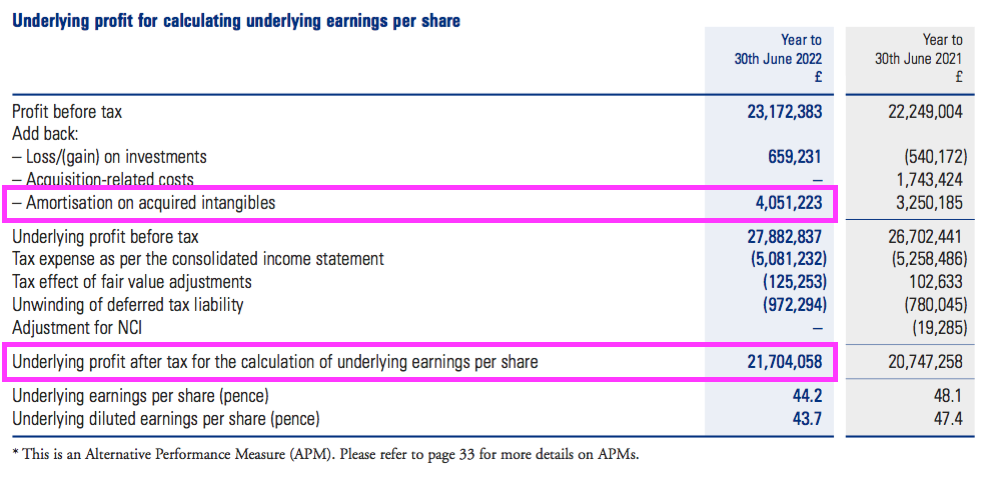
- The £4.4m difference (£21.7m less £17.3m) is (I think) mostly explained by the amortisation of acquired intangibles, which last year was £4.1m and which (I presume) is included in the illustrative matrix’s calculations.
- Why the matrix cites only £3.4m of the £4.1m amortisation charge is not clear.
- Previous matrices have noted the 30% profit share for the CLIM division:
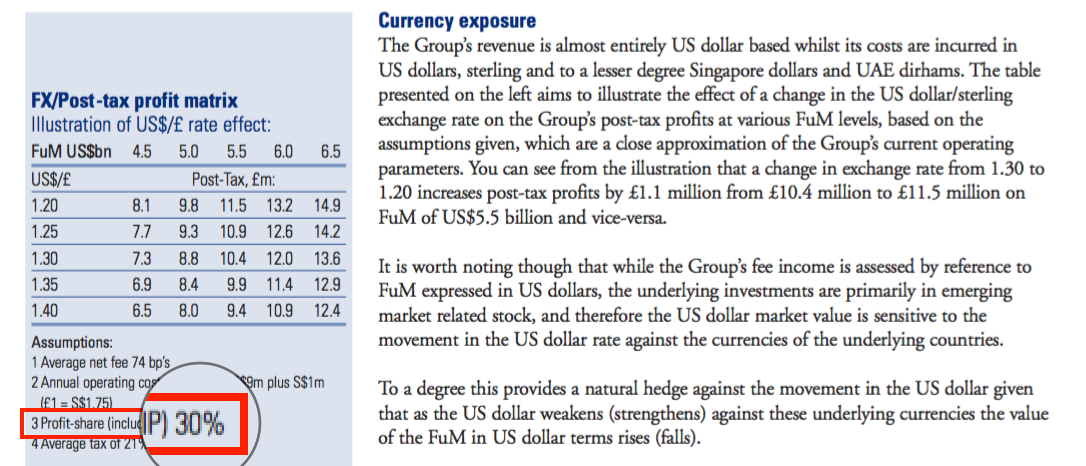
- But following the KIM merger, the profit-share note has been removed and the stated post-tax figures can no longer be derived from the matrix assumptions that remain.
- Mind you, CLIG has always said the matrix is “not intended to be interpreted or used as a profit forecast.”
- CLIG has confirmed to me that KIM employees do now participate in the employee profit-share scheme, although CLIG did not say whether this participation replaces — or is in addition to — the pre-merger pay arrangements of KIM’s employees.
- These FY 2022 results indicated a 24% profit share, which suggested CLIM’s 30% profit share was not replicated entirely at KIM:
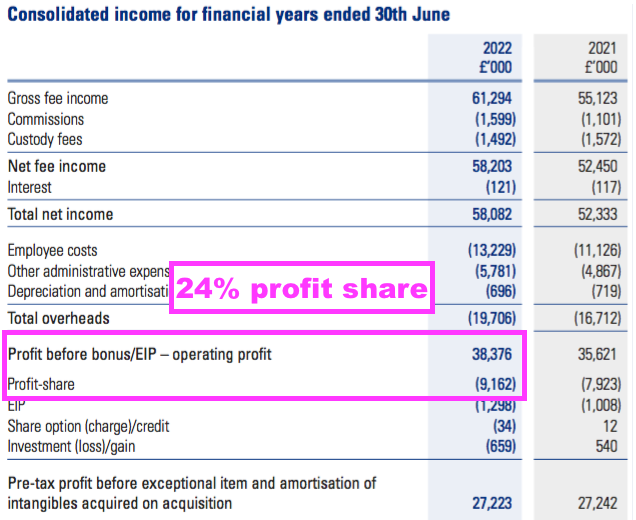
- But CLIG does confirm a 30% profit share may be possible:
“The profit-share pool is fixed at a maximum of up to 30% of operating profit of the Group and aligns employees’ variable income component of total compensation with Group profitability and shareholder value.”
- The profit share is important because earnings will be dampened if operating profit ever funds a full 30% profit share.
- I have never been entirely sure whether a regular profit-share payment has really incentivised CLIM’s staff.
- The scheme allows employees to collect a bonus even if earnings reverse, which perhaps explains why CLIM’s FuM has made only pedestrian advances over time.
- Between FYs 2018 and 2022, CLIG’s wages and salaries totalled £38m, but were enhanced 84% by aggregate profit-sharing payments of £32m.
- Note how operating profit (right axis below) faltered between FY 2012 and FY 2016 as salary and profit share per employee remained steady despite net fee income per employee declining significantly:
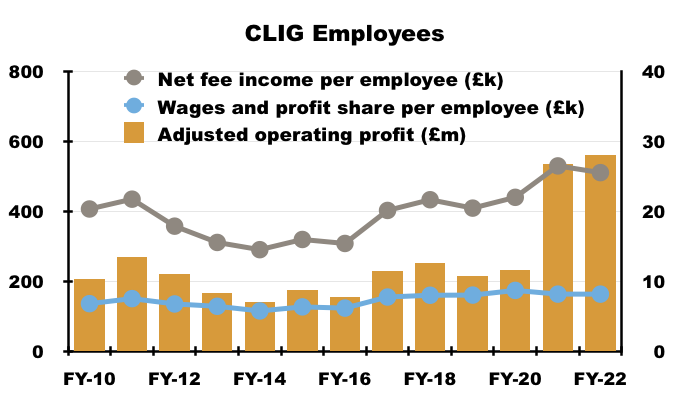
- The danger is near-term profit could falter again if FuM remains in the doldrums, net fee income slides but the average salary and profit share per employee remains at last year’s £163k.
Financials
- CLIG noted a stronger US dollar lifted costs during H2:
“The largest component of overheads continues to be employee-related at £13.2 million (2021: £11.1 million), an increase of 19% over last year. This is mainly on account of the full year of KIM employee costs in FY 2022 (as compared to nine months of costs in FY 2021) and a stronger US dollar during the second half of FY 2022.”
- GBP:USD averaged 1.30 during H2 versus 1.36 versus H1, which would have increased USD costs by 5% in GBP.
- But the stronger USD was not entirely to blame for the higher H2 costs. In particular, total employee expenses advanced 11% (to £12.4m) during H2 versus H1.
- The greater cost base led to CLIG’s adjusted operating margin falling from 49% during H1 to 42% during H2.
- True, a 42% operating margin remains very healthy… but not as healthy as the preceding H1’s 49%, or the 50% reported during H2 2021.
- The stronger USD could squeeze CLIG’s margin further. GBP:USD at the recent 1.10 equates to USD costs jumping 18% in GBP versus the average 1.30 level for H2:
| Year to 30 June | 2018 | 2019 | 2020 | 2021 | 2022 |
| Operating margin* (%) | 36.9 | 32.9 | 34.9 | 48.7 | 45.7 |
| Return on average equity (%) | 50.9 | 43.6 | 40.0 | 24.4 | 14.5 |
- CLIG’s return on equity dropped to 14.5% during FY 2022 after the KIM goodwill and other intangibles were included within the equity denominator for the full twelve months.
- Return on equity was distorted also by a £14m currency-translation gain on the KIM intangibles:
- Return on equity is rather academic for CLIG, as earnings growth is driven inherently by attracting greater FuM — which in turn is not directly correlated to reinvesting profit into tangible items such as computers and office furniture.
- The largest balance-sheet item after the KIM intangibles remains cash at a useful £23m. The books remain free of conventional bank debt.
- Cash conversion for this FY was once again very acceptable. Adjusted earnings of £22m actually translated into net cash after tax, capex and lease payments of £24m.
- Working-capital movements were not problematic, and have been positive for a remarkable five consecutive years:
| Year to 30 June | 2018 | 2019 | 2020 | 2021 | 2022 |
| Operating profit* (£k) | 12,528 | 10,504 | 11,598 | 26,820 | 28,004 |
| Depreciation and amortisation (£k) | 295 | 306 | 292 | 227 | 200 |
| Net capital expenditure (£k) | (137) | (421) | (79) | (93) | (259) |
| Working-capital movement (£k) | 1,423 | 894 | 69 | 2,361 | 2,344 |
| Net cash and investments (£k) | 19,937 | 18,232 | 18,419 | 29,699 | 30,112 |
- Following dividends (special and ordinary) of £21m, seed investments of £4m and £3m spent on shares for the Employee Benefit Trust (EBT), cash finished the year £3m lower.
- The EBT expense reflects the true cash cost of CLIG’s staff share schemes and is worth monitoring.
- During FYs 2020, 2021 and 2022, the EBT spent £7.2m buying shares to satisfy exercised options and received £1.5m from those exercised options.
- The average net EBT cash expense during that period was £1.9m a year, versus an average associated accounting charge of £0.8m.
- The EBT purchases during FY 2022 were not bargains (in hindsight) with an average 482p buy price. Purchases made after the year end have been undertaken at 410p and 390p.
- CLIG’s accounts also carry investments of £7m and remain free of defined-benefit pension obligations.
Valuation
- CLIG’s chairman offered “cautious optimism“:
“Over the course of the last two years, we have witnessed extreme volatility in capital markets and with the threat of long-term conflict in Europe and double-digit inflation ever present, it would be foolish to paint too optimistic a picture for the year ahead. Nevertheless, at the risk of sounding “glass-half-full”, I believe there are some early signs of a more stable market environment.“
…
“Since markets look well beyond the near horizon, and provided geopolitical friction does not proliferate beyond the existing conflict, there are grounds to support the view that the July 2022 “mini-bounce” may not be a flash in the pan.“
…
“Bear markets also bring opportunities, be it in the investment universe or the asset management industry more generally and, with this in mind, we continue to view the future with cautious optimism.“
- But the Q1 2023 (July-September) update published earlier this week was mixed:
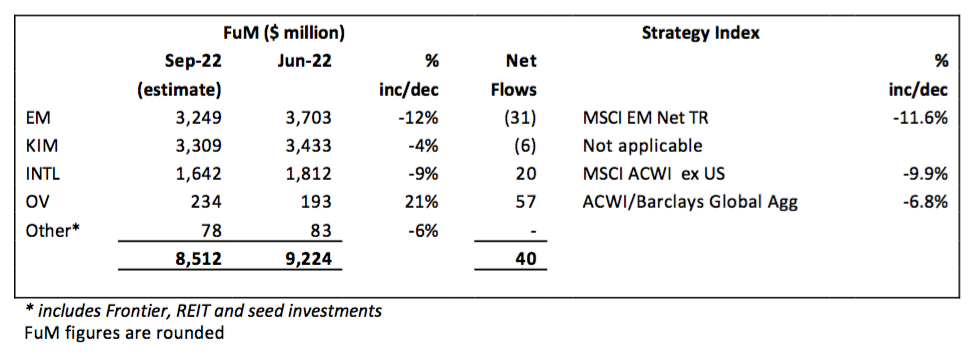
- The good news was clients handing over a net $40m to mark the fourth consecutive quarter of net FuM inflows.
- CLIG has never reported four consecutive quarters of net inflows since the group commenced quarterly FuM updates during FY 2018.
- The bad news was Q1 FuM declining $712m that implied a $752m negative investment movement.
- Q1 FuM down $752m from the year-end $9.2b is an 8.2% drop. The S&P 500 meanwhile fell 3% during the quarter.
- FuM at the latest $8.5b is 22% lower than the level seen twelve months prior.
- CLIM FuM at $5.2b is the lowest level for the division since March 2020 ($4.4b).
- The stronger USD versus GBP rescued CLIG’s FuM during Q1 2023. FuM denominated in GBP kept steady at £7.6b.
- The stronger USD also limited the damage to CLIG’s Q1 profitability. July’s Q4 2022 update had said profit before the profit share was £2.8m a month:
“‘Fixed’ costs are c.£1.7 million per month, and accordingly the run-rate for operating profit, before profit-share and amortisation of intangibles is approximately £2.8 million per month based upon current FuM and a US$/£ exchange rate of US$1.2178 to £1 as at 30 June 2022.”
- But this month’s Q1 2023 update revised the £2.8m down by only £0.1m:
“‘Fixed’ costs are c.£1.8 million per month, and accordingly the run-rate for operating profit, before profit-share is approximately c.£2.7 million per month based upon current FuM and a US$/£ exchange rate of US$1.117 to £1 as at 30 September 2022.”
- £2.7m a month with a 24% profit share and 25% tax would give earnings of £18.5m or 36p per share.
- Earnings of 36p per share compare with the adjusted 44p per share reported within these FY 2022 results.
- CLIG included a revised dividend-cover chart within this FY 2022 statement, but the new version may already be outdated following FuM sliding to $8.5b.
- The previous version had predicted earnings of £7.7m would be retained for FY 2022 and £8.2m would be retained for FY 2023.
- But the new version confirmed £5.6m was retained for FY 2022 and predicted £3.9m would be retained for FY 2023:
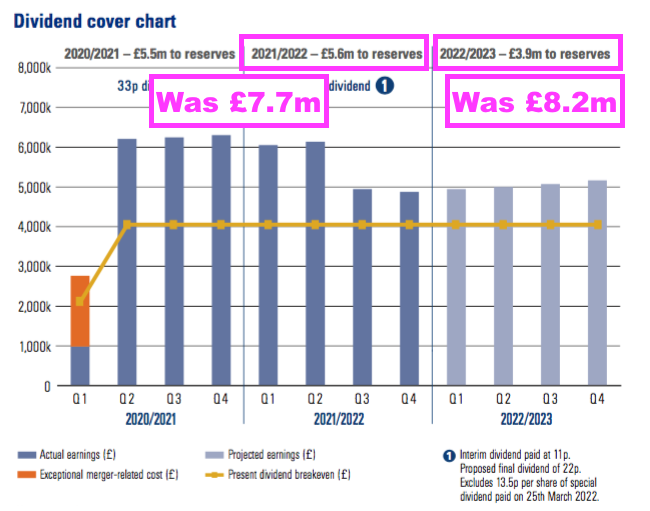
- The revised £3.9m is equivalent to 8p per share and, when added to the 33p per share dividend, implies FY 2023 earnings might now be 41p per share…
- …although doubling up the weaker H2 performance gives underlying earnings of £19.4m or approximately 38p per share…
- …while that earlier £2.7m a month calculation indicated 36p per share.
- Earnings of 36p per share would cover the trailing 33p per share dividend 1.09x and give a rolling five-year dividend cover of 1.29x (with earnings excluding merger costs).
- CLIG targets a 1.2x dividend cover for rolling five-year periods, which alongside the aforementioned £23m (c45p per share) cash position ought to mean the 33p per share payout can be sustained.
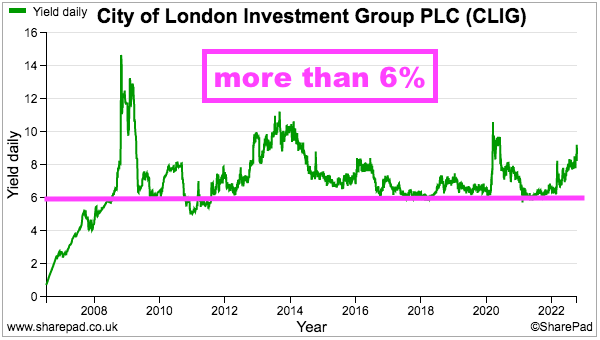
- Earnings of 36p per share and the trailing 33p per dividend put the 400p shares on a multiple of 11x and yield of 8.3%.
- CLIG’s rating does not look expensive, but the trailing P/E has frequently been less than 12 and trailing yield has almost always offered more than 6%:
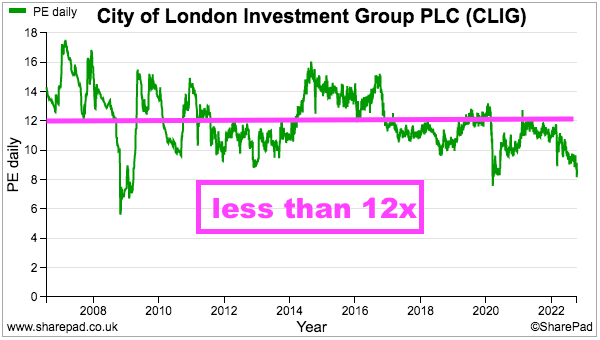
- The present trailing P/E rating has been cheaper only during the pandemic crash of 2020 and the banking crash of 2008/09.
- CLIG is one of the very few quoted companies with a public share-price ambition:
“We retain the share price KPI to show the total return of CLIG over a market cycle. The goal of this KPI is for the total return (share price plus dividends) to compound annually in a range of 7.5% to 12.5% over a five-year period.
- A 7.5% compound annual total return during the next five years appears very achievable, assuming the 33p per share dividend is maintained to support that 8.3% income.
- A 12.5% compound annual return during the next five years requires the 33p per share dividend to be maintained and the 400p share price to climb to 556p.
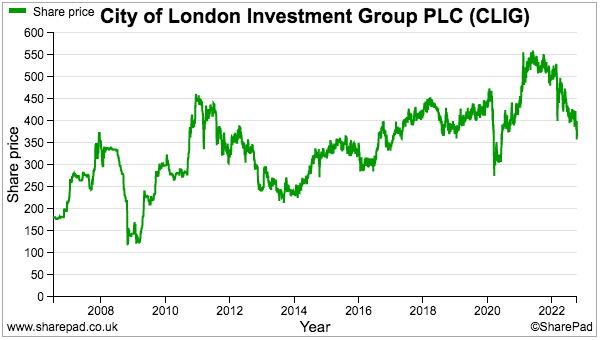
- The shares peaked at 550p during June 2021, meaning a full share-price recovery by 2027 should see that 12.5% KPI achieved.
Maynard Paton

Great review as always – thank you Maynard.
Main concern for me (apart from the obvious falling FuM) is the structure of the profit share scheme which does nothing to drive performance per employee. Given that a similar scheme has now been implemented at Karpus it isn’t likely to help turnaround the lack of any new net inflows at Karpus. The scheme focus needs at both businesses needs shaking up with rewards being more closely linked to individual and business performance with minimal rewards for ‘business as usual’.
Regarding valuation you say ‘Earnings of 36p per share and the trailing 33p per dividend put the 400p shares on a multiple of 11x and yield of 8.3%’. With the share price now down to 350p that now puts it on a multiple of 9.7 and a yield of 9.4% which looks very appealing.
Are you able to attend the forthcoming AGM? If so it would be great to hear your feedback.
Peter
Thanks Peter. The profit-share is not ideal, but this entire sector is arguably run for the benefit of the staff rather than the end customers because fund managers take a fee regardless of whether their FuM goes up or down. The profit-share has been in place for years and I suspect is unlikely to change (aside from creeping higher to pay KIM workers). I guess CLIG would argue incentives based closely on business performance could encourage staff to invest with greater risks to the long-term detriment of the end customer. Mind you, CLIG’s long-term EM holders have not exactly hit the jackpot over time with CLIG’s risk-averse style. I started to write the article when the shares were 400p, so apologies for not updating the valuation. I plan to go to the AGM and ask a few questions.
Maynard
City Of London Investment (CLIG)
Publication of 2022 annual report
Here are the points of interest:
1) BUSINESS MODEL
A reminder about the “risk-averse” team-based approach:
2) DIVIDEND POLICY
A reminder that the 1.2x dividend policy is reviewed every five years and will be reassessed during 2024:
”This policy was introduced in 2014 and was reviewed in 2019. No changes were proposed. It was designed to incorporate the required flexibility to deal with the potential volatility of CLIG’s income.
Details as follows:
* This is not a long-term policy. Rather, it will be reviewed after five years and every five years thereafter.”
3) KEY PERFORMANCE INDICATORS
a) Investment performance
The presentation slides showed CLIM’s funds delivering modest single-digit returns over the last five years:
But within the previous FY 2021 annual report, CLIM’s funds had mostly delivered decent double-digit five-year returns:
CLIM’s funds clearly suffered during FY 2022. The small-print revealed the performances for EM, International, Frontier and Opportunistic Value were in fact -28%, -24%, -9% and -15% respectively.
b) EMPLOYEE LONGEVITY
CLIG talks about low staff turnover:
“86% of our 21 portfolio managers have been with the Group* for five or more years, and 48% of all employees have been with the Group* for over ten years. (*or with KIM pre merger)”
True, a stable workforce is likely to be a content workforce and ought to be reassuring for shareholders.
But a stable workforce may be a comfortable workforce that is reluctant to change — i.e. investing in the same old way with the same old clients.
I do get the impression the CLIM division may be a little ‘sleepy’, otherwise why else can 95% of the division’s FuM be ahead of their benchmarks yet so little new FuM be received?
c) CLIENT ENTITY LONGEVITY
Interesting numbers here:
“As at 30th June 2022, the Group had 926 client entities in the over 10 years category (2021: 911), 448 in 5-10 years (2021: 446) and 593 in 0-5 years (2021: 642).”
Looks as though once a client stays beyond five years, they tend to stay for much longer.
The previous FY 2021 annual report declared only client numbers from CLIM, which came to 177. So the 1,967 total for FY 2022 means KIM clients total 1,790 assuming CLIM’s 177 was unchanged.
The 1,999 total for FY 2021 means KIM served 1,822 clients during that previous year.
The KIM merger document (point 5) revealed KIM had 2,273 client accounts (owned by 821 clients).
Assuming ‘client accounts’ in the merger document mean the same as ‘client entities’ in the annual reports, then KIM has lost 483 clients since the merger, which sounds a lot versus the 2,273 cited within the merger document.
Year-end FY 2022 KIM FuM of $3.4b means the average KIM client has FuM of $1.9m.
Year-end FY 2022 CLIM FuM of $5.8b means the average CLIM client (assuming 177) has FuM of $32m.
The accompanying client-longevity chart shows CLIM’s client count was 170 in FY 2018, 169 in FY 2018 and 173 in FY 2020, so not a lot of movement over the years which correlates with the general lack of new client money.
4) RISK MANAGEMENT
No changes here, aside from the removal of Covid-19 dangers. The principal risks remain:
* Key person;
* Technology, IT/cybersecurity, and business continuity;
* Material error/mandate breach, and;
* Regulatory and legal.
5) FINANCIAL REVIEW
a) Average FuM
Confirmation that my $10.5b average FuM guess for FY 2022 was correct:
“Average FuM for the year increased by 9% from US$9.7 billion in FY 2021 to US$10.5 billion in FY 2022.”
b) Commissions payable
KIM pays sizeable commissions to advisers:
“Commission payable of £1.6 million (2021: £1.1 million) relates to fees due to US registered investment advisers for the introduction of wealth management clients. The increase is primarily due to a full year of results for KIM being included in FY 2022.”
Note that CLIM does not pay commissions, so the £1.6m relates entirely to KIM.
In the blog post above I estimated KIM net fee income was £21.7m, so KIM revenue (net fee income + commissions) could be £23.3m, which would mean advisers took 7% (£1.6m of £22.3m) from KIM’s gross fees — a huge chunk.
Revisiting the KIM merger document, KIM’s commissions were not disclosed and only net fee income (i.e. after commissions) were reported:
I will try to double-check this 7% KIM commission rate.
c) KIM employees and profit-share/EIP
The following reads as if KIM employees do participate in the profit share:
“The total variable profit-share amounted to £9.2 million as compared with £7.9 million in 2021, an increase of 15.6% mainly on account of the full year of KIM costs included in FY 2022 as well as the impact of a stronger US dollar during the second half of FY 2022.”
Ah ha — revisiting the KIM merger document, KIM employees saw their pay boosted 10-11% by profit share:
Confirmation below of KIM employees participating in the Employee Incentive Plan:
“The Group’s EIP was offered to KIM employees from 1st January 2021 and thus FY 2021 only included a charge for six months.”
d) USD-denominated dividends
KIM founder/36% shareholder George Karpus has presumably asked for USD-denominated dividends:
“As a result of the merger with KIM in October 2020, as at 30th June 2022, c.53% of the Group’s shareholders are now based in North America. Although the Group continues to declare dividends in sterling, from October 2022, we have provided the option for shareholders to receive dividends either in sterling or US dollars, at a pre-determined exchange rate.”
CLIG recently confirmed the 22p per share final dividend will equal 24.7c per share.
Cash on hand is now mostly held in USD:
“In order to pay the anticipated US dollar dividends and non-sterling expenses, c.58% of the Group’s cash resources are held in US dollars as at 30th June 2022.”
e) Seeded funds
The new Global and SPAC funds suffered during the H2 market sell-off, although the overall loss was limited to 5%:
“During the year the Group has invested US$2.5 million (£1.9 million) in seeding a new Global Equity CEF Fund in December 2021 and US$2.5 million (£1.9 million) in a Special Purpose Acquisition Company (SPAC) strategy in March 2022. By the end of June 2022, these investments were valued at £3.6 million (2021: nil), with the unrealised loss of £0.2m (2021: nil) taken to the income statement.”
6) CORPORATE AND SOCIAL RESPONSIBILITY
a) Workplace
Seems like the staff have been asked to return to the office on occasion:
“Accordingly, during FY 2022, employees were provided flexibility to work from home (WFH) up to a certain number of days.
Our management team and the Board continued to engage ensuring open discussion with the wider workforce and implemented a new hybrid WFH policy with effect from 1st July 2022. We believe this better achieves the necessary balance of employee flexibility with respect to work/life balance whilst maintaining the benefits of employees working together in the office.”
b) Environment
The previous FY 2021 annual report mentioned usage of fax machines and paper payslips, which appear to have been discontinued by CLIG as they were not mentioned within this FY 2022 report. Actions currently involve:
“Further reduction in printing of annual reports/periodical portfolio reports and other research-based publications, thereby reducing paper usage.”
I see business travel has rebounded strongly after Covid-19:
c) Community
Repeating a point made within the previous FY 2021 annual report, CLIG likes to appoint lady-led suppliers:
“During FY 2022, CLIG has partnered with at least three vendors that are female-led, which provide services across a variety of sectors including document production, website design and company secretarial services. We chose these companies because they offer best-in-class services and products. We are also aware of the benefit of diversity of thought and leadership provided by female-led companies, and will continue to include the gender and ethnic characteristics of the leadership teams in the consideration process for any vendors we look to partner with.”
7) TASK FORCE ON CLIMATE RELATED DISCLOSURES
Two full pages of how CLIG is facing “one of the biggest challenges of our time“:
Nothing too revolutionary within the text, as CLIG will begin studying climate risk in more detail this year:
“CLIG will start conducting a scenario analysis in FY 2023 on various climate-related risks and opportunities.”
8) CORPORATE GOVERNANCE
a) Chairman’s succession
Plans are already afoot to replace the chairman:
“Looking forward, I have entered my tenth year on the Board as of 1st August 2022 and we have begun the process of identifying who will succeed me as Chair. In order to give my Board colleagues time to undertake this process in a robust and considered manner, I will offer myself for re-election to the Board at the 2022 Annual General Meeting (AGM) for one further year with the intention that I will not seek re-election at the 2023 AGM.”
Will George Karpus put himself forward?
b) Board activities
Not ideal that the board talks more often about pay than auditing:
All board members attended all board meetings.
c) Nomination committee report
The full text of George Karpus and his “future plans“:
“CLIG’s Founder, Barry Olliff, retired from the Board in July 2022 with our gratitude for his sage guidance over these many years. Our current Chair, Barry Aling, has indicated that he will serve one more year as Chair before standing down at the 2023 Annual General Meeting. George Karpus will continue to serve on the Board for the 2022-2023 financial year and we will provide an update prior to next year’s AGM regarding his future plans. Each of these changes has been agreed following much discussion, and we still have work to do to see these succession plans through.”
The full text could be interpreted as Mr Karpus being succeeded as well.
9) DIRECTOR REMUNERATION
Not quite sure of the “performance-orientated culture” noted within the introduction given’s CLIM’s long-term investment returns for clients:
“For those of you who have followed us for many years, you will know of City of London Investment Group’s disciplined, performance-oriented culture and our collegial team-based approach.”
And a reminder the company employs a team approach with no stars:
a) Proposed changes to remuneration policy
Nothing too untoward here; just a tightening up of director pay terms:
b) Executive Director remuneration outcomes
The executives enjoyed a good year; all collected 80% or more of their maximum payouts with two in the 90%-plus bracket:
The KIM director (Daniel Lippincott) is the lowest paid of the executives and received the lowest of the maximum payouts (80%), which underlines my understanding that KIM workers are paid less than CLIM workers.
c) Single total figure of remuneration
Executive basic salaries were kept steady during FY 2022, with differences being due to a stronger USD, minimal pay rises mid-way through the prior year and/or becoming a director part way through the prior year:
Profit-shares as a multiple of director fees and salaries were between 1.4x and 2.2x. The 1.4x profit-share was collected by the KIM director, which again emphasises KIM workers are paid less than CLIM workers.
The CLIM directors collected profit-shares of twice or more of their fees and salaries. The maximum payout is 2.5x. Note the waived profit-shares are doubled in value through the EIP scheme, although the EIP awards are not immediately collected by the directors.
Three of the executives were demoted to an executive sub-board following the year-end, so their pay will not be disclosed for FY 2023 and that pay (in theory) may not adhere to the formal board’s remuneration policy.
d) Pensions
Pensions are a chunky 12.5% of salaries:
“All employees*, including Executive Directors, are entitled to membership of the Group’s defined contribution pension arrangements. Contributions are capped at 12.5% of annual salary. Employer contributions in respect of all Executive Directors were 12.5% for the period under review. As part of his corporate advisory contract, Barry Olliff also received pension contribution at 12.5%.
Non-exec Mr Olliff also received a nice pension bonus. The text reads as if all staff receive 12.5% pension contributions, and indeed they do (see point 12b below).
Useful confirmation that implies KIM workers may not be about to enjoy their own 30% profit-share club:
“* As per the merger agreement, compensation and benefits for KIM employees remain consistent with pre-merger practices of KIM”
e) Measuring performance
This text below reads as if the directors are assessed on office gossip!
“Executive Director performance appraisals are conducted on an annual basis and, in-keeping with the Group’s team-based approach, are partly deduced from daily, honest feedback solicited from the open office environment in which the Group operates. Discretion is applied appropriately, with bonus awards being adjusted upwards or downwards depending on the outcome of annual performance appraisals. ”
f) Director shareholdings
The table below confirms the four executives received dividends of £444k:
Not a great dividend income when total pay/profit-share/EIP of the four executives was £3,188k.
At least total shares owned by the four were 1,080k versus 164k EIP options and 20k standard options.
And non-exec George Karpus collects a useful £7m a year dividend!
g) Remuneration voting
A 7% protest vote at the 2021 AGM:
The size of protest vote was similar to the 2020 AGM, which in turn followed a 16% protest vote against the remuneration policy presented to shareholders at the 2019 AGM. Let’s see how the voting goes for the revised policy presented at the forthcoming 2022 AGM.
10) DIRECTORS’ REPORT
a) Own shares
Confirmation of the number of shares purchased during the year:
“The number of own shares purchased by the Company’s Employee Benefit Trust during the year was 552,730 (2021: 496,354). The number of own shares held by the Trust as at 30th June 2022 was 1,708,763 (2021: 1,591,158), of which 328,750 shares (2021: 405,750) were subject to options in issue.”
b) Shareholder relations
A bit sad — the directors may not attend the AGM in person:
“ Engagement with shareholders is of paramount importance to the Group. The Directors, including on occasions the Senior Independent Non-Executive Director and the Chair of the Board, endeavour to meet with large shareholders at least twice annually, generally following interim and final results announcements. Following these meetings, the Directors report back to the Board. All of the Directors aim to attend the Annual General Meeting either in person or by video conference.”
11) AUDITOR’S REPORT
Nothing untoward here.
The key audit matter covering acquisition accounting was understandably dropped for FY 2022 following the KIM merger during the previous year. The other key audit matters were unchanged.
A few small changes to this year’s audit text, including an SEC regulatory examination…
“Our audit work in respect of KIM’s compliance with the SEC regulatory requirements included holding discussions with US colleagues, KIM’s Chief Compliance Officer and review of compliance documentation prepared by both management and an external consultant, including the outcome of an SEC regulatory examination.”
…and a review of management’s previous forecasts when double-checking for impairments of goodwill and intangibles:
“Retrospective review of the accuracy of management’s forecasts from the prior year.
Materiality at £1.15m was a standard 5% of group pre-tax profit.
The full-scope audit covered 100% of revenue, and 6% of revenue was earned in a subsidiary with no revenue:
12) NOTES TO THE FINANCIAL STATEMENTS
a) Segmental analysis
The chairman’s statement referred to 100% of revenue being denominated in USD, but the formal accounts show 5% of revenue generated by clients outside of the US:
Maybe those non-US clients pay in USD.
b) Employees
Profit-share payments bolstered basic wages by 82% during FY 2022 (85% for FY 2021):
And pension contributions were 13% of wages for both years.
A full-year owning KIM means average employee numbers post-merger have become clear:
KIM looks to have brought +12 investors, +8 sales people, +4 client managers and +14 admins. As mentioned in the blog post above, KIM’s larger sales force suggests a keener desire to promote FuM.
c) Intangible assets and impairment
Some adverse changes to the KIM goodwill and intangible impairment calculations, which could one day lead to a write-off:
“The recoverable amount of the CGU exceeded the carrying amount of the CGU at 30th April 2022 by £1,391,854 (2021: £6,745,000).”
The carrying value of the KIM goodwill and intangibles was £110m, so £1.4m headroom is not great.
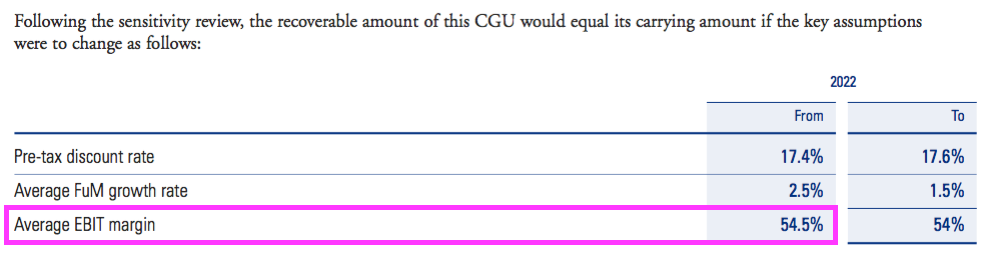
The assumptions applied by the impairment calculations have been changed adversely. The discount rate has been raised (i.e. lowering the future value of predicted cash flows), the projected FuM growth rate has been lowered and the assumed margin has decreased:
The text in bold below has been added for the FY 2022 annual report and seems like preparation for a future impairment:
“The Directors and management have considered and assessed possible changes to other key assumptions and have not identified any instances that could cause the carrying amount of the CGU to exceed its recoverable amount. Current economic circumstances have become more uncertain due to events outside the control of the business such as the impact of the war in Ukraine. The potential impact on global markets cannot be reliably estimated and if these result in a sustained period of weakness in financial markets this could result in a future impairment. ”
d) Other financial assets
These assets comprise CLIG’s seeded funds:
A £0.6m loss does not seem that awful given the rough market conditions endured and the £4m starting value and £4m subsequent investment.
e) Trade and other receivables
Accrued income represents fees owed to CLIG but not yet invoiced to the client. CLIG’s fees are due monthly or quarterly, and the large accrued-income balance suggests CLIG invoices customers after the month or quarter end:
Trade receivables plus accrued income for FY 2022 equates to just 8% of revenue, which is the lowest level since at least FY 2007.
The low level of outstanding accrued income at year-end is I suspect due to FuM declining sharply during H2, rather than any favourable changes to client cash collection.
f) Trade and other payables
CLIG’s favourable working-capital cash movements appear based on significant accrued expenses (i.e. expenses recognised in the income statements but not yet paid by CLIG):
I am quite sure the accrued expenses are staff bonuses that will be paid after the year end.
g) Share-based payments
A large table detailing the accounting expense of the EIP:
The table omits the awards granted during October 2017, which the FY 2021 annual report revealed had an associated £581k charge and would have taken the total EIP accounting expense from £4,263k to £4,844k.
The charge for the latest batch of awards is £1,184k, and CLIG to its credit does show the estimated charge and the actual charge for past awards — and the differences are not significant.
I must admit I tend to ignore CLIG’s accounting charges for options and the EIP, and instead use a combination of the full share count (i.e. ignoring shares held by the EBT, because they will eventually be used to satisfy options and EIP awards) and the net cash expense of funding share purchases for the EBT.
h) Financial instruments
Confirmation that hedging arrangements will (sadly) not allow a stronger USD to convert into a higher GBP cash position:
“Had the US dollar strengthened or weakened against sterling as at 30th June 2022 by 10%, with all other variables held constant, the Group’s net assets would have increased or decreased (respectively) by less than 1%, because the US dollar position is hedged by the forward sales.”
And confirmation of clients paying on time:
“The Group has zero experience of bad or overdue debts.”
Maynard
City of London Investment (CLIG)
Portfolio update
I should add that, after publishing the blog post above, I managed to increase my CLIG holding by 50% at 353p including all costs.
Maynard
City of London Investment (CLIG)
Q2 Trading Update published 20 January 2023
Not a spectacular update, with client-fund outflows exceeding inflows and breaking a run of four consecutive quarters of net inflows. The H1 financial performance seems very comparable to the preceding H2, and dividend cover remains tight.
Here is the full text interspersed with my comments:
——————————————————————————————————————
City of London (LSE: CLIG), a leading specialist asset management group offering a range of institutional and retail products investing primarily in closed-end funds, announces that on a consolidated basis, as at 31 December 2022, FuM were US$9.2 billion (£7.6 billion). This compares with US$9.2 billion (£7.6 billion) at the Group’s year end on 30 June 2022. A breakdown by strategy follows:
IM Performance
Solid relative performance across CLIG’s investment strategies resulted from good NAV performance at the underlying closed-end funds.
Over the period, there were inflows of circa US$295 million, outpaced by outflows resulting in net outflows of circa US$107 million across the Group’s strategies, led by EM redemptions and required minimum distributions for Karpus Investment Management (“KIM”) strategies at year end.
Business development will focus on EM, International, and Opportunistic Value strategies, and KIM balanced mandates, where additional capacity is now available for prospects.
——————————————————————————————————————
Oh dear. CLIG reported its first quarterly net outflow of client money since Q1 2022 (Jul-Sep 2021).
Following the preceding Q1 2023 statement, this latest update implies clients withdrew a net $147m from CLIG’s funds during Q2 2023. The bulk, $97m, was withdrawn from KIM with $34m withdrawn from EM, $7m from International and $9m from OV.
A bit sad that the International funds witnessed client withdrawals (albeit only $7m); such FuM was the most appealing for new client money during FYs 2017 (+$69m) 2018 (+$279m), 2019 (+$253m), 2020 (+$551m), 2021 (-$14m) and 2022 (+$453m).
The text “required minimum distributions for Karpus Investment Management” is new. I learned at the AGM that KIM serves many retired people, who apparently withdraw a collective c$100m a year for living expenses.
“Business development will focus on EM…” suggests the EM funds are now re-open for new money after suffering from “capacity constraints” previously.
Total FuM of $9,150m compares to $8,512m at the end of Q1 2023, so at least FuM is higher due to market movements, with my early sums suggesting a blended +6.5% investment return across all FuM during the quarter and a +1.0% return during the preceding 12 months.
——————————————————————————————————————
Operations
The Group’s income currently accrues at a weighted average rate of approximately 73 basis points of FuM, net of third party commissions. “Fixed” costs are c. 1.9 million per month, and accordingly the current run-rate for operating profit before profit-share is approximately 2.7 million per month based upon current FuM and a US$/£ exchange rate of US$1.2083 to 1 as at 31 December 2022.
The Group estimates the unaudited profit before amortisation and taxation for the six months ended 31 December 2022 to be approximately £11.9 million (six months ended 31 December 2021: £15.5 million).
Inclusive of our regulatory and statutory capital requirements, cash and cash equivalents stood at £19.1 million at the end of the calendar year (£22.7 million as at 30 June 2022), in addition to the seed investments of £7.6 million. Our cash reserves will allow us to continue managing the business conservatively through volatile markets while following our dividend policy for our shareholders.
The Company is currently in a close period which will end with the publication of results for the six months ended 31 December 2022 on 22 February 2023.
——————————————————————————————————————
A fee rate of 73 basis points matches the rate enjoyed during FY 2022 and pleasingly does not suggest any further pressure on client charges.
Profit before tax and amortisation of £11.9m for H1 2023 is comparable to the preceding H2 effort of £11.7m (FY £27.2m less H1 £15.5m). Note CLIG will have enjoyed a not insignificant currency boost during this H1; GBP:USD averaged 1.175 versus 1.300 during H2 2022 and 1.363 during H1 2022.
Cash declining almost £3m lower during this H1 is most likely to reflect the payment of the (chunky) final dividend (22p/share or c£11m).
——————————————————————————————————————
Dividend
The Board declares an interim dividend of 11p per share, which will be paid on 31 March 2023 to shareholders registered at the close of business on 3 March 2023 (2021: 11 pence).
Dividend cover template
Please see dividend cover template attached here:
The dividend cover template shows the quarterly estimated cost of dividend against actual post-tax profits for last year, the current six months and the assumed post-tax profit for the remainder of the current year and the next financial year based upon specified assumptions.
——————————————————————————————————————
The dividend template has been revised. CLIG previously assumed earnings of £3.9m may be retained during this FY, but that assumption is now £1.5m (or nearly 3p per share). The template now shows retained earnings for FY 2024 of £1m or 2p per share. So dividend cover on the trailing 33p per share payout remains tight. An unchanged H1 dividend is therefore not surprising.
I see expectations for yearly incoming client FuM for KIM have been downgraded to $50m for FY 2024, which still feels ambitious as this division has seen clients consistently withdraw money following the completion of the merger during October 2020.
And I believe two of the yellow bars ought to be blue to signify they are projected earnings.
Maynard