03 August 2017
By Maynard Paton
Quick update on City of London Investment (CLIG).
Event: Trading statement and shareholder presentation for the year ending 30 June 2017 published 19 July 2017
Summary: Earlier updates had already signalled these summary annual results would be positive. However, the fund manager’s progress was supported entirely by favourable markets and currency movements — the year actually witnessed a net outflow of client money. Still, the icing on the cake was the first dividend lift for six years and, despite the share price climbing since this time last year, the payout still supports a 6% income. The presentation also outlined the potential cost of the new staff bonus scheme, and I am hopeful the cited 2% of revenue will not eventually rise towards the scheme’s 5% limit. I continue to hold.
Price: 410p
Shares in issue: 26,861,707
Market capitalisation: £110m
Click here for all my previous CLIG posts
Results summary:

My thoughts:
* Further credit to management for another set of prompt summary results
It took CLIG just twelve working days to construct this set of summary annual accounts. I only wish all quoted companies could be as timely when first presenting their yearly progress.
Note that CLIG’s RNS on the day did not reveal all of the numbers. The group’s website carried a City presentation, which included some detailed figures as well as various charts and other stats.
* The positive performance was no surprise
CLIG’s interim figures and subsequent website updates had already indicated these annual results would be positive.
In the event, the presentation confirmed funds under management (FUM) at the end of June were $4.611bn — up 16% from the $4.005bn seen at the preceding year-end and up 14% from the $4.097bn seen at the December half-year.
Revenue climbed 28% and in turn lifted operating profit by 48%. The financial progress was supported by favourable Brexit currency movements, as almost all revenue is collected in USD while 40% of costs are paid in GBP.
My own monthly calculations following the interim numbers had indicated annual earnings could have been running at between 29.7p per share and 32.8p per share — somewhat lower that the 36.9p per share reported.
However, my estimates were based on the new staff bonus scheme taking 5% of revenue (versus just 1% in reality — see below) and ignored a £400k one-off tax benefit.
Anyway, CLIG’s performance was the company’s best since 2012, when revenue was £34m and operating profit was £11m:
| Year to 30 June | 2013* | 2014** | 2015 | 2016 | 2017 |
| Funds under management ($m) | 3,713 | 3,944 | 4,211 | 4,005 | 4,661 |
| Revenue (£k) | 29,364 | 24,215 | 25,356 | 24,413 | 31,294 |
| Operating profit (£k) | 8,359 | 6,998 | 8,727 | 7,757 | 11,508 |
| Finance income (£k) | 501 | 244 | 205 | 212 | 82 |
| Other items (£k) | - | - | - | - | - |
| Pre-tax profit (£k) | 8,860 | 7,242 | 8,932 | 7,969 | 11,590 |
| Earnings per share (p) | 24.9 | 20.7 | 26.4 | 23.6 | 36.9 |
| Dividend per share (p) | 24.0 | 24.0 | 24.0 | 24.0 | 25.0 |
(*to 31 May **13 months)
The icing on the cake was the annual payout being lifted a penny to 25p per share.
It’s about time there was a dividend improvement — the payout had been stuck at 24p per share for the previous six years!
The raised payout is also welcome in light of the new staff bonus scheme (see below) — at least shareholders appear to be sharing in the group’s greater earnings, too.
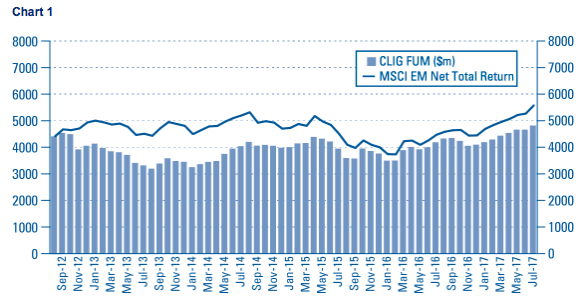
* Has a rising market tide simply lifted the CLIG boat?
Alongside the weaker GBP, rising global stock markets also assisted CLIG’s impressive financial performance.
CLIG confirmed its wider company benchmark — the MSCI Emerging Markets index — had gained 24% on a total return basis during the year.
Unfortunately, the stronger market could not tempt clients to invest further money. Instead, CLIG’s statement admitted clients withdrew a net $280m from their portfolios.
Apparently, the clients “rebalanced into the significant… equity gains” — which I assume to be pretentious City code for “took profits”.
There was little movement on the number of clients, too.
The shareholder presentation showed CLIG serving 155 clients at the end of June, while my copies of older presentations show 153 clients a year ago and 153 a year before that.
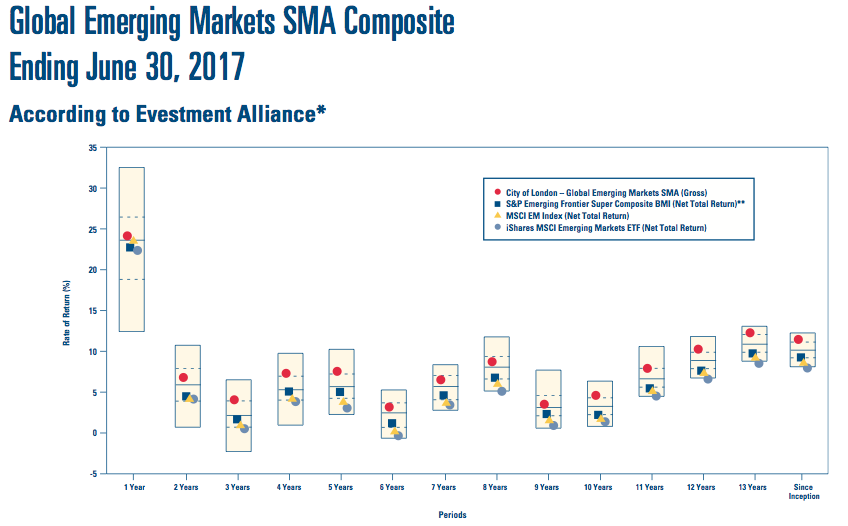
At least CLIG’s own investment performance has regained its poise.
The latest presentation revealed a representative CLIG fund having consistently outperformed its benchmarks over various periods:
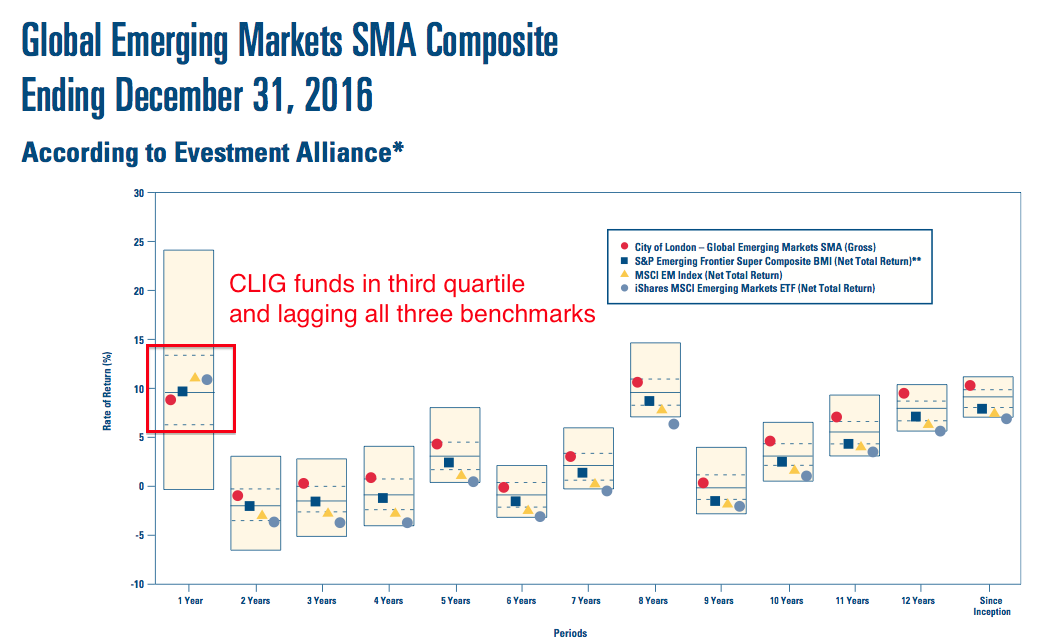
Back in January, the same chart had shown CLIG’s fund having underperformed all three benchmarks during 2016:
* New $500m prediction of fresh client money
I suppose it’s reassuring to see CLIG now assuming it can garner $500m of new client money during the upcoming 2018 financial year:
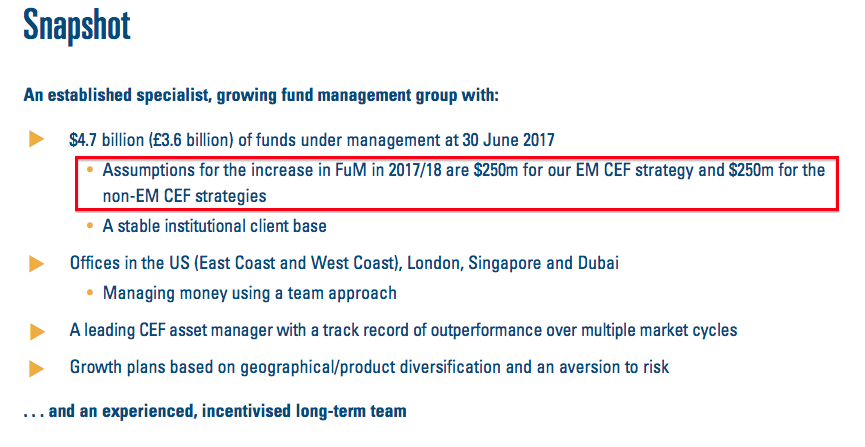
Back in January the prediction for 2018 was $250m.
CLIG said net new mandate wins of $125m had already been confirmed for this financial year, so I guess there is some justification for the $500m projection.
Nevertheless, I have seen CLIG’s estimates of new client money vary so much during recent years — and become overshadowed anyway by wider market movements — that I now pay scant attention to them.
(I’ve found that I experience less disappointments that way.)
* Updated dividend-cover prediction suggests 2018 earnings of 36p per share
Past experience has also taught me to pay little attention to CLIG’s dividend-cover template.
Don’t get me wrong, I commend CLIG for regularly publishing this template to highlight what could happen.
But the ups and downs of client withdrawals alongside wider market movements have shown the numbers to be somewhat optimistic at times.
For the record, six months ago the template looked like this:
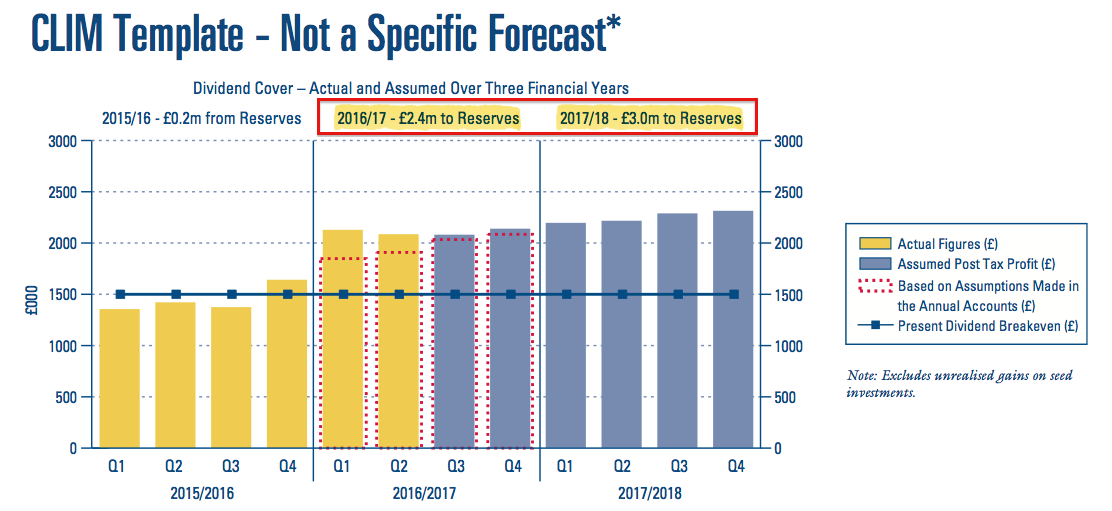
And now it looks like this:
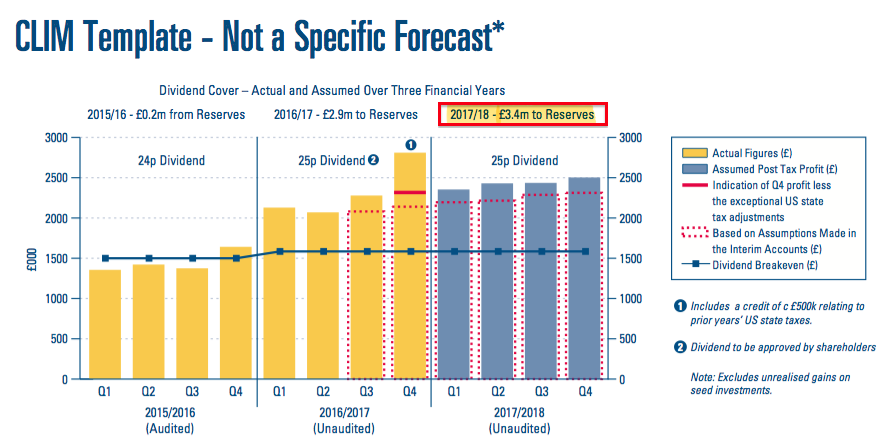
Essentially CLIG presently reckons it could retain earnings of £3.4m during the current year — versus £3.0m previously expected.
I reckon £3.4m transferred to reserves after paying a 25p per share dividend means earnings could be about 36p per share.
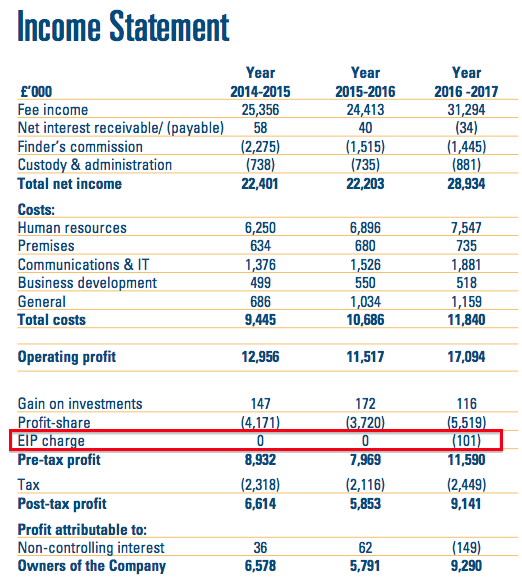
* New bonus scheme pinching 2% of revenue
These were the first results to include a charge for the new employee incentive plan (EIP).
Introduced part way through the year — and devised to hand CLIG employees up to an extra 5% of group revenue until 2020 for simply doing their current jobs — this awful scheme cost shareholders £101k during 2017:
The aforementioned dividend-template projection suggested the EIP could pinch 2% of annual revenue in the future:
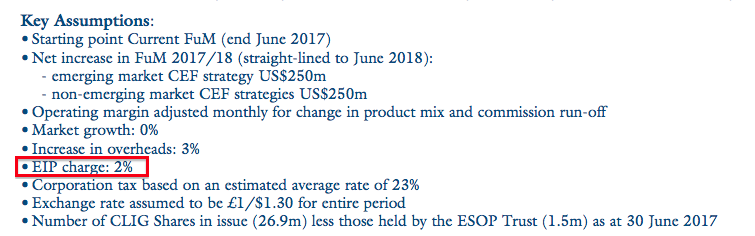
2% of last year’s £31m revenue equates to £625k. In contrast, the additional 1p per share dividend paid to shareholders will cost about £250k.
You can draw your own conclusions as to how management is prioritising the distribution of the group’s higher earnings.
Let’s just hope the projected 2% EIP charge proves to be accurate and the 5% maximum cap is never troubled.
For the record, CLIG says 60% of its staff are participating in the EIP.
(I am not sure what to make of the fact that 40% of the staff are therefore passing up the opportunity to earn extra CLIG shares for free.)
* Illustrative FUM/exchange-rate table sneaks in lower net fee
I was disappointed to see CLIG owning up to lower net fees within its helpful FUM/exchange-rate table:

Previous tables had indicated CLIG would earn net fees at 85 or 86 basis points on client money.
At least CLIG’s operating costs have not changed.
I note the indicated tax rate is 23%, which compares to the underlying 25% rate for 2017. I am not sure whether the lower tax rate is due to the EIP or something else.
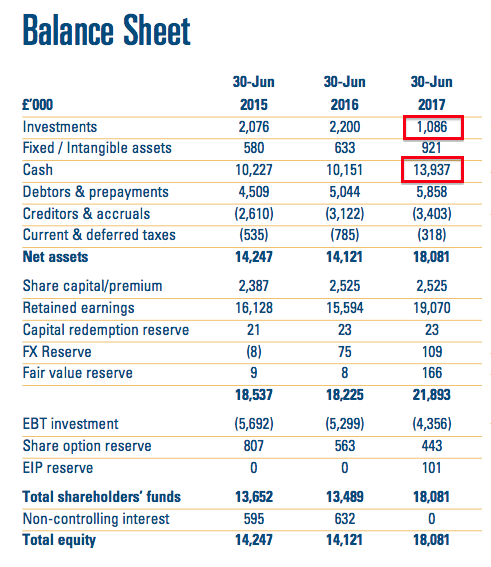
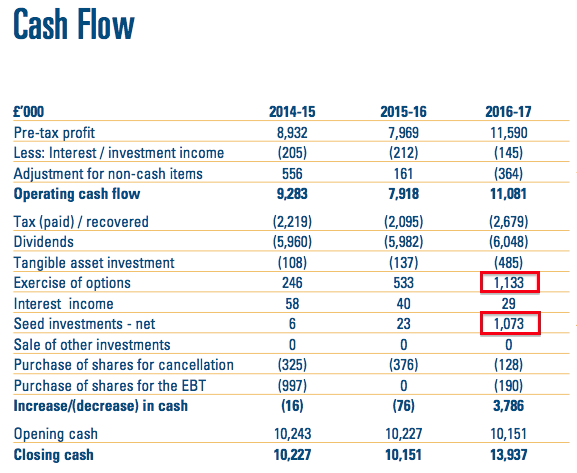
* Balance sheet and cash flow
A quick check of the summary accounts did not show anything untoward.
The balance sheet displayed cash of £13.9m and net investments of £1.1m versus £10.2m and £1.5m (£2,223k less £632k minorities) twelve months ago:
Meanwhile, the cash flow statement showed the cash position being bolstered by useful £1m contributions from staff options and the sale of certain seed investments:
———————-
Update 20 September 2017:
Following the publication of the full 2017 results (see this Comment below), I can confirm cash generation during last year — and the few years before that — has been very positive:
| Year to 30 June | 2013* | 2014** | 2015 | 2016 | 2017 |
| Operating profit (£k) | 8,359 | 6,998 | 8,727 | 7,756 | 11,509 |
| Depreciation and amortisation (£k) | 223 | 185 | 171 | 168 | 231 |
| Net capital expenditure (£k) | (60) | (38) | (108) | (137) | (485) |
| Working-capital movement (£k) | 1,046 | (1,933) | 442 | (22) | (533) |
| Net cash and investments (£k) | 13,947 | 11,031 | 11,707 | 11,719 | 15,022 |
(*to 31 May **13 months)
Since 2013, aggregate cash spent on capital expenditure (of only £829k) has been covered by the depreciation charged against earnings.
Meanwhile, just £1m of cash has been absorbed into working-capital requirements during a five-year period when total operating profit came to £43m.
———————-
My early sums indicate the operating margin was a healthy 37% during the year, with return on average equity coming in at a robust 59%:
| Year to 30 June | 2013* | 2014** | 2015 | 2016 | 2017 |
| Operating margin (%) | 28.5 | 28.9 | 34.4 | 31.8 | 36.8 |
| Return on average equity (%) | 85.7 | 36.1 | 47.7 | 42.7 | 58.9 |
(*to 31 May **13 months)
I will look at the accounts in more detail when the full annual report is issued during September.
Valuation
I’m using CLIG’s latest exchange-rate/FUM table (see above) for my valuation sums.
I’m taking FUM as $4.8bn following the group’s latest website update…
…while the GBP:USD exchange rate I’m applying is 1.32.
All that gives me earnings of about £9.9m or 36.8p per share based on an EIP charge of 2% and tax at 23%.
Assume the EIP is the maximum 5% and the tax rate is last year’s 25%, then earnings come to £9.2m or 34.3p per share.
Adjusting CLIG’s £110m market cap for group’s cash and investments of £15m and regulatory capital of £1.4m, my enterprise value (EV) calculation is approximately £96m or 359p per share.
Dividing that EV by my earnings guesses gives possible P/Es of 9.7 and 10.5 — depending on which EIP and tax assumptions are used.
Neither multiple looks expensive in the current market, although bear in mind these shares have rarely — if ever — traded at a lofty rating in the past.
Furthermore, the business appears to be at the whim of global stock markets — and recent progress has been much more to do with favourable exchange rates than winning new clients.
At least the new 25p per share dividend is covered quite well by my earnings guesses — and supports a welcome 6% income at 410p.
Maynard Paton
Disclosure: Maynard owns shares in City of London Investment.

City of London Investment (CLIG)
Monthly FUM Update
http://www.citlon.com/shareholders/announcements.php
CLIG has announced on its website that Funds Under Management at the end of August have increased a fraction to about $4.9bn:
Using the latest FUM/FX earnings table shown in the Blog post above, and applying a 35% bonus pool and 25% tax rate, current earnings could be running at £9.62m — equivalent to 35.8p per share — with £1 buying $1.31.
Maynard
City of London Investment (CLIG)
Publication of 2017 Final Results and Annual Report
CLIG published its final results and annual report for 2017 on 18th September. As far as I could tell, there was no difference between the numbers published within August’s summary statement (as reviewed in the Blog post above) and the subsequent full final results.
I have amended the Blog post above to include a new cash flow table.
Here are some points of interest from the annual report:
1) Management commentary
The summary statement reviewed within the Blog post above contained little in the way of a management narrative, so the chairman’s statement and chief exec’s statement was entirely fresh.
To be frank, the narrative seemed a little too self-congratulatory — the chairman made lots of references with how CLIG has performed since its 2006 flotation to 2017.
However, I do get the impression CLIG’s performance has not been as great during the last five years as it has during the last 11.
Also, a fair chunk of 2017’s performance was due to the weakened GBP inflating the USD-based FUM, rather than through CLIG’s own efforts.
Perhaps the most noteworthy part of the chairman’s statement was this:
Bear in mind that the chairman leaves his post at the end of the current financial year, so won’t be around to explain matters if future profits are not “soundly based”
Meanwhile, chief exec Barry Olliff wrote extensively about KPIs and sector pay… and also about something called a “Client Retention program” (sic)
Just as helpful would be Mr Olliff implementing a Client Addition programme, whereby he prods his staff try to secure fresh mandates from new customers.
You see, new client money has been very hard to come by…
2) Clients
Here is an embarrassing chart:
The blocks coloured yellow represent new client money being added and withdrawn each year. As far as I can tell, CLIG has experienced a net outflow of client money during the last ten years. The amount of new money added between 2014 and 2017 is shockingly low.
CLIG admitted $306m was withdrawn from its core Emerging Market funds, and just $26m added to its other funds, during 2017:
The following charts are interesting.
This first one shows the money invested by the largest 10 clients:
The top 10 represent 50.3% of $4,661m FUM at June 2017, versus c47% for 2016 and 2015 and 44% for 2014.
This next chart confirms a lower number of total clients, and fresh clients (represented by the dark-blue shading) reducing in number:
And this chart shows that when new client money is won, it tends to arrive in significant lumps (2009 and 2014), rather than through a more consistent inflow:
3) Investment performance
The annual report contained several charts that suggested CLIG’s funds had consistently outperformed three benchmarks:
CLIG’s funds are represented by the red circles, and the higher up the charts they are, the better the funds have performed.
What is quite disappointing, then, is the fact CLIG continues to struggle to attract new clients even with this record of outperformance.
4) Director pay
There was nothing too surprising with CLIG’s director pay.
This table shows what the board earned:
It appears the executives — barring the chief exec — received pay improvements of between 7% and 10%. Also, the weakened GBP meant the USD-paid directors appeared to enjoy hefty wage hikes (but in reality did not):
One interesting feature of the above pay table is the appearance of negative figures for the EIP participation. I believe this is due to the participants waiving part of their bonus in exchange for twice the amount to be paid through shares at a later date. I reckon the current table shows the (negative) waived bonus, and I presume future tables will in time show the (counterbalancing positive) value of the associated shares.
Not everyone was happy with the director’s Remuneration Policy that was set out in last year’s annual report. Some 18% of votes cast voted Against the relevant AGM resolution:
Votes Against were 18%, 16% and 74% for the previous three years. No wonder, then, that the chief exec rattles on about sector pay in the management narrative.
I think there would be more votes For the directors remuneration policy were the firm to drop schemes such as the EIP, which to me is simply a backdoor way of paying employees more despite very little evidence of the business advancing through additional client money.
Two more interesting snippets…
This is the first time I have noticed the chief exec can enjoy up to six weeks off — on top of his 30 days standard holiday — and still get paid:
At least the chief exec has kept his profit share at 4.2%:
5) Employees
I am pleased CLIG could manage the 15% FUM advance during 2017 without the need for extra staff:
Average FUM per employee is $64.7m, which is the highest since 2011 ($85m). Gross fee income per employee is £435k, the highest since 2012 (£443k).
One the downside, the cost per employee has jumped to £183k — the highest ever (previous rates were c£150k and the previous peak was £172k). I see employee costs as a proportion of revenue was 42% during 2017, in line with the 41% of 2015 and 43% of 2016.
I also see that just three staff members are devoted to business development/marketing — which is no doubt why new clients have been hard to recruit.
This chart shows the group’s portfolio managers are loyal employees:
And this next note gives some indication of the cost of the EIP:
The above note reflects only the Bonus shares.
It will be interesting to see just how much this EIP actually costs CLIG’s shareholders and whether this “estimated fair value” proves to be accurate.
6) Working capital
I can’t really fault CLIG’s cash production and working-capital profit.
I have inserted a new cash-flow table in the Blog post above to highlight the cash generation.
It is also worth looking at CLIG’s trade receivable and trade payable accounting notes:
Trade receivables of £67k and trade payables of £19k are ludicrously small. It just goes to show not a lot is tied up in ‘invoiced’ working capital.
(You will see CLIG does have sizeable accrued income (in the receivables note) and accruals (in the payables note). These figures represent revenue and expenses that relate to the 2017 year but have not yet been invoiced to the customer (revenue) or invoiced to CLIG (expenses). I am not too worried about these amounts and the associated invoice timing given CLIG’s overall cash production)
7) Valuation
The annual report did not supply any changes to the helpful FUM/FX profit table outlined in the summary results presentation.
However, the report did clarify current-year tax at 23% and current FUM at $4.9bn:
With GBP buying 1.35 USD, I calculate earnings could be £9.5m based on $4.9bn FUM, 23% tax and the EIP taking the full 5% of revenue.
Maynard
City of London Investment (CLIG)
Q1 Trading Update
Here is the text:
—————————————————————————————————————————–
City of London (LSE: CLIG), a leading specialist asset management group focused on emerging markets and closed-end funds, announces that as at 30th September 2017, FuM were US$5.0 billion (£3.7 billion). This compares with US$4.7 billion (£3.6 billion) at the Company’s year-end on 30th June 2017. In US dollar terms, this represents an increase over the 3 month period of 6% as compared with the MSCI EM T/R Index which rose by 8% and the MSCI World T/R index which rose 5% over the same period.
As a result of rebalancing, the Group continues to see some redemption requests but, by way of offset, it has a robust pipeline of potential business.
Operations
The Group’s income currently accrues at a weighted average rate of approximately 84 basis points of FuM, net of third party commissions. “Fixed” costs are c. £1.0 million per month, and accordingly the current run-rate for operating profit, before profit-share of 30% and an estimated EIP charge of 2%, is approximately £1.6 million per month based upon current FuM and a US$/£ exchange rate of US$1.34 to £1 as at 30th September 2017.
The Group estimates that the post-tax profit for the first three months of the year will be approximately £2.5 million (2016: £2.3 million, after an unrealised profit on seed investments of £0.2 million).
—————————————————————————————————————————–
Funds under management have increased further to $5bn. Here is the usual chart from http://www.citlon.com/shareholders/announcements.php:
Using the latest FUM/FX earnings table shown in the Blog post above, and applying a 30% bonus pool, a 5% EIP and a 23% tax rate, current earnings could be running at £10.2m — equivalent to 37.9p per share — with £1 buying $1.31.
Maynard,
I see Barry Oliff has offloaded 75,000 shares this week which didn’t help the recent share price rise at all
Regards
David
Barry Oliff has sold a further 50,000 shares this week
City of London Investment (CLIG)
Monthly FUM Update
http://www.citlon.com/shareholders/announcements.php
CLIG has announced on its website that Funds Under Management at the end of October have increased a fraction to about $5.1bn:
Using the latest FUM/FX earnings table shown in the Blog post above, and applying a 35% bonus pool and 25% tax rate, current earnings could be running at £10.51m — equivalent to 39.1p per share — with £1 buying $1.31.
Maynard
City of London Investment (CLIG)
Monthly FUM Update
http://www.citlon.com/shareholders/announcements.php
CLIG has announced on its website that Funds Under Management at the end of December have increased a fraction to approximately $5.3bn:
Using the latest FUM/FX earnings table shown in the Blog post above, and applying a 35% bonus pool and 25% tax rate, current earnings could be running at £10.46m — equivalent to 38.9p per share — with £1 buying $1.35.
Maynard
City of London Investment (CLIG)
Trading Update
CLIG’s post half-year and year-end trading updates are usually accompanied by a comprehensive presentation available on the group’s website. These presentations include detailed financials and all sorts of informative charts.
Sadly no such presentation exists at present: http://citlon.com/shareholders/share_reports.php
If a presentation does appear, then I will write a new Blog post and these notes will be included.
In the meantime, the trading update did not provide any great surprises. Here is the first part of the text:
————————————————————————————————————————————
City of London (LSE: CLIG) announces that total funds under management (FuM) at the Group’s half year on 31 December 2017 were US$5.3 billion (£3.9 billion). This compares with US$4.7 billion (£3.6 billion) at the Company’s year-end on 30 June 2017. A breakdown by strategy follows:
Positive relative investment performance was recorded across Developed, GTAA and Frontier strategies. Generally, a combination of strong NAV performance, discount narrowing and opportunistic participation in event driven US situations drove relative performance.
The EM strategy under-performed due to widening discounts and an underweight to the Chinese IT sector which posted very strong returns. Net flows were positive in aggregate over the period, particularly in the Developed strategy which continues to benefit from a focused marketing strategy and excellent long term investment results.
In addition, we have to date received notification of $110 million net inflows in aggregate across all strategies, which we expect to fund over the next quarter.
With regards to business development, the Group continues to maintain an active pipeline across all of its major CEF offerings with an increased interest in the diversification CEF strategies. In total the active pipeline is in excess of US$400 million, these include opportunities that are spread across Emerging and Developed Markets, Global Tactical Asset Allocation, Tactical Income, and Frontier CEF strategies.
Operations
The Group’s income currently accrues at a weighted average rate of approximately 82 basis points of FuM, net of third party commissions. “Fixed” costs are c£1.0 million per month, and accordingly the current run-rate for operating profit, before profit-share of 30% and an estimated EIP charge of 2%, is approximately £1.7 million per month based upon current FuM and a US$/£ exchange rate of US$1.35 to £1 as at 31 December 2017.
The Group estimates the unaudited profit before taxation for the six months ended 31 December 2017 to be approximately £6.6 million, which compares with £5.8 million for the equivalent period to 31 December 2016.
The Company is currently in a close period which will end with the publication of results for the six months ended 31 December 2017 on 19 February 2018.
Dividend
The Board has decided to declare an interim dividend of 9 pence (2017: 8 pence). The dividend will be paid on 16 March 2018 to shareholders registered at the close of business on 2 March 2018.
————————————————————————————————————————————
My earlier Comment had already identified funds under management (FUM) had reached $5.3bn.
However, today’s statement is the first I can recall where CLIG has divulged the breakdown of its asset classes and the associated performances. Usually these details are tucked away in the annual report — if they are disclosed at all.
Net inflow of FUM was $62m during the half — some way below CLIG’s projection. More on that in a minute.
I see CLIG declared:
“The Group’s income currently accrues at a weighted average rate of approximately 82 basis points of FuM”
The group’s update in October said the average rate was 84 basis points, so there has been further pressure on client fees. Updates prior to that had indicated 85 or 86 basis points.
The anticipated £6.6m H1 pre-tax profit looks about right. When I studied CLIG’s annual results, I guessed earnings were running at £9.2m. In the Comment above I guessed £10.5m. The average of the two is £9.85m, which before 25% tax is £13.1m.
I am pleased the interim dividend has been lifted a penny to 9p per share. My earnings guesses of late had been close to 40p per share, which would leave (relatively) ample room to raise the full-year 25p per share payout. (CLIG’s dividend cover between 2013 and 2016 averaged only 1.0x).
Here is the second part of the text:
————————————————————————————————————————————
Template
Please see the attached graph which is based on the following assumptions and includes the estimated quarterly cost of a maintained dividend:
Key assumptions:
(June 2017 comparatives in Italics)
· Starting point Current FuM (end December 2017)
· Net increase for the remainder of this financial year (straight-lined to June 2018):
– emerging market CEF strategy US$100m (US$250m over full year)
– non-emerging market CEF strategies US$125 (US$250m over full year)
· Net increase in 2018/2019 (straight-lined to June 2019):
– emerging market CEF strategy US$100m
– non-emerging market CEF strategies US$250m
· Operating margin adjusted monthly for change in product mix and commission run-off
· Market growth: 0%
· Overheads for 2017/18: +4% compared to 2016/17 (+3%)
· Overheads for 2018/19: +7% compared to 2016/17
· EIP cost for 2017/18: 2% of operating profit (2%)
· EIP cost for 2018/19: 4% of operating profit
· Corporation tax based on an estimated average rate of 23% (23%)
· Exchange rate assumed to be £1/$1.35 for entire period (£1/US$1.30)
· Number of CLIG Shares in issue (26.9m) less those held by the ESOP Trust (1.4m) as at 31 December (26.9m CLIG shares in issue less 1.5m ESOP Trust holding)
————————————————————————————————————————————
I suppose I should applaud CLIG for continuing to publish these templates. However, I don’t take much notice of them as they have always tended to project optimistic levels of FUM.
The latest template reckons the Emerging Market strategy can rake an extra $100m FUM during H2, despite losing $89m during H1. Back in July, CLIG was indicating the Emerging Market strategy could garner $250m for the year as a whole.
More realistically, the latest template reckons the other strategies can rake an extra $125m FUM during H2, after garnering $151m during H1. These strategies look on target to receive the $250m CLIG expected back in July.
The template above includes CLIG’s first guess for 2018/19 — which includes collecting a further $350m of FUM. I also see the Employee Incentive Plan (EIP) is now expected to increase from 2% to pinch 4% of operating profit. Other overheads are expected to climb 7%. I just hope FUM does improve to cover the rising staff wages.
The cited tax rate continues to be 23%, although I have used 25% for my recent sums as that was the underlying rate for 2017. I trust CLIG’s next results will shed some light on exactly what tax is being paid.
Using the FUM/FX table in the Blog post, I calculate CLIG’s earnings come to £10.61m, or 39.5p per share, with FUM at $5.3bn, an EIP charge at 4%, tax at 23% and £1:$1.38,
I will fine-tune my sums if a presentation appears at: http://citlon.com/shareholders/share_reports.php for further details.
EDIT 19 Jan 2018: So a presentation did appear, and I have published a new Blog post.
Maynard