29 September 2023
By Maynard Paton
FY 2023 results summary for S & U (SUS):
- A seemingly lower-than-normal bad-debt charge underpinned a very positive FY, which compounded net asset value (NAV) to a fresh £18.51 per share high and the dividend to a fresh 133p per share high.
- New “A Gold” borrowers, rising used-car prices, bumper application numbers, “excellent” collection rates and waning pandemic issues led to healthy motor-finance progress, with a net loan book up 18%.
- A “sparkling” property-finance performance witnessed a 78% net loan-book surge and impairments kept to a minimum, although the division’s returns on capital remain very modest.
- Higher interest rates will hurt near-term margins and slow NAV growth, but debt costs remain amply covered by the estimated 20%-plus returns earned through the group’s most reliable customers.
- Post-results updates acknowledging reduced lending and “economic headwinds” leave the £22 shares trading at a possible 1.15x NAV and supplying a useful 6% income. I continue to hold.
Contents
- News links, share data and disclosure
- Why I own SUS
- Results summary
- Revenue, profit, net asset value and dividend
- Advantage Finance: Loans
- Advantage Finance: New loans and first payments
- Advantage Finance: Collections
- Advantage Finance: Overdue accounts and payment holidays
- Advantage Finance: Provisions
- Aspen Bridging
- Financials: Cash flow and debt
- Financials: Returns on capital employed, loan capital and equity
- Financials: Employees and margin
- Valuation
News links, share data and disclosure
- Annual results, presentation and webinar for the twelve months to 31 January 2023 published/hosted 28 March 2023
- AGM trading update published 25 May 2023
- Trading statement published 10 August 2023
Share price: 2,200p
Share count: 12,150,760
Market capitalisation: £267m
Disclosure: Maynard owns shares in S & U. This blog post contains SharePad affiliate links.
Why I own SUS

- Provides ‘non-prime’ credit to used-car buyers and property developers, where disciplined lending and reliable service have supported an illustrious NAV and dividend record.
- Boasts veteran family management with a 40-year-plus tenure, 42%-plus/£111m-plus shareholding and a “steady, sustainable” and organic approach to long-term expansion.
- Higher-quality borrowers, bumper application numbers, rising used-car prices and tighter lending criteria offer the prospect of resilient group progress during a potential difficult economy.
Further reading: My SUS Buy report | All my SUS posts | SUS website
Results summary
Revenue, profit, net asset value and dividend
“S&U continues to trade well despite a period of economic and political chaos unprecedented in most of our lifetimes. A change of government and of economic strategy, rising inflation, taxation and interest rates and an incipient recession is not exactly the ideal economic landscape for any business.
Nevertheless, trading is very good, focusing on the excellent quality of our customer relationships and the receivables which we derive from them. These receivables have now reached a net c£404m, against £370m at the half year end with continued good collections and profitability during the period.”
- …followed by upbeat commentary during February…
“Current trading in both businesses, Advantage, our motor finance lender, and Aspen , our property bridging lender, remains excellent. This will be reflected in the full year’s results which are expected to both meet expectations and exceed budget.
- …had already forecast a very positive FY 2023.
- As heralded within February’s statement, this FY did indeed show net receivables at c£420m and net debt at £192m.
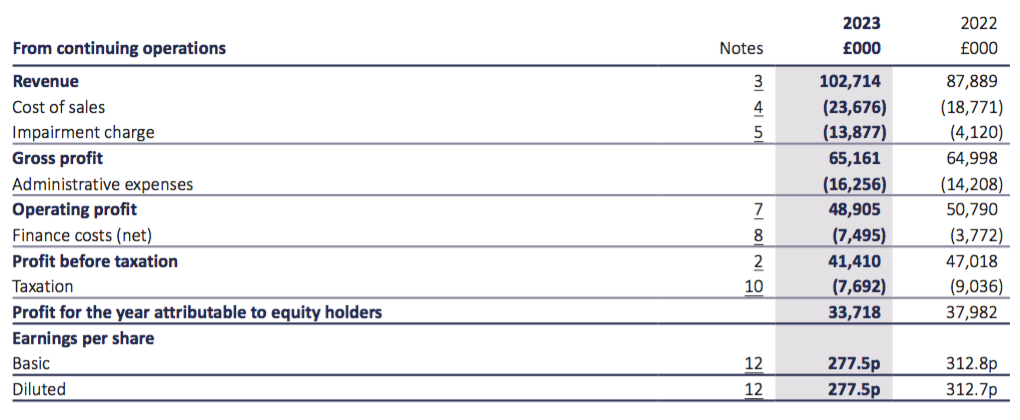
- Revenue improved 17% to £103m to set a new FY record:
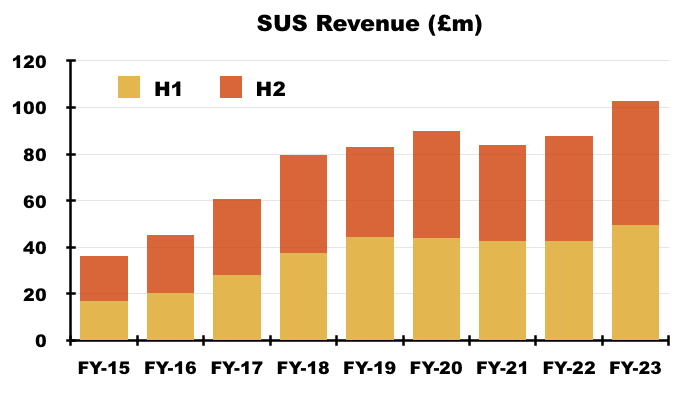
- H2 revenue advanced 18% to £53m to set a new record for any H1 or H2.
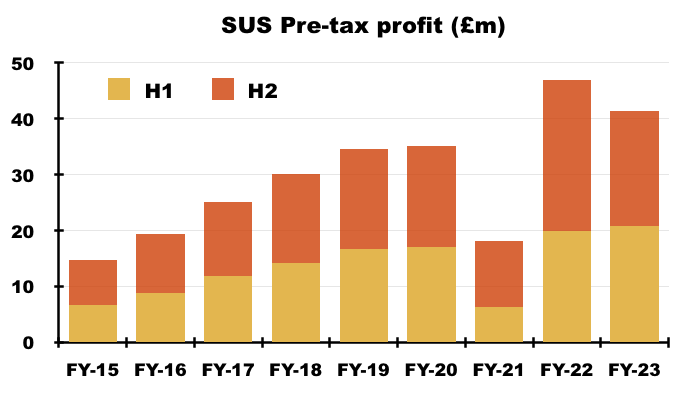
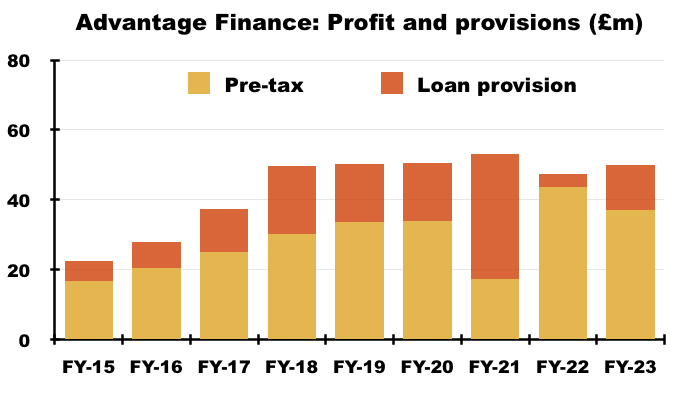
- Pre-tax profit meanwhile slipped 12% to £41m:
- The lower profit followed significant fluctuations to the bad-debt impairment charge within SUS’s motor-loan subsidiary Advantage Finance (see Advantage Finance: Provisions).
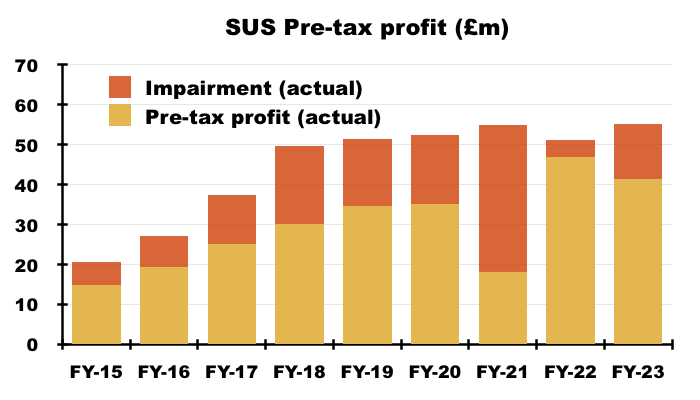
- To recap, FY 2021 suffered an additional Covid-related loan provision of £20m, while FY 2022’s entire provision was only £4m after better-than-anticipated collections prompted a significant reversal of that extra £20m:
- Management’s FY webinar revealed FY 2021 with hindsight ought to have provided “roughly” an extra £5m — rather than £20m — for additional Covid-related bad debts for that year.
- As such, the bad-debt impairment for the comparable FY 2022 with hindsight ought to have been approximately £15m greater at £19m…
- … and therefore FY 2022 pre-tax profit with hindsight ought to have been approximately £15m lower at £32m:
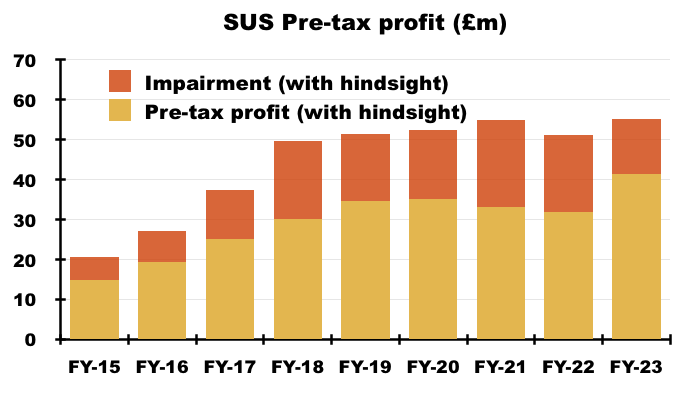
- Pre-tax profit for this FY may therefore have gained 29% based on FY 2021 applying the £5m with-hindsight Covid impairment and FY 2022 then experiencing no Covid-impairment reversals.
- Note that management’s FY webinar also claimed this FY’s £14m total impairment charge was not flattered by further reversals of the original £20m Covid-related write-offs.
- Prior to the pandemic, SUS’s impairment charge was approximately £17m a year and the group explained this FY’s £14m impairment was due to all-round “careful, experienced and watchful underwriting“.
- SUS compared this FY’s profit performance to the average of FYs 2021 and 2022:
“Despite the maelstrom of a European war, political upheaval in Britain and rising inflation, taxation and interest rates, S&U has produced profit before tax of £41.4m, fully 27% up on the average of the last two pandemic years, and the highest ‘normalised’ profit in its over eighty-year history.“
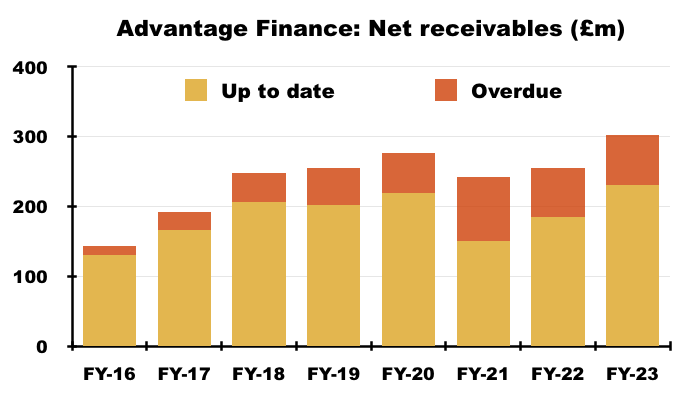
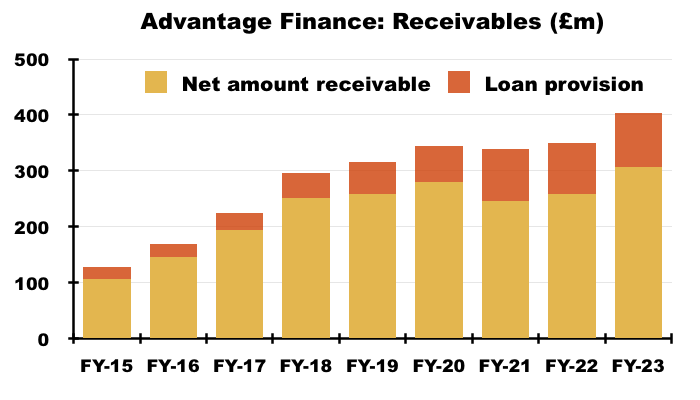
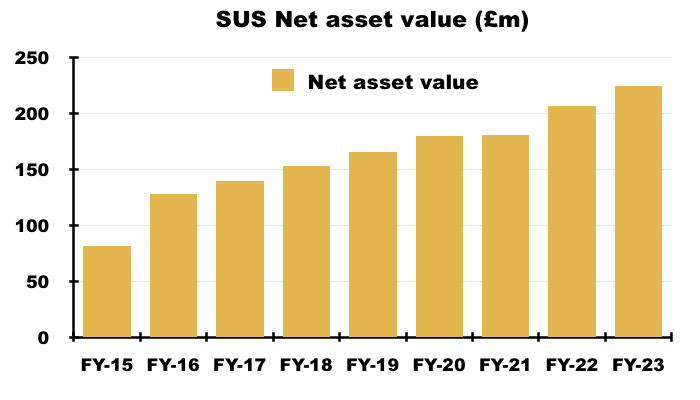
- The accounts continue to be dominated by Advantage Finance, although SUS’s property-loan division, Aspen Bridging, is becoming a greater part of the group:
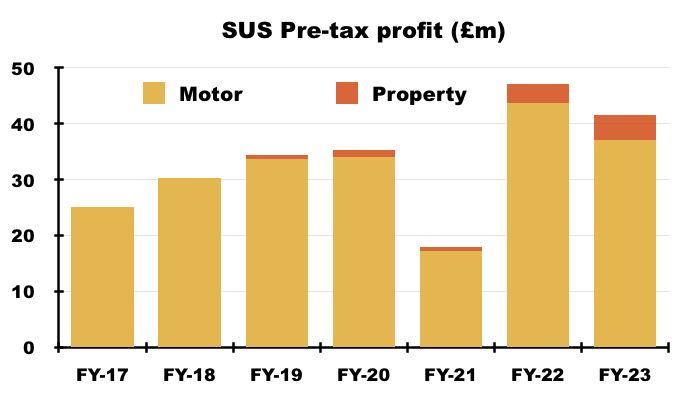
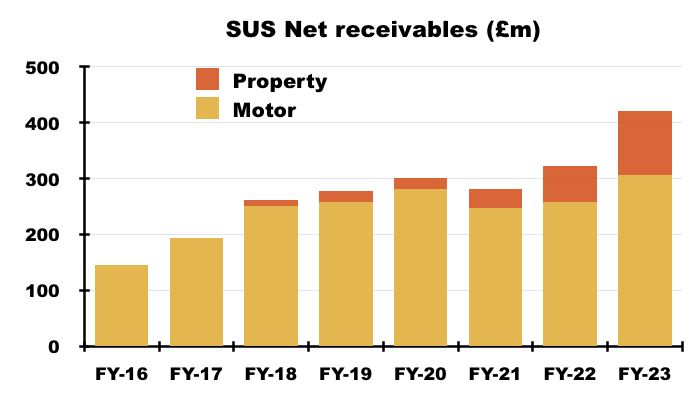
- This FY witnessed the net motor-loan book advance a healthy 18% to £307m and the net property-loan book surge a bumper 78% to £114m.
- Factor in extra debt, and the larger loan books increased net asset value (NAV) by £18m to £225m — equivalent to £18.51 per share and a fresh NAV record. H2 added an extra £13m or £1.02 per share.
- NAV per share has gained 45% during the last five years and supports 84% of the £22 share price (see Valuation):

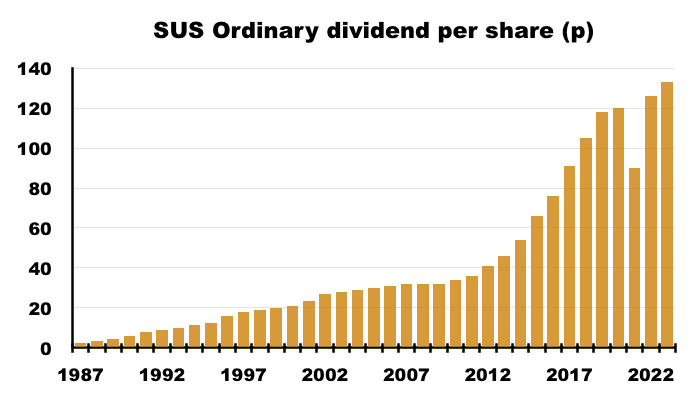
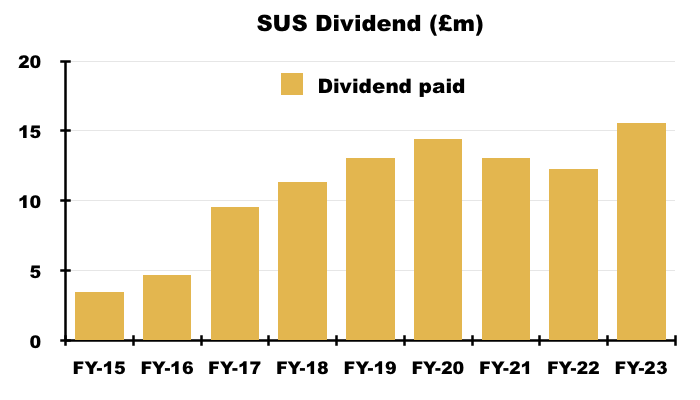
- The profit outcome prompted the final dividend to be lifted 5% to 60p per share, which took the full-year payout to a record 133p per share.
- Companies House shows the payout expanding 53-fold since 1987, with the sole reduction occurring during pandemic-blighted FY 2021:
Advantage Finance: Loans
- SUS describes Advantage Finance customers as ‘non-prime’ and the 2023 annual report outlines their typical circumstances:
“This long experience has enabled Advantage to gain a significant understanding of the kind of simple hire purchase motor finance suitable for customers in lower and middle-income groups. Although decent, hardworking and well intentioned, some of these customers may have impaired credit records, which have seen them in the past unable to access rigid and inflexible “mainstream” finance products.”
- Loan sizes have increased over time. The average amount borrowed surpassed £5k during FY 2012, £6k during FY 2015, £7k during FY 2022 and reached £7.8k during this FY:
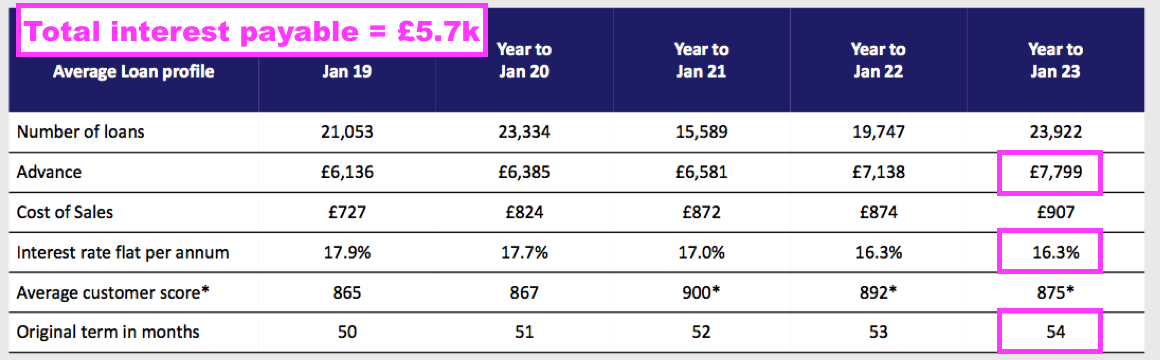
- Management’s FY webinar said this FY’s greater loan size reflected rising used-vehicle prices and additional higher-quality customers, “who tend to borrow more money“.
- SUS said the average used-car price was advancing at 3% a year and had almost doubled since 2012:
“Whilst prices rose year on year by 11% to mid-2022, as supply increased this rise is now around 3% per annum. Indeed the average price of a used car has risen from £9,000 in 2011 to £17,600 in 2022.“
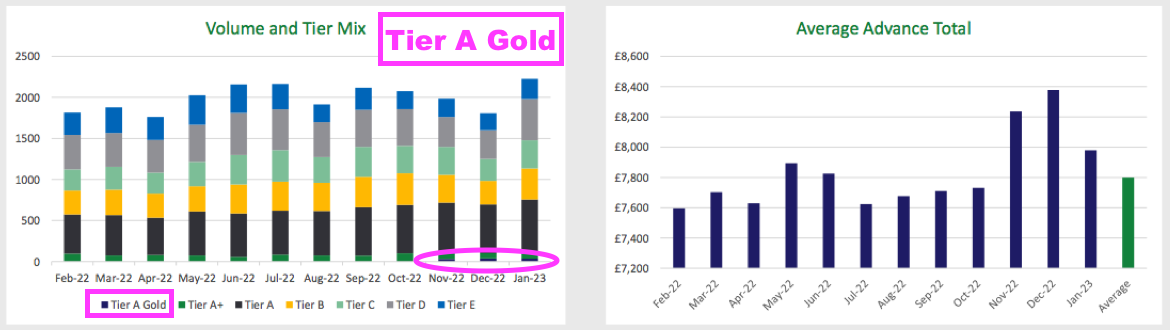
- Advantage’s higher-quality customers were reflected by SUS introducing a new “A Gold” tier for this FY:
- These “A Gold” borrowers appear to have been rejected by high-street banks:
“Moreover, as was seen in 2007–2009 in the “Great Financial Crisis”, near prime customers are being rationed and restricted by “mainstream” finance providers, enabling Advantage to attract them at sensible rates of return.“
- Reflecting the higher-quality customers, the flat 16.3% interest rate charged by Advantage during this FY matched the 16.3% charged during FY 2022 — and remained the lowest rate charged for at least twelve years:
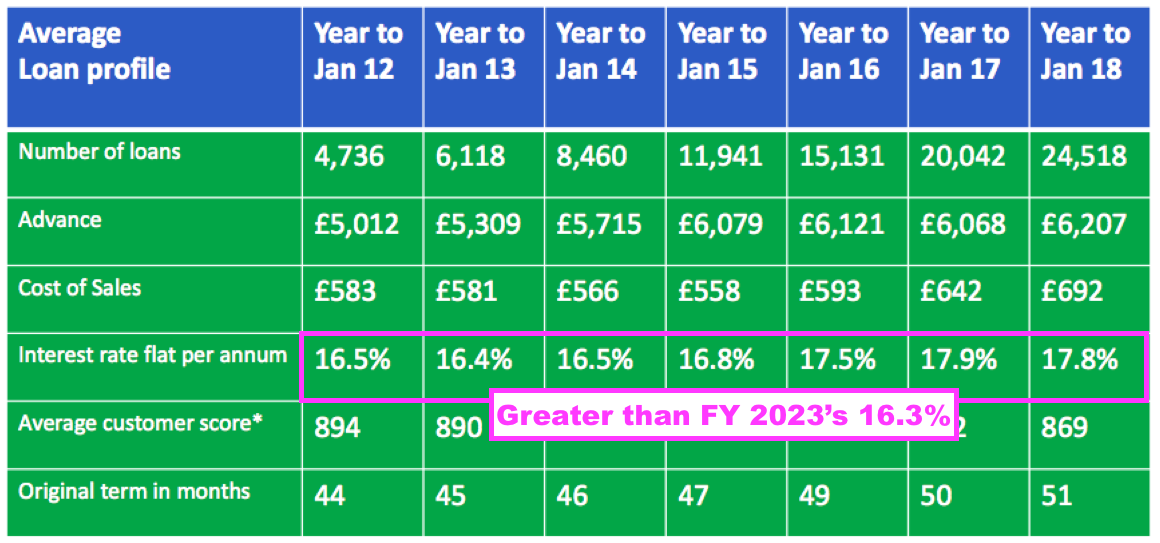
- The duration of the typical loan continues to increase. The 54 months for this FY compares to 50 for FY 2017 and 44 for FY 2012.
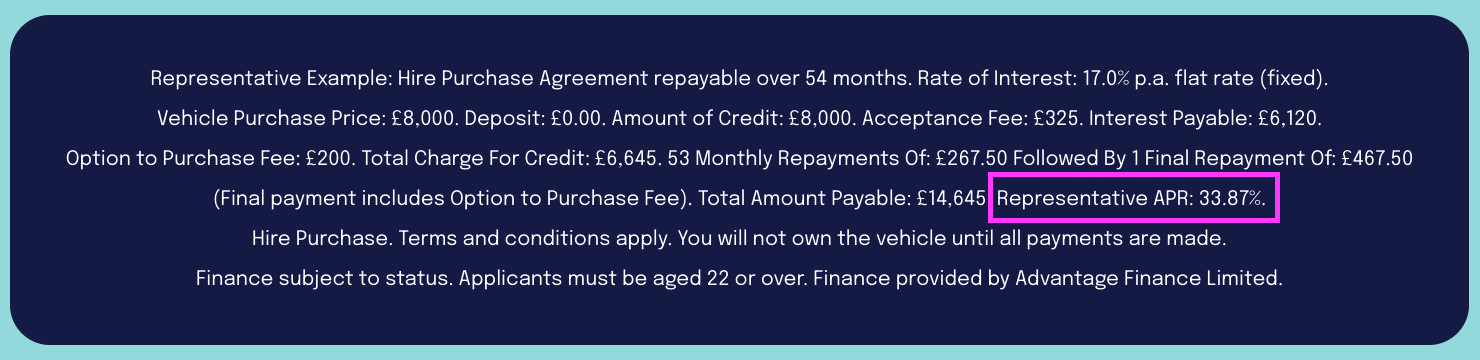
- Borrowing £7.8k at a flat 16.3% a year over 54 months leads to interest of £5.7k and a total repayable of £13.5k before administration and other fees.
Advantage Finance: New loans and first payments
- The 23,922 motor loans issued during this FY were Advantage’s highest bar FY 2018 (24,518):
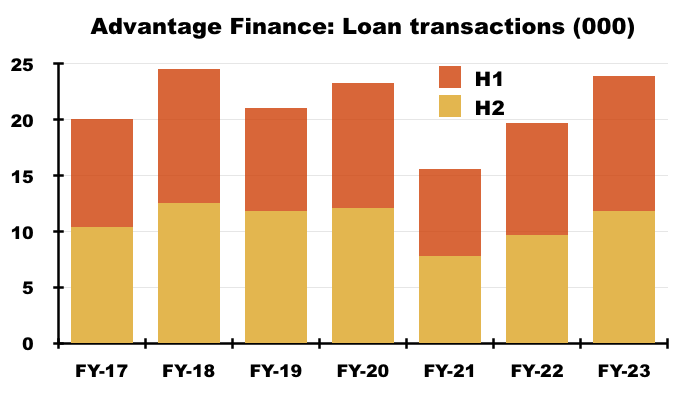
- The 12,122 new loans issued during H2 were a H2 record and only 420 short of beating the record H1 2018 (12,542).
- SUS confirmed no shortage of loan applications:
“Whilst in 2012 just 23% of used car sales were on finance, this is now 45% (Autotrader). The number of people searching for online finance is up 28% on pre-pandemic levels. Although transactions in 2022 have not yet reached pre-Covid levels, the market remains buoyant. This is most graphically illustrated at Advantage where loan applications have reached over 2.5m for the first time this year. “
- 2.5 million applications compares to over 1 million applications received during FY 2019 and 500,000 received during FY 2016.
- 90% of loans continue to be sourced through brokers. Cost of sales per loan (largely commissions to brokers) at £907 equated to 11.6% of the £7.8k average loan and was the lowest proportion since FY 2018 (11.1%):
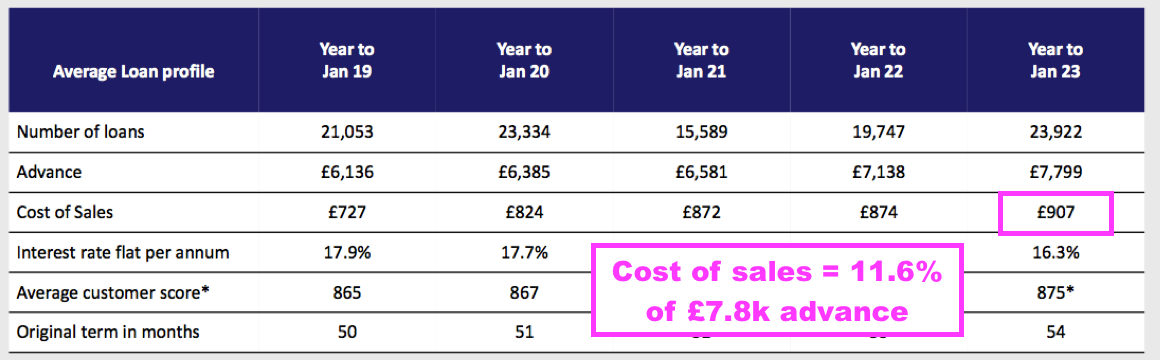
- Issuing 23,922 loans from 2.5 million applications equates to less than a 1% conversion rate, which underpins the notion of very selective lending and Advantage’s claims of “intelligent underwriting” and a “habitually conservative Credit Committee“.
- The 23,922 new loans issued during this FY were offset by 20,730 accounts closed due to completed repayments, voluntary terminations or the commencement of legal proceedings:
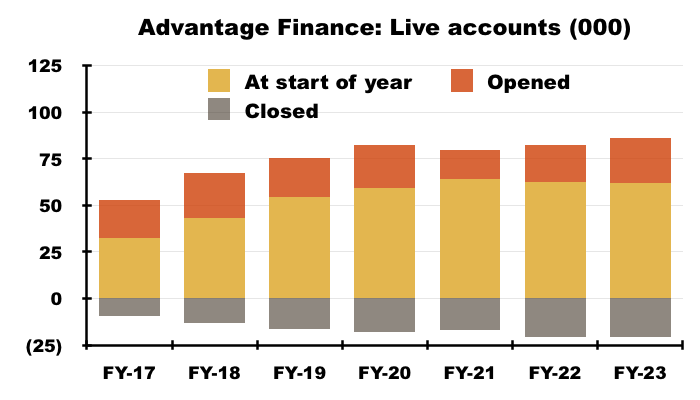
- The account openings and closures left total ‘live’ accounts up 3,192 at 65,223, with 2,217 added during H2:
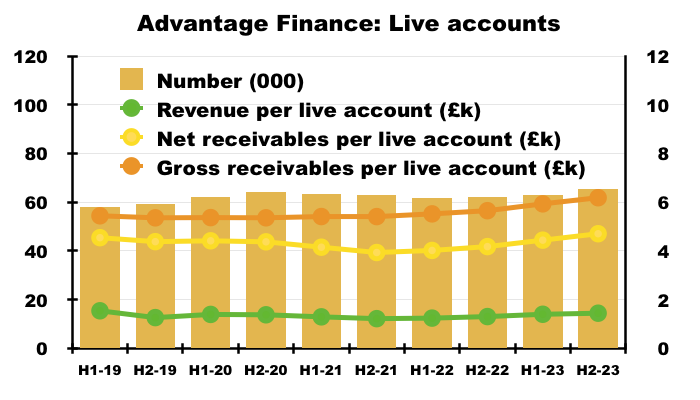
- The aforementioned higher loan sizes translated into revenue per account increasing to approximately £1.4k (the highest since FY 2019), with the average amount outstanding (before provisions) now at a new £6.2k high and the average amount outstanding (after provisions) at a new £4.7k high.
- Advantage’s first-payment statistics remain within levels witnessed before the pandemic:
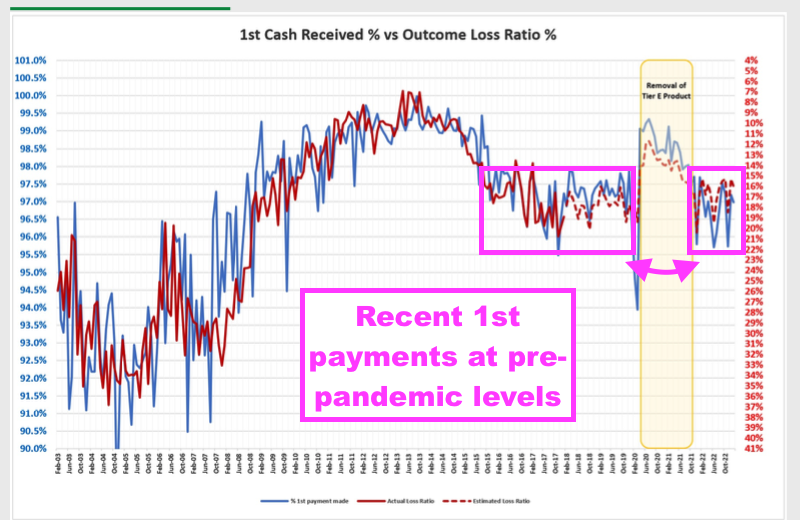
- The blue line (left axis) reflects the percentage of new customers making their first payment on time.
- The proportion at between 95.5% and 97.5% during this FY was enjoyed between (pre-pandemic) October 2015 and October 2019.
- The 98%-plus first-time payments achieved during 2020 and 2021 were due to the stringent lending applied as Covid-19 struck.
Advantage Finance: Collections
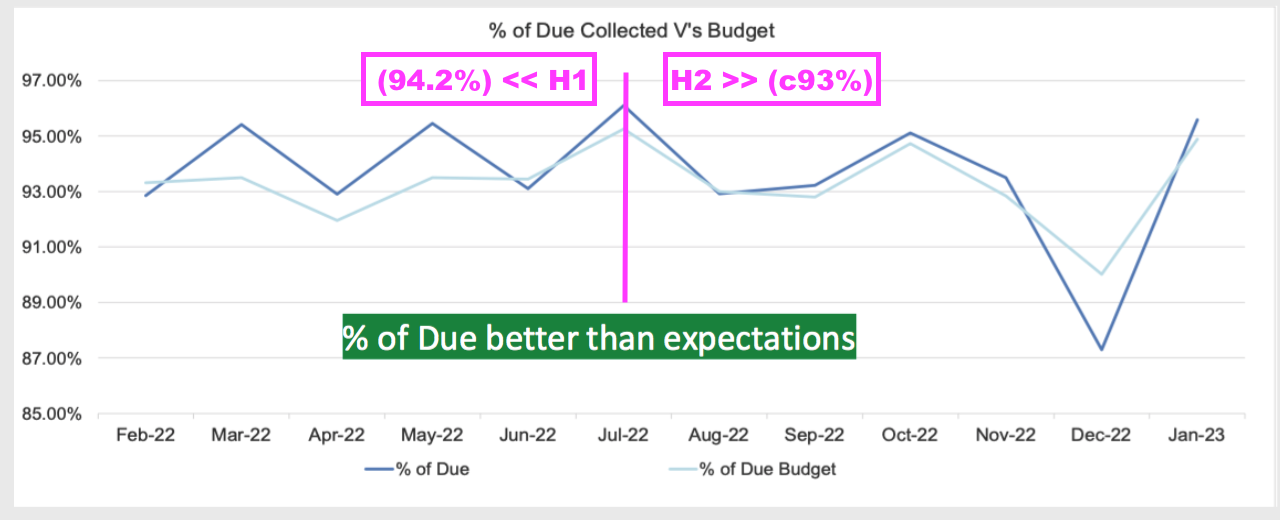
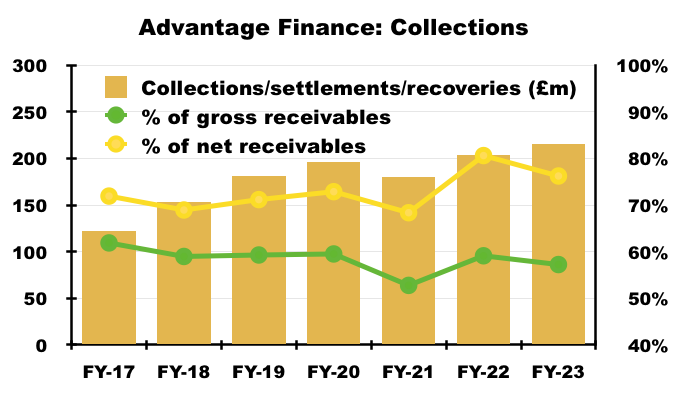
- SUS said Advantage’s collections during this FY were “excellent” and ahead of budget:
“In collections Advantage had an excellent year producing live repayments at a record £161.8m (2022: £152.7m). Advantage’s collections as a percentage of due reached 93.6% which beat both budget and last year.”
- Collections at 93.6% of due compares to 93.2% for FY 2022, 83.3% for FY 2021 and 93.5% for (pre-pandemic) FY 2020.
- Mind you, collections were 94.2% of due during H1 which implies collections were lower at approximately 93% during H2:
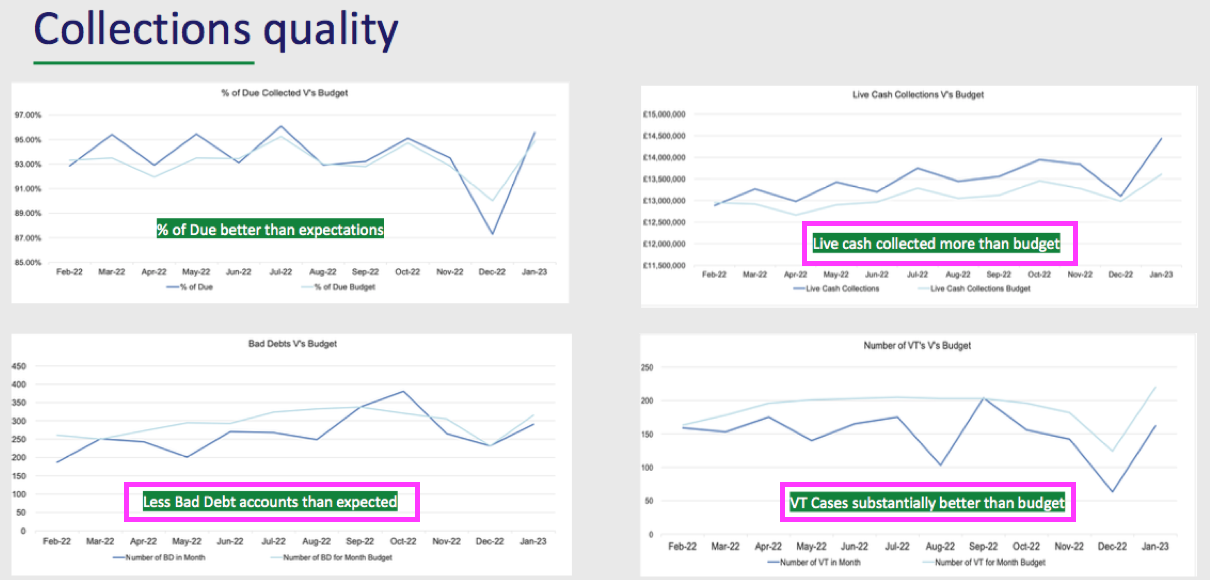
- Similar to the collection performance, the amount of cash collected, the number of bad debts incurred and the number of voluntary terminations handled were all better than expected:
- Collections, settlements and recoveries for this FY amounted to £216m, up 6% on the comparable FY 2022 and split evenly between H1 and H2:
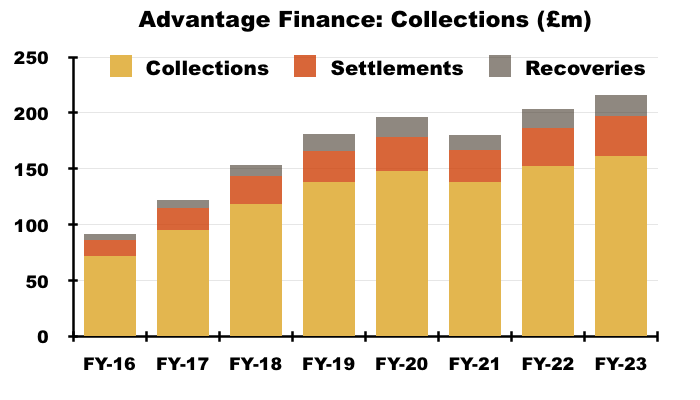
- Collections, settlements and recoveries as a proportion of gross receivables (i.e. loans before provisions) and net receivables (i.e. loans after provisions) were 57% and 76% respectively, and broadly matched pre-pandemic norms:
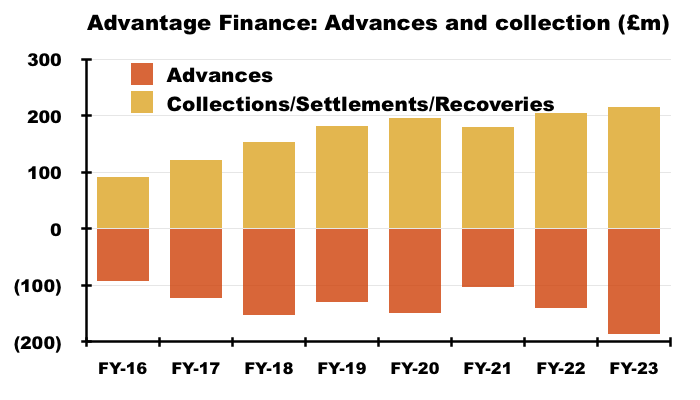
- Collections, settlements and recoveries continue to surpass the amounts used to fund new motor loans:
- Advantage’s estimates of future collections have been revised slightly:
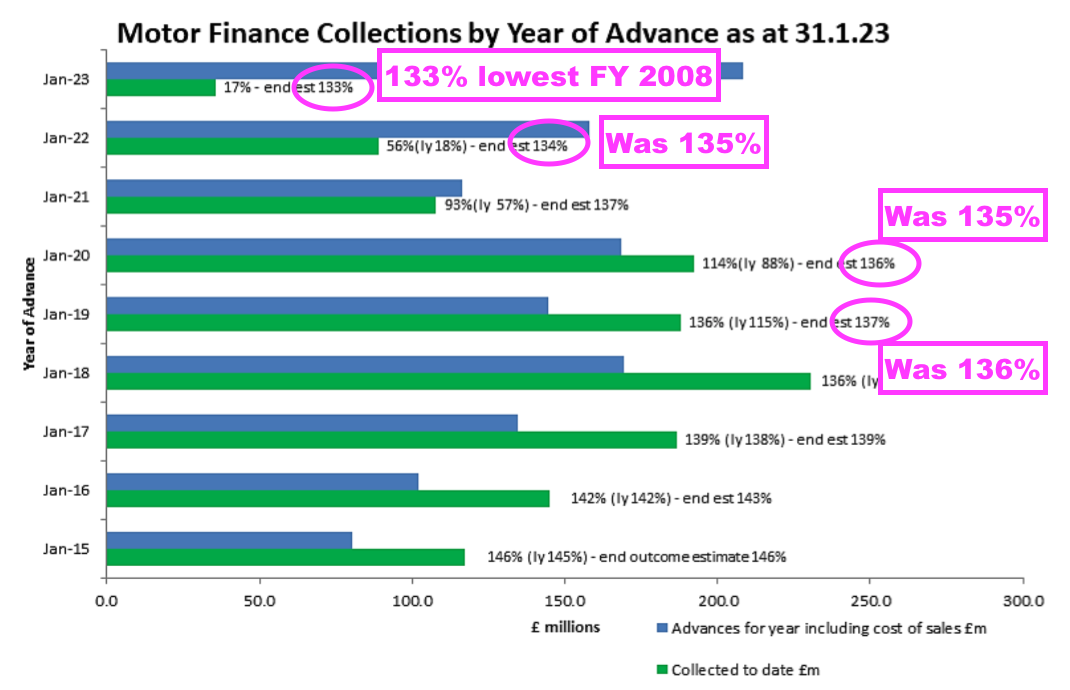
- The payback percentage of loans has deteriorated over time. Collecting between 133% and 136% of the original loan remains some way off the 150%-plus collected for money lent between FYs 2010 and 2014:
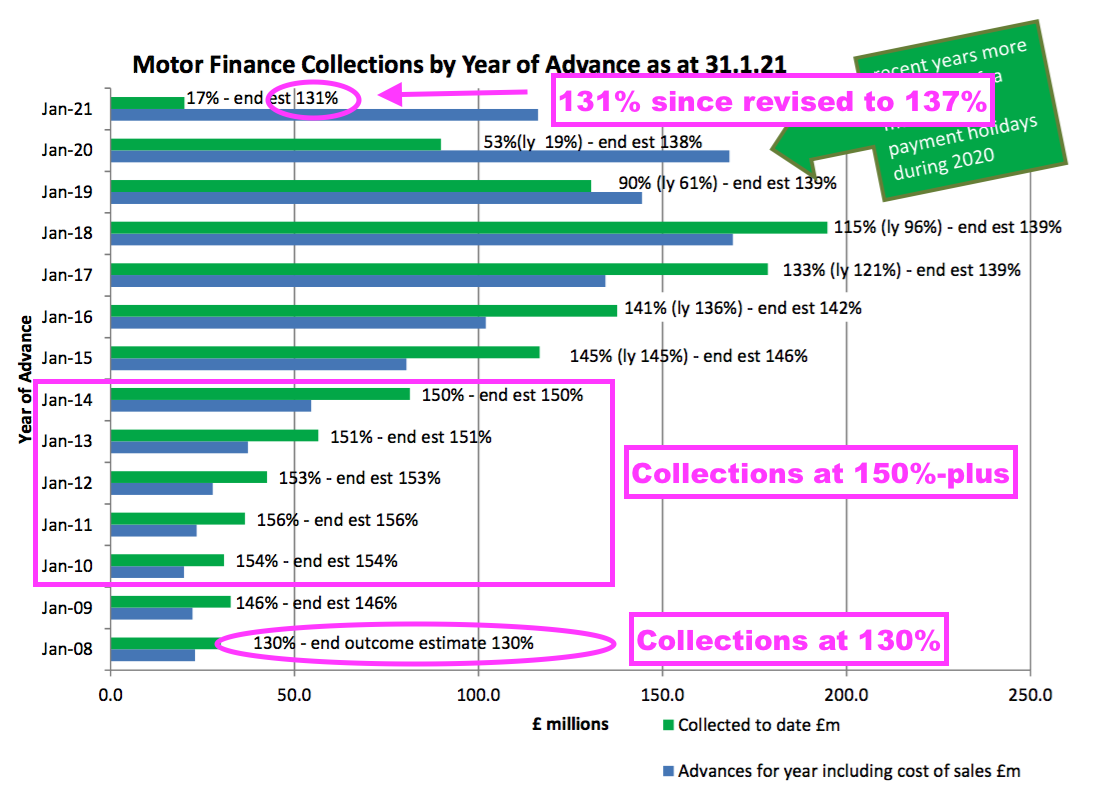
- SUS expects customers to eventually repay 133% of the loans advanced during this FY, which will be the lowest payback percentage since FY 2008 if the estimate proves accurate.
- Note that for (pandemic-blighted) FY 2021, SUS initially estimated a 131% payback percentage for that year’s loans… which has since been uplifted to 137%.
- I am hopeful SUS is once again ‘under-promising’ for an ‘over-delivery’, although the downward trend of the payback percentage — especially post-pandemic — does appear awkward.
- Potential explanations for a 133% estimated payback include:
- Worries about an uncertain economy and collection rates, and;
- Lower interest being paid by a greater proportion of (higher-quality) borrowers.
- Management’s FY webinar sadly did not refer to the payback percentage’s downward trend.
Advantage Finance: Overdue accounts and payment holidays
- 76% of Advantage’s loans boasted up-to-date repayments at the end of this FY:
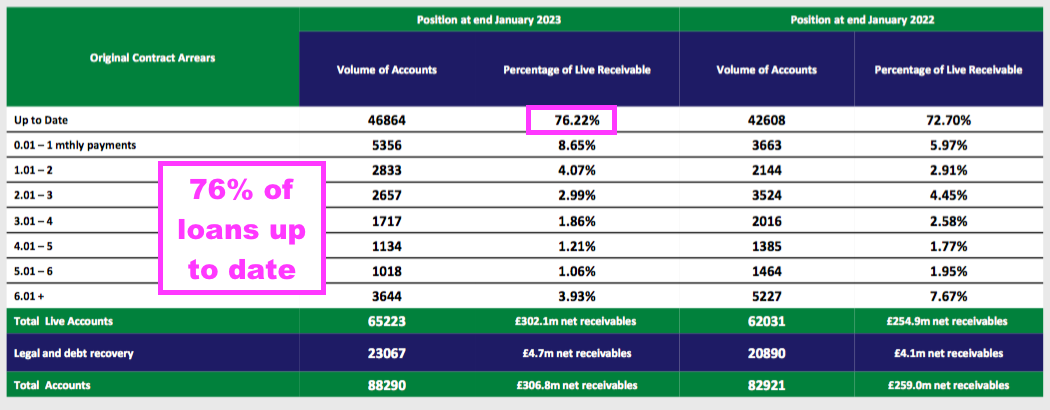
- The up-to-date 76% remains skewed by customers that enjoyed an FCA-authorised payment holiday during the pandemic.
- Payment holidays lasted up to six months and all payment holidays ended on 31 July 2021.
- SUS deems customers that took a payment holiday as ‘overdue’, even if they have repaid as normal following their payment holiday.
- The 76% improves on the 62% for FY 2021 and 69% for FY 2022:
- But the up-to-date proportion was 79% for FYs 2019 and 2020, topped 80% for FYs 2017 and 2018, and reached a super 91% for FY 2016.
- 7,843 payment-holiday customers were still active at the end of this FY, versus a peak of 18,768 at the end of FY 2021:
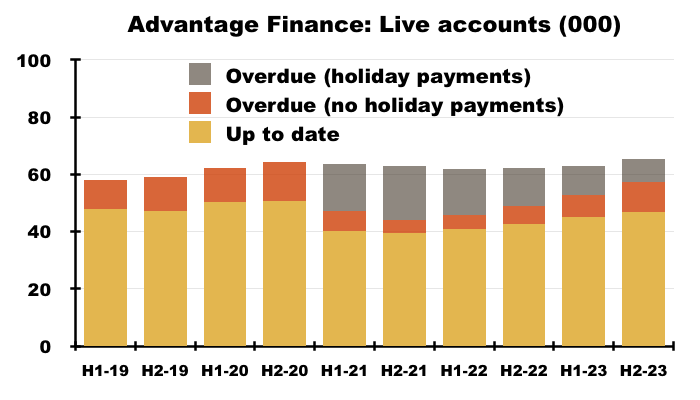
- 5,375 payment-holiday customers cleared their accounts (one way or another) during this FY, with 2,502 disappearing during H2. Payment-holiday customers may therefore have all vanished from the loan book within 18 months.
- SUS no longer discloses detailed payment-holiday statistics, although did divulge payment-holiday accounts represented 6.2% of loans before provisions — equivalent to £25m. SUS had previously never disclosed the total amount owed by payment-holiday accounts.
- Payment-holiday accounts were paying 95% of due during the preceding H1 2023 and 97% of due during the comparable FY 2022, suggesting the remaining 7,843 payment-holiday accounts ought not to be too troublesome with their repayments.
- Bolstered perhaps by higher-quality “A Gold” borrowers, the average loan outstanding at up-to-date accounts is now £1k greater than the average loan outstanding at overdue accounts:

Advantage Finance: Provisions
- SUS’s loan provisions are classified as:
- Stage 1, which reflects expected write-offs from newly opened accounts (i.e. accounts without any history of arrears);
- Stage 2, which reflects expected write-offs from accounts not in arrears but which experience “some form of forbearance” that creates a higher credit risk (e.g. accounts that enjoyed an FCA-mandated payment holiday due to the pandemic), and;
- Stage 3, which reflects expected write-offs from accounts one month or more in arrears.
- Advantage’s total bad-debt provision increased by £5m to £96m:
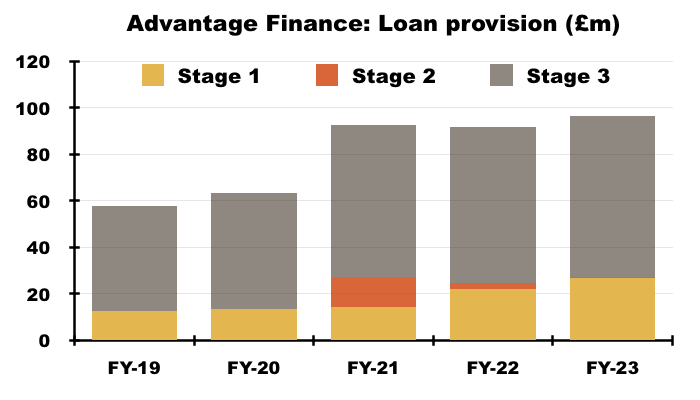
- Stage 1 provisions represented 28% of all provisions versus 21-22% for pre-pandemic FYs 2019 and 2020, which may suggest new loans are more likely to fall into arrears.
- Mind you, Stage 3 provisions represented 72% of all provisions versus 78-79% for pre-pandemic FYs 2019 and 2020, which indicates a lower proportion of loans actually in arrears.
- The £96m bad-debt provision was equivalent to 24% of the total £403m lent originally and still outstanding:
- The proportions for FYs 2021 and 2022 were 27% and 26% respectively.
- For pre-pandemic FYs 2019 and 2020, though, Advantage’s provisions ran at 18% of total money lent. But Advantage’s provisions did touch 30% during FY 2012.
- Lending £403m and providing for £96m means Advantage expects to receive 76p of capital for every £1 currently loaned.
- The 24% proportion of bad debt justifies the aforementioned 16.3% flat-rate interest that ensures a suitable overall return from capital lent (see Financials: returns on capital employed, loan capital and equity)
- The proportion of bad debt reducing from 26% to 24% for this FY reflects Advantage lending an extra £53m versus the total loan provision increasing by only £5m.
- A few more years of lending £53m and increasing the total loan provision by only £5m (c9% of that £53m) would be very welcome.
- The last time Advantage’s total loan provision increased by less than 10% of the additional loans was FY 2016 (£3m versus £42m, or 7%).
- Advantage charged a £13m motor-loan provision against earnings that compared to £17m during pre-pandemic FYs 2019 and 2021:
- The difference between the £13m earnings provision and the £5m added to the total provision effectively represents £8m of past provisions utilised during this FY (i.e. loans written down to zero).
- Management’s FY webinar said the £13m earnings provision was not influenced by reversing the additional Covid-19 provisions made during FY 2021 (see Revenue, profit, net asset value and dividend).
- However, SUS did admit the £13m provision was “still lower than normal” after “increase[s] in stage 1 and macroeconomic overlays for forecast future inflation and car prices [were] more than offset by excellent collections and lower than anticipated realised bad debts“.
- The “macroeconomic overlays” refer to IFRS 9 calculations that estimate expected losses, which the accounting notes acknowledge are derived with a “more heightened risk of an adverse economic environment“:
“As required under IFRS9 the expected impact of movements in the macroeconomy is also reflected in the expected loss model calculations. For motor finance, assessments are made to identify the correlation of the level of impairment provision with forward looking external data regarding forecast future levels of employment, inflation, interest rates and used car values which may affect the customers’ future propensity to repay their loan.
The macroeconomic overlay assessments for 31 January 2023 reflect that further to considering such external macroeconomic forecast data, management have judged that there is currently a more heightened risk of an adverse economic environment for our customers and the value of our motor finance security.
To factor in such uncertainties, management has included an overlay for certain groups of assets to reflect this macroeconomic outlook, based on estimated unemployment, inflation and used vehicle price levels in future periods.
- The accounting notes disclosed new text (requested by the FRC) about vehicle prices that SUS acknowledged unfavourably influenced the £96m provision calculation:
“Used vehicle price overlay and sensitivity for our motor finance business
Our used vehicle price overlay is based on used vehicle guide price information and the mileage and condition of each vehicle is estimated which is uncertain. It is also based on an uncertain assumption at 31.1.23 that used car prices which increased significantly in 2021 and 2022 will fall by 13.5%. This used vehicle price overlay has increased loan loss provisions at 31.1.23 by £6,656,000 (2022: increased provisions by £4,552,000). If used car prices were only assumed to fall by 8.5% instead, then this would result in a decrease in loan loss provisions of £2,815,718. If used car prices were assumed to fall by 18.5% instead, then this would result in a further increase in loan loss provisions of £2,717,750.”
- SUS projecting used-car prices falling 13.5% for its bad-debt calculation when also reporting used-car prices advancing 3% last year does seem very prudent.
- The aforementioned £15m Covid-19 ‘over-provision’ also suggests SUS’s bad-debt numbers are calculated very conservatively.
- The accounting notes disclosed loans in Stage 3 were made on vehicles with a “trade value” of £65m:
“Motor finance – except for loans valued at £4.658m (2022: £4.103m), where we are aware the security is no longer present, security is held on a used vehicle for each hire purchase motor finance agreement. As stated in note 1.1.13 above, valuing these used vehicles secured under our hire purchase agreements is uncertain as the condition and mileage of the used vehicle are unknown. We estimate the trade value of collateral held at 31.1.23 for motor finance loans currently in stage 3 was £64.5m (2022: £59.0m) – these estimated values are stated before taking into account recovery and disposal costs.”
- Net receivable Stage-3 loans were less than that £65m at £47m…
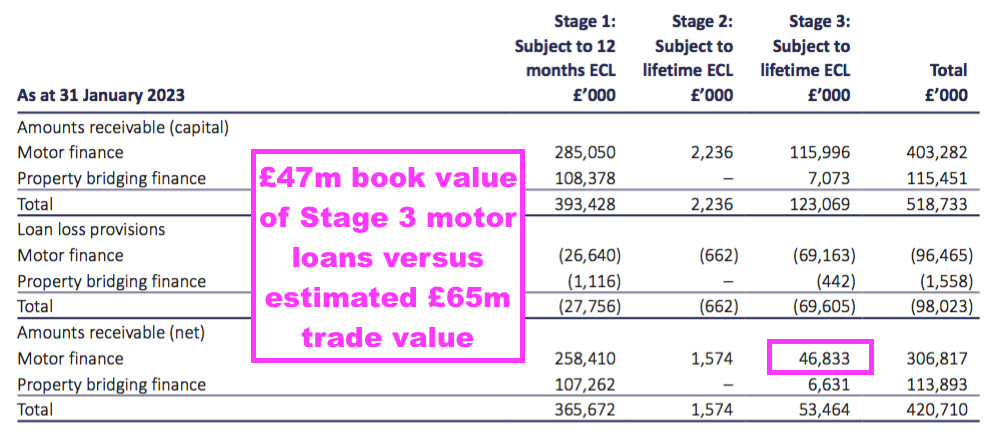
- …suggesting SUS could (if need be) repossess the Stage-3 vehicles (for £65m) and easily recoup the their Stage-3 loan-book value (of £47m).
- Unemployment and inflation expectations also influence the IFRS9 write-off sums, which will become more relevant if the economy deteriorates:
“An increase by 0.5% in the weighted average unemployment rate would result in an increase in loan loss provisions by £1,044,494. A decrease by 0.5% would result in a decrease in loan loss provisions by £1,044,494. An increase by 0.5% in the weighted average inflation rate would result in an increase in loan loss provisions by £474,770. A decrease by 0.5% would result in a decrease in loan loss provisions by £474,770.”
Aspen Bridging
- Established at the start of FY 2018, Aspen offers property bridging loans for small/individual property developers with awkward financial circumstances.
- The 2023 annual report outlined the lender’s attractions to customers:
““Mainstream” banks, including the newer “challengers”, continue to lack the speed, flexibility and appetite to furnish the smaller, short-term loans in which Aspen specialises. Recent consolidation and instability in the challenger banking sector is evidence of this and again shows that, technology, speed and a quality bespoke service – as well as price – are what give smaller entrants like Aspen their competitive edge.”.“
- Aspen’s rate card says developers borrowing against residential properties pay a flat monthly interest rate of 0.95% on a 75% loan-to-value arrangement.
- Terms have tightened notably during the last year or so. My H1 2023 review highlighted 0.84% on a 75% loan-to-value arrangement, while my FY 2022 review highlighted 0.69% on a 70% loan-to-value arrangement.
- These case studies give a flavour of the transactions involved:

- SUS described Aspen’s progress as “sparkling“:
“Aspen’s sparkling set of results benefitted from Aspen’s deliberate move towards larger, higher quality loans with experienced borrowers.“
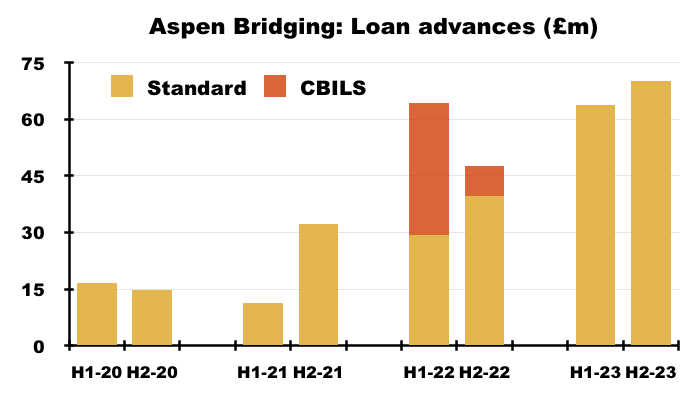
- 148 clients were advanced an average £905k for 11 months during this FY:
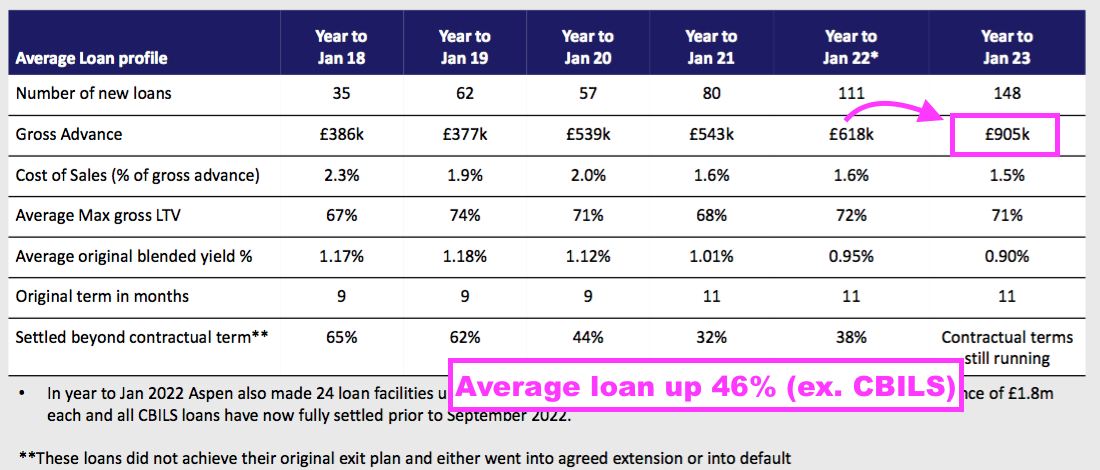
- The preceding H1 witnessed 73 loans advanced at an average £873k, indicating H2 witnessed 75 loans advanced at an average £936k.
- The £905k average represented a notable 46% increase on the £618k (excluding CBILS) average for FY 2022.
- SUS said the greater loan size reflected a repositioning that ought to “insulate the business against wider market fluctuations“:
“Aspen has repositioned towards higher quality, less mortgage-dependent borrowers and towards higher value properties. This is expected to insulate the business against wider market fluctuations. Over the past year Aspen has prudently increased its interest rates, tightened further already conservative valuations and reduced LTVs. In mid-year the average gross LTV for new business was 74%; it is now 66%.“
- 148 clients receiving an average £905k loan gave a total £134m advance, of which £70m was lent during H2:
- Aspen’s bad-debt provisions remain tiny.
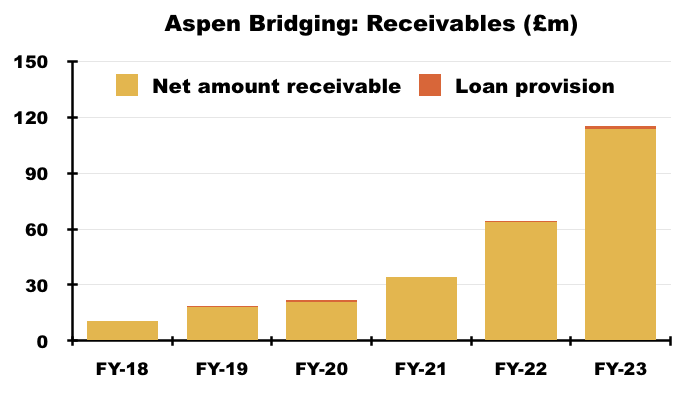
- Aspen’s loan book before bad-debt provisions advanced by £51m to £116m during this FY, while the bad-debt provision increased from £0.6m to £1.6m:
- Of the 517 loans advanced since Aspen’s formation, 376 have been repaid and only 12 of the remaining 141 are in default — but all 12 were “due to settle in Q1“.
- SUS said Aspen’s bad debts were limited due to physically inspecting properties and seeking more reliable borrowers:
“Each loan underwritten in Aspen involves secondary independent assessment and a rigorous valuation exercise including a physical inspection of the property by Aspen staff – something which is rare in the industry.“
“Aspen values its security properties very conservatively and keeps gross LTV’s to an average 70% and the business now only considers experienced borrowers from the top three quality bands.”
- Whether employees inspecting every property will eventually hamper Aspen’s growth rate and lending scale remains to be seen.
- Although simply lending greater amounts to borrowers is one way to overcome that employee-scaling issue.
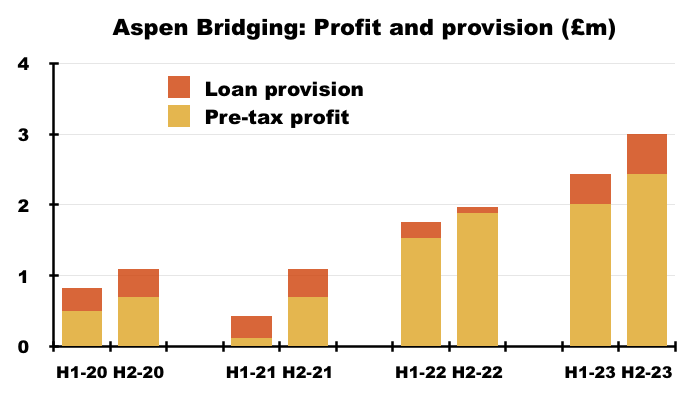
- Profit during this FY came in at £4.5m, of which £2.4m was scored during H2. Note the comparable £3.4m for FY 2022 was assisted by extra CBILS lending of £43m:
- Aspen’s loan book currently represents 24% of SUS’s entire lending (after provisions):
- SUS suggested Aspen’s future was bright:
“Aspen continues on its journey towards being a significant contributor to the future of the Group.”
- Aspen’s early years have been more profitable than Advantage’s early years.
- Advantage took more than a decade to grow from start-up (FY 2000) to report a £4m-plus pre-tax profit (FY 2011); Aspen in contrast surpassed £4m after six years.
- That said, Advantage required capital of less than £40m to reach that £4m profit, versus more than £100m for Aspen.
- I note two younger members of the controlling Coombs family have become involved with SUS through Aspen rather than Advantage:
- Jack Coombs is a main SUS board director and an Aspen director.
- Richard Coombs — a fourth generation Coombs family member — joined Aspen earlier this year.
- SUS’s lead executives — Anthony and Graham Coombs — are third-generation Coombs family members and are presently both 70 years old. I surmise their cousin Jack Coombs, 36, may well become the lead SUS/Coombs executive in years to come.
- SUS was founded by Clifford Coombs during 1938 and the Coombs family owns at least 42% (£111m) of the company.
Financials: Cash flow and debt
- This FY witnessed Advantage report a £32m cash outflow:
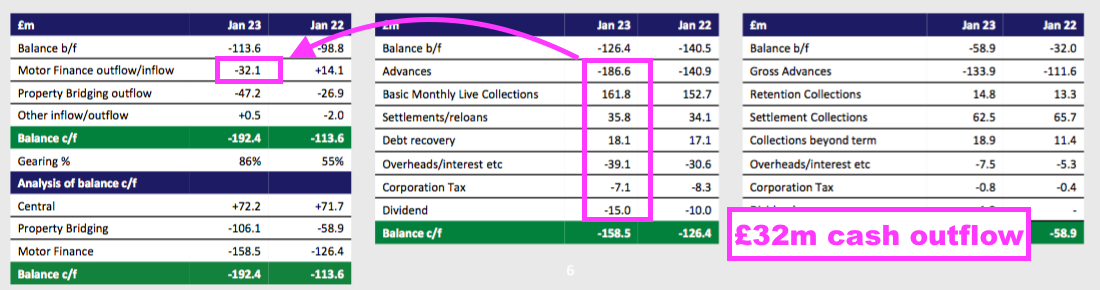
- Advantage absorbed that £32m after lending £187m, collecting £216m, expensing £46m and paying £15m as dividends to the parent company.
- That £32m outflow was Advantage’s largest since FY 2018 (£42m):
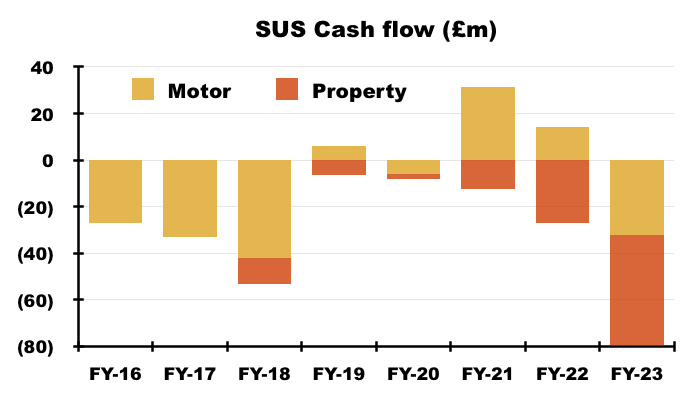
- Advantage generated surplus cash (after dividends) of £46m during FYs 2021 and 2022, of which £39m was effectively used to support Aspen’s growth.
- The extra £79m required during this FY to fund operations/dividends at Advantage (£32m) and Aspen (£47m) was covered by additional borrowings.
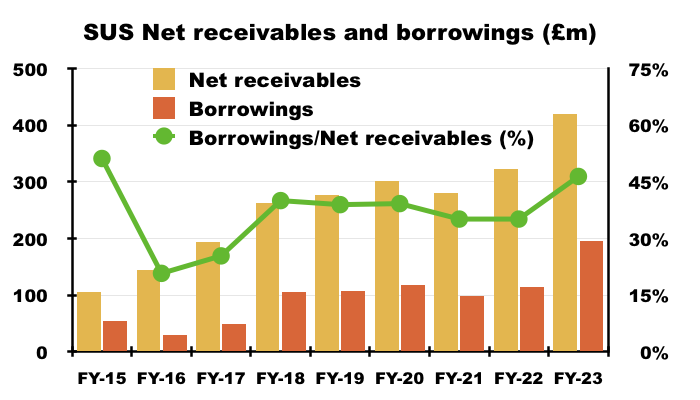
- Debt increased by £79m to £192m and remains under control; borrowings are more than twice covered by the £421m lent to customers (after provisions):
- The presentation revealed Aspen distributing a maiden £1.2m dividend to the parent company, of which £0.8m was paid during H1:
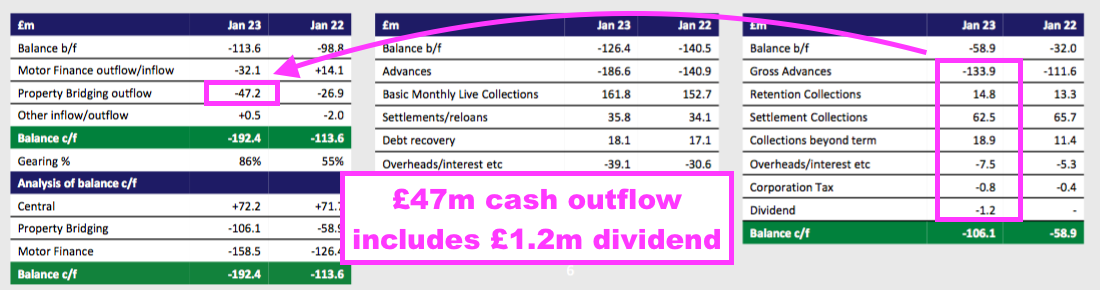
- Aspen paying a dividend suggests the division has achieved a ‘base’ level of profitability.
- Bank interest paid during this FY was £7.4m, implying SUS’s average £155m borrowings incurred interest at approximately 4.8%.
- H2 interest was £4.7m, implying SUS’s average £176m H2 borrowings incurred interest at approximately 5.4%.
- 5.4% compares to 3.4% interest incurred during the comparable FY 2022.
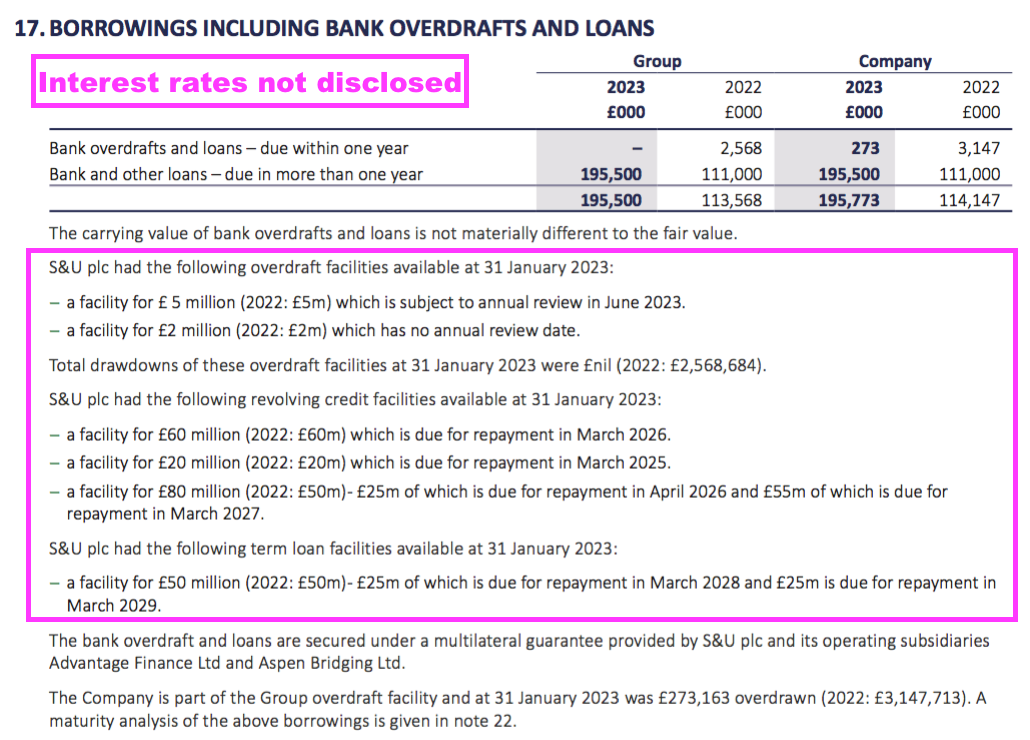
- The accounting notes said the effective interest rate on the borrowings was 6%:
“The average effective interest rate on financial assets of the Group at 31 January 2023 was estimated to be 25% (2022: 25%). The average effective interest rate of financial liabilities of the Group at 31 January 2023 was estimated to be 6% (2022: 4%).“
- SUS does not disclose the exact rates payable on its debt facilities, which is poor form:
- In contrast, fellow portfolio member Mountview Estates for example gives the following information:
1. The Group has a short-term borrowing facility of £10 million (2022: £10 million) with Barclays Bank. This is due for review in November 2023 and the rate of interest payable is:
• 1.6% over base rate on overdraft
• Headroom of this facility at 31 March 2023 amounted to £9.94 million (2022: £10 million).
2. The Group has a £60 million (2022: £60 million) long-term revolving loan facility with Barclays Bank with a termination date of March 2027. The rate of interest is 1.9% above SONIA. The loan is secured by a cross guarantee between Mountview Estates P.L.C. and its subsidiaries. The loan is not repayable by instalments. Headroom under this facility at 31 March 2023 amounted to £20 million (2022: £58 million).
3. The Group has re-negotiated a £20 million long-term revolving loan facility with HSBC Bank. The termination date for this facility is March 2028. The rate of interest payable on the loan is 2.1% above SONIA. The loan includes a Negative Pledge. The loan is not repayable by instalments. As at 31 March 2023 headroom under this facility amounted to £3.3 million (2022: £2.8 million).
- Management’s FY webinar disclosed debt costs were “just less than 3%” above SONIA, and therefore shareholders “could assume” S&U was at the time paying “about 7% on the borrowings“.
- SONIA is currently 5.18%, which means SUS could now be paying 8% on its debt.
- 8% on gross debt of £196m equates to annual bank interest of £16m — more than double this FY’s £7m.
- Management’s FY webinar also confirmed 100% of debt was variable-rate.
- SUS said higher interest rates were budgeted for:
“A rapidly increased Bank Rate has been budgeted for, not only in our usual budgets but in our longer-term projections. Current signs hint that such a view might happily prove conservative.”
- The base rate was 4.25% when this FY was published and is now 5.25%.
- Management’s FY webinar said the debt was within SUS’s “comfort zone” and SUS claimed its borrowing facilities of £210m could even be “augmented further“:
“Gearing increased from 55% to 86% which is still low for a financial services group. S&U net group borrowings are £192m within S&U’s medium-term facilities in place of £210m with its excellent, loyal and constructive banking partners. These were augmented by £30m in Autumn 2022. It is anticipated that as growth trends become clearer, in what is still a very uncertain macro-economic climate, then these facilities will be further augmented.“
- Higher interest rates will diminish the returns earned on the money SUS has already lent, particularly at Advantage, where loan terms last for 54 months (see Valuation).
- Interest payable by all customers (Advantage and Aspen) is fixed throughout their agreements.
Financials: Returns on capital employed, loan capital and equity
- SUS’s return-on-capital-employed slide made a welcome comeback following a three-year absence:
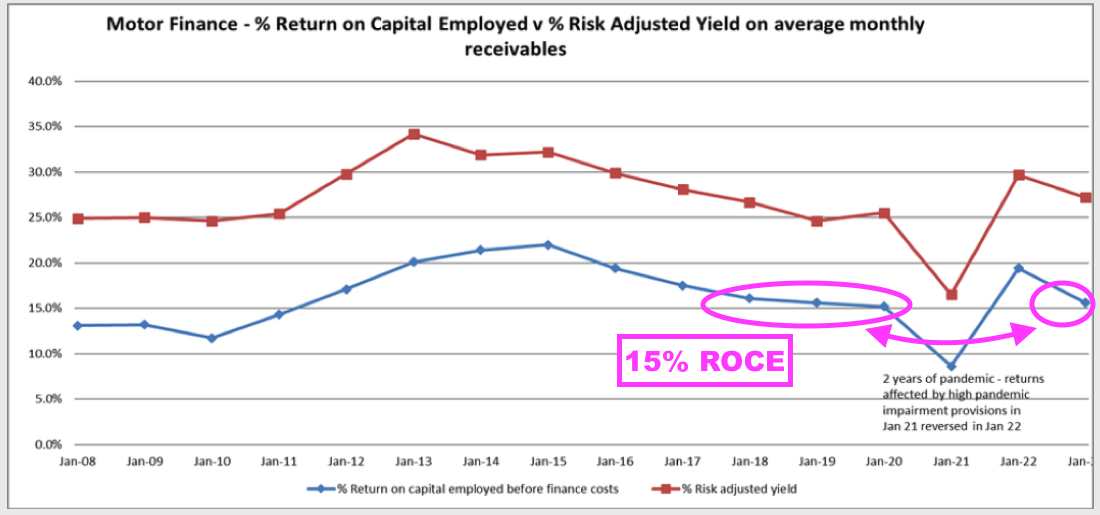
- ROCE at 15% for Advantage is similar to pre-pandemic levels.
- Advantage ought to enjoy lucrative ROCEs when customers repay their loans in full and on time.
- Charging a flat 16.3% annual interest on a £7.8k loan over 54 months less cost of sales of £907 generates approximately £4.8k.
- Earning £4.8k from a £7.8k investment over 54 months equates to a 62% return or close to 14% a year.
- Note that Advantage customers repay a mix of loan capital and interest during the terms of their loans.
- That c14% return could therefore be approximately 27% assuming the loan capital is repaid equally throughout the term.
- The same calculations for the ten years to FY 2022 are within a consistent — and appealing — 27% to 31% range.
- Of course not every Advantage loan is repaid in full and on time.
- 24% of the £403m Advantage lent originally (and still outstanding) has been classified as a bad debt (see Advantage Finance: Provisions)
- Reducing that 27% return by 24% gives a 21% return, which remains very healthy and still leaves good room for error with a greater proportion of non- or part-paying borrowers.
- Companies House shows Advantage’s net asset value advancing from £76m to £147m during the last five years…
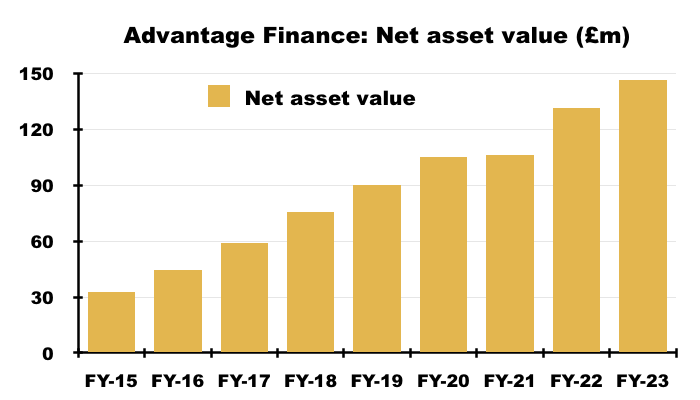
- …with cumulative dividends paid to the parent company of £61m during the same time:
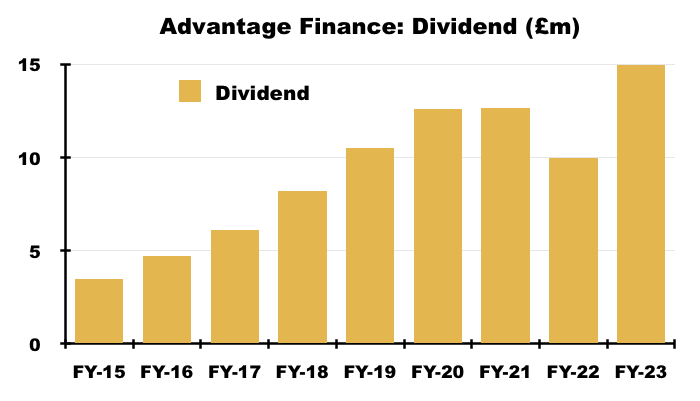
- Advantage creating an additional £132m (i.e. £71m extra NAV and dividends of £61m) over five years from a starting equity base of £76m is extremely impressive, especially as the subsidiary’s expansion during those five years was funded entirely by repayment collections reinvested into fresh customer loans.
- Group NAV meanwhile has gained £73m to £225m during the last five years, with dividends paid to shareholders over the same time amounting to £68m:
- The group creating an additional £141m over five years from a starting equity base of £153m is very respectable, and equivalent to a compound 14% total return.
- The difference between the extremely impressive returns generated by Advantage and the very respectable returns generated by the group are the very modest returns from Aspen.
- Companies House shows the property subsidiary absorbing total cash of £106m since its formation and generating cumulative earnings of only £8m.
Financials: Employees and margin
- This FY included commentary critical of general UK worker productivity:
“As has been evident over the past 12 years, productivity is feeble in the UK and is unlikely to increase substantially since the current government lacks a clear and robust growth strategy.
…
“Last year a further £74bn was “invested” in the ever-growing public sector where productivity is both significantly less than in the private sector, and may even in some areas be negative. Public sector output is still 7.4% below pre-pandemic levels. This is a significant cause of Britain’s decades-long decline in productivity.”
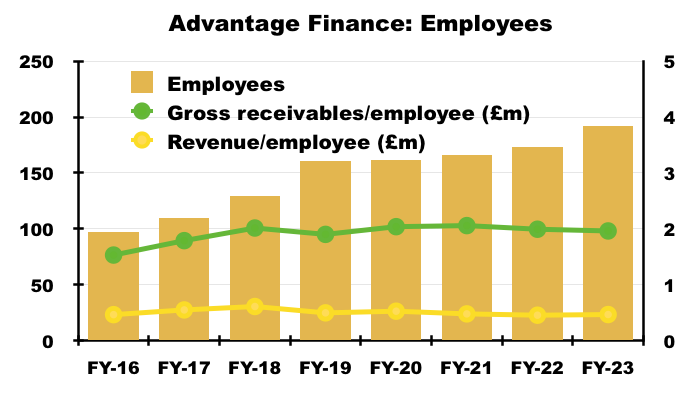
- Advantage’s employee productivity has not shown obvious improvements during recent years.
- Each Advantage employee continues to handle motor loans (before provisions) of approximately £2m and generate revenue of approximately £470k:
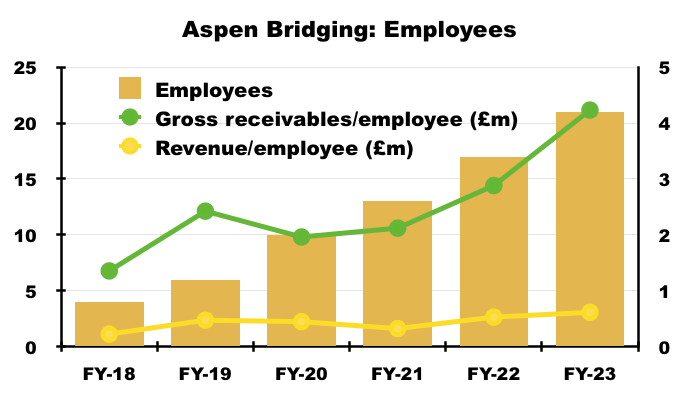
- Aspen employees meanwhile each handle property loans (before provisions) of approximately £4m and generate revenue beyond £600k:
- SUS managed to keep administrative costs (mostly employee expenses) at 16% of revenue for this FY:
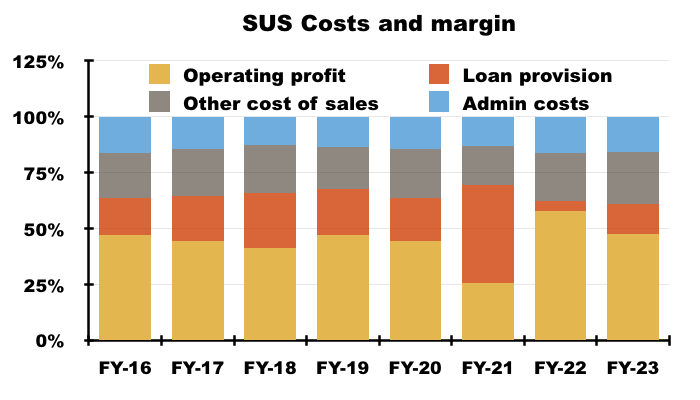
- Overlook the comparable FY 2022 and its provision reversals, and this FY’s 48% operating margin was the group’s best since at least FY 2015.
Valuation
- This FY sounded upbeat about FY 2024:
“Current trading is good and I am confident that our focus, our expertise and our experienced team will enable us to take advantage of the emerging opportunities that this year will bring.”
- The Q1 update during May was also positive:
“S&U is pleased to report another strong trading performance in the first quarter of this financial year. Group profit, turnover, debt quality and collections are ahead of last year. In addition, S&U continues to strengthen its financial, regulatory and branding foundations which will enable it to grasp significant opportunities for growth, anticipated at its full year results in March.“
- But an H1 2024 update during August was not as positive and cited “economic headwinds“:
“The group continues to trade well. It does so carefully due to the current economic headwinds impacting consumer confidence, disposable incomes, taxation and interest rates. Although the past two months have seen an uptick in transactions and the new customer pipeline, current economic policies in the UK reduce consumer confidence and create barriers to our usual rate of sustainable growth.“
- The August update admitted Advantage advanced 11% less during H1 2024 than H1 2023, and rising interest rates had impacted the subsidiary’s margins. However, the level of up-to-date motor loans was ahead of the group’s expectations.
- Transactions at Aspen meanwhile were “below budget” during H1 2024, although “good repayment quality” had led to below-budget impairment charges.
- The August update confirmed H1 2024 had ended with a loan book of £417m (down £4m on this FY) and debt of £184m (down £12m on this FY).
- NAV may therefore be £417m less £184m = £233m or £19.18 per share.
- The £22 shares presently trade at 1.15 times my NAV guess of £19.18 per share:

- The very best buying opportunities have occurred when these shares trade at NAV or below, while upside has tended to be very limited when the shares trade at 2x NAV or more.
- Buying at NAV should (in theory) deliver returns equivalent to lending direct to SUS’s customers — with NAV effectively protected by the right to repossess the secured vehicles/properties if the loans default.
- My 1.15x NAV rating therefore implies the market is worried that economic trouble will lead to poor trading, greater write offs and slower NAV progress.
- My 1.15x NAV rating suggests the market is also worried that greater borrowing costs (and higher tax) will hamper NAV progress.
- For perspective, this FY’s pre-tax profit of £41m would have reduced by £5m to £36m were borrowing costs incurred at the aforementioned 8% (and not at the actual c4.8%) on the average £155m debt (see Financials: Cash flow and debt).
- Then apply standard UK tax at the new 25% (rather than 19%) to that £36m, and this FY’s earnings would have dropped from the original £34m to £27m — a £6m or 19% reduction.
- That £6m reduction equates to 53p per share — more than a third of the actual £1.49 NAV per share growth enjoyed during this FY.
- The 1.15x NAV rating may also reflect the substantial capital employed — that delivers much lower returns — at Aspen.
- Slower NAV growth during the next few years could leave shareholder returns more dependent on the dividend.
- The trailing 133p per share payout provides a handy 6.0% yield at £22.
- This share has typically offered a useful income. My initial purchase during Q1 2017 at £21 supplied a trailing 4.1% yield, while a top-up during Q2 2019 at £19 supplied a trailing 6.2% yield and a further top-up during Q4 2020 at £17 supplied an (at the time) estimated 5.3% yield.
- The aforementioned Coombs family managers have successfully navigated many previous downturns (not least the pandemic), and the 2023 annual report reminded shareholders of the long-term benefit of employing such leadership:
“Our over-arching factor in the success of our business over 80 years and through three family generations of management is our business philosophy. The identity of interest between management and shareholders has fused our ambition for growth with a conservative approach to both credit quality and funding.”
- The board’s “conservative approach to both credit quality and funding” should (once again) prove its worth were yet another bout of difficult times to emerge.
Maynard Paton

Hi Maynard,
I still hold and still very much like S&U. In the short-term it’s pretty brutal as the share price, along with those of many other UK finance stocks, is getting hammered at the moment.
But, of course, what matters is the operational performance of the business, and on that front, I think S&U has done surprisingly well. My main concern, if I have one, is the property business, but that’s still very small so even if the property market is weak for years, it won’t materially impact the overall result.
John
Hi John
Thanks for the comment. Business performance has done very well over the long term although the latest interims did indicate some lending caution, so immediate NAV and DPS growth may be muted. Property volumes are likely to reduce in a housing downturn, but divisional arrears have been minimal so the division’s loan book should retain its value. Lots of applications still for motor loans, though, which perhaps is surprising. Share price I think now back to where it was 8 eight years ago, and now close to NAV. Everything all backed by family management owners who seem to care genuinely about the returns for outside shareholders!
Maynard
Hi Maynard,
S&U trading update to 11/12/23:
Nasty 11% fall in SP today following the trading update from Chairman, Anthony Coombs.
As a long time holder here, I have a biased view of this company believing in the shareholder alignment between the Coombs and my small position. That has played out well for me over time.
I do feel that Mr Coombs statement today was quite bearish, more so than normal, and it actually spooked the market more than was deserved. I think the style of today TU is a bit of an own goal actually.
I will wait for the full year numbers, but on the face of it Advantage Finance is trading well in a difficult market for used cars sales (small growth in book and bad debts running below budget). Advantage could prosper if prices of cars come off and supply chains normalise as customers may be better inclined to trade up.
My broader concern would be the mention of formal interactions with the FCA and the potential of a Skilled Person Review. Could this be a review of lending practices and concern related to high profit from ‘vulnerable’ consumers? Could it be linked with the retirement of the Advantage CEO?
Hi James
Thanks for the message. The statement is here. I thought the commentary emphasised the group’s frustration with ever-greater levels of regulations and compliance.
E.g. “More recently, these have been supplemented by a significant influx of consumer regulation from the Financial Conduct Authority as set out in its Principles for Business, Consumer Credit Source Book, its “Dear CEO” letters, the Borrowers in Financial Difficulty review, its Tailored Support Guidance……….and now by the Consumer Duty. As a consequence, attempting to reconcile and interpret the policy, process and operational requirements of these dictates has now become a major, often subjective and expensive process.”
I don’t like the need for a Skilled Person Review, which emphasises how the regulation has become so complicated it now can’t be understood/implemented by veteran sector executives alone. At least SUS says others in the sector are in the same boat. I dare say all the extra regulation could have been a factor in the decision by Advantage’s boss to retire! I suspect references to ‘appropriate forbearance’ could well mean the economics of Advantage may reduce as new FCA rules give customers more leeway with repayments.
Maynard
Completely anecdotal but an acquaintance of mine who is involved in the used car trade has told me that the market is difficult. Cars are staying on the forecourt for longer and requiring more haggling on price when sold. When was the last time the car market wobbled, and what was the impact on the impairment numbers for the company?
Hi Steven
Thanks for the message. Yes, car dealer Vertu said something similar the other week: “The Period has witnessed a material change in the used vehicle market with UK wholesale values experiencing a significant reduction in October and November.”
The car market wobbled during the pandemic of course. Before that, I am guessing 2008/9 during the banking crash? Advantage seemed to operate relatively well during that time. Companies House in fact shows Advantage’s profit and NAV rising every year from inception in 1999 until the pandemic. So there is not much to go on I am afraid, especially as Advantage back in 2008/9 was much smaller and the impact of bad loans may have been easier to obscure through the increase in new customers.
Maynard
Hi Maynard
I have followed and from time to time invested in SUS for perhaps 20 or more years. This might not help you but given that this is also a serious holding for you, my points might have some relevance.
My very recent change of view is that SUS is now no longer a part of my “Investable Universe”.
My reason is that the fastest growing part of this business (Short term property loans) is a lot worse than the motor finance. It might even be worse than the their small loans business that they sold a while back at a good price.
I would reconsider if the situation changes, but the fast growth of Bridging Finance is far too worrying for me.
Regards
Charles
Hi Charles
I would not say property bridging is a lot worse than motor finance. The division remains relatively young and ROCE is not yet up to comparable levels I think. Plus write-downs at property are much less than motor (easier to repossess and sell a property than a used car), which may prove quite valuable in a tougher economy. My main worry is extra regulation that may change the economics of HP motor lending. The property side is not regulated.
Maynard
Hello Maynard
Congratulations on your share performance in 2023, really glad to see that the year ended well for you. 2024 appears off to another rocky start, let’s hope that reverses soon.
I’ve been reading about the FCA investigation into some car finance lenders that had ‘discretionary commission arrangements’ with brokers. Do you know if this would potentially apply to #SUS?
Thanks James. The 2023 performance was somewhat fortunate given it was supported almost entirely by one share and occurred during the last few weeks of the year. But I will take it after an awful 2022! I understand SUS did not undertake the arrangements under scrutiny by the FCA.
Maynard
Difficult day for S&U holders today, such as myself. Downbeat kind of tone to the TU from the Chairman, which I respect as an honest appraisal, as opposed to a lot of companies who attempt to mask poor results with positive language.
I was expecting a downgrade to full year profits, and a 10 – 15% move is within my range of tolerance. PBT cut due to higher provisioning for loss under IFRS9. A cut to the dividend by a similar amount feels about right, and prudent.
On the positive side, I would expect any drop in interest rates later in the year to be a boost to S&U, where the margins have been compressed recently. But I should not hold my breath waiting for that cut to come…
Also positive are the results from Aspen Bridging, with profitable lending growing at a reasonable rate and no major hike in loans beyond term.
I believe S&U know how to navigate downturns and weaker consumer demand based on their long experience. The one area that concerns of most is the mention of deepening interactions with the FCA and ‘pre-cautionary’ changes to collection and repossession. I have held shares here as I felt that the management show good commercial judgement balanced with ethical treatment. Are S&U getting tarred with the same brush as other financing firms, or am I wrong in believing this??
Price must now be getting close to NTAV, which has historically been a good time to invest,
Hi James
Agreed, not the greatest of updates from SUS and I am somewhat concerned about the dividend cut. This is a business that, pandemic aside, had never cut its annual payout since 1987. So I am sensing there’s more to this update than just wider economic ‘headwinds’.
Note the profit downgrade of 10-15% from the (previously) expected £38m for the FY means H2 profit — (previously) expected to be c£17m given H1 was £21m — is now set to come in at £13m or less. Part of that lower H2 profit will be due to greater interest costs — set to be c£10m versus c£5m in H1. But part will be due to the lower collection rates (90%) which will no doubt feed into FY 2025.
Like you I am concerned about the FCA interactions and whether Consumer Duty has permanently impacted the economics of HP car finance. This text — “Advantage has made precautionary changes to its collection and repossession processes with a particular focus on those customers in payment arrears” — suggests lenders may not be able to recoup as much from non-/late- paying customers as before. What I guess is frustrating is existing car loans were priced and issued by SUS before Consumer Duty, and Consumer Duty is now impacting the eventual returns of those same loans rather than just loans issued post-Consumer Duty.
Events at Jarvis (JIM) with its Skilled Person sadly shows such consultancy goes on far longer and becomes far costlier than management initially expects.
I guess the regulatory trend will mean the likes of SUS will in time serve fewer but lower-risk borrowers for used cars. Higher-risk borrowers may in turn struggle to raise finance and be ‘priced out’ of the car market.
Maynard
S & U (SUS)
Publication of 2023 annual report
Here are the points of interest beyond those noted in the blog post above:
——————————————————————————————————————
0) MISSION STATEMENT
Introduced actually within the 2022 report, but only noticed by me within this 2023 report (I tend to skim the pages before the chairman’s statement!):
“In the complex, and ever changing, world of financial services, over the past eighty years S&U’s customers have relied on the company for one quality above all – TRUST. Trust is the golden seam which runs through everything we do.
In practice it means:
TEAMWORK
In any business the guardians of integrity are its people, and their common pursuit of the highest standards.
RESPECT
Loving your neighbour is not simply at the core of Christian values, but transcends our behaviour towards everyone whatever their race, gender, religion or personality.
UNDERSTANDING
Valuing every customer must be grounded in a clear understanding of their needs, wishes and circumstances; this guides the service we offer them.
SERVICE
This is both the product and the proof of our understanding and respect for our customers, each other and our neighbours.
TRUTH
Honesty, integrity and transparency are the best guarantees of the way we treat all with whom we do business. If people trust S&U they will have confidence in the services we provide. The good business which results is our justified reward.”
1) CHAIRMAN’S STATEMENT
Various snippets of interest here.
a) General
With the benefit of almost 12 months hindsight and now knowing the prospect of a dividend cut for FY 2024, this line has not aged too well.
“As I predicted a year ago, S&U is indeed “primed for a new era of profitable growth””
I like how the chairman lists shareholders first, then employees and then customers:
“Although conscious of its wider societal obligations, S&U’s primary obligations are to our shareholders, our staff and our customers.
CLIG for comparison lists shareholders last of the three:
”The Group exists for the mutual benefit of our three primary stakeholders: Clients, Employees and Shareholders.”
As noted in the blog post above, the chairman was not happy with the government. A further political complaint:
“Recent governments have vacillated between the fiscal incontinence of last year and the hair shirt philosophy of the current administration. None have espoused the regulatory, public sector and tax simplification reforms so essential for rebooting the economy.”
Again with the benefit of 12 months hindsight, comments about the housing market seemed accurate with 2023 house prices actually down 1.4%:
“The housing market upon which Aspen depends both for transaction volumes and loan security, continues to be stronger than anticipated, despite rising borrowing costs and the upheaval in the money markets of last autumn. Whilst house prices have fallen slightly over the past six months this appears now to be stabilising. Indeed ONS statistics for December show annual price growth still 10% against a peak of 12% earlier in the year. Even allowing for an average 5% price deflation predicted for 2023, this would imply a cumulative increase over two years of just under 5% which further underpins Aspen’s conservatively written collateral. This conservatism gives S&U the confidence to continue to invest in Aspen’s new receivables book.”
b) Advantage Finance
I am hopeful the “prudence” and “careful underwriting” will indeed ensure “good repayments” as the “uncertain times” continued into FY 2024:
“Prudence and commercial logic both dictate that Advantage use the very significant demand for its products to focus on excellent customers who, buttressed by careful underwriting, good payment headroom and responsive customer relations, will ensure good repayments even in more uncertain times. Hence this year, particularly in the second half, has seen the introduction of slightly larger, longer term and competitively priced loans which have attracted near prime customers new to Advantage, which we anticipate will have benefits for Advantage’s already enviable book quality. ”
Marketing appears to have become more important:
“Nevertheless, attracting good customers in ever larger numbers is not simply a matter of price. It also depends on accurately targeted marketing. Here the Advantage team has been substantially strengthened by new advisors, by in-house recruitment and by a rebranding project which, directly and digitally, will improve every aspect of Advantage’s communication with existing and new customers.”
More quoted companies should employ “perfectionist” teams:
“IT improvements are reinforcing this. Voice analytics, specialist vehicle valuations, a new direct customer repayment portal, an improved website and a smoother e-signature on-boarding process, are just some of the initiatives the ever restless and perfectionist Advantage teams are working on.”
Lots of commentary on “duty of care” ahead of the formal introduction of the new FCA rules:
“The formal Consumer Duty introduced later this year for all financial services companies focuses on actual, rather than anticipated, customer outcomes, particularly for borrowers in financial difficulty. Advantage is proud of its near 25-year history of customer service and has responded by certifying a development plan and by embarking upon a 41 point action list, which will also be monitored by S&U’s internal auditors and by its Audit Committee.”
The chairman welcomed the prospect of Consumer Duty and SUS seemed prepared:
“Although some may argue that the new Consumer Duty attempts to lay on lenders’ responsibilities for future events inevitably beyond their control, and which, to an extent, replicates existing statutory duties of care to customers, S&U endorses the Duty for ethical and competitive reasons. Undoubtedly, those financial firms which best communicate their methods and products to their customers will gain their trust, their loyalty and their commitment – all values intrinsic to S&U‘s Mission Statement. As I have consistently pointed out, ultimately good business is always good business.
As a consequence, Advantage has always maintained regular and cordial relations with the FCA This year this is particularly focused on making sure that assessments of both credit worthiness and affordability are robust in an inflationary climate. Advantage anticipated these trends by regular reviews of its underwriting throughout the year. Indeed, it is this monitoring and maintaining of the subtle balance between prudent underwriting and competitively pricing products which has been the bedrock of Advantage’s success over the past 25 years.
This is also why Advantage sees the Consumer Duty giving a significant competitive advantage to businesses which maintain the very high standards of which they have been so rightly proud over the past 25 years.”
Not sure if the chairman has the same views now. The RNS on 09 February referred to “regulatory challenges“. (See point 1d below).
c) Aspen Bridging
Just the one actual loss during the year:
“This conservative approach is also reflected in Aspen’s loan loss provisioning charges which increased to £1.0m this year (2022: £0.3m), although the business only incurred one actual loss during the year of £80,000.”
I continue to wonder how ‘scalable’ Aspen is with its “tailored” and “bespoke” service:
“A strong loan book also depends upon providing products which are tailored to individual customers. Aspen is able to provide a bespoke service to borrowers as well as being fleet of foot in the service it offers.”
More companies should confirm they undertake quarterly reviews of staff productivity!
“Quarterly reviews of staff productivity are held and new products considered.”
d) Governance and Regulation
Lots of commentary about “state control and intervention” and high taxes:
“I will not repeat my concerns of a year ago on the importance of financial regulation being proportionate, clear and not inhibiting a vigorous and competitive free enterprise system. By harnessing the basic instincts of communities and individuals to improve themselves and their families, it is this free enterprise system – not one based on state control and intervention – which has transformed living standards over the entire period of S&U’s existence.
But today too often this is taken for granted. New regulations, Codes of Practice and “guidance” are never ceasing. Moreover, the government spends at least half of the country’s resources. Taxation is at its highest level since 1946. Such is the suspicion of the profit motive that detailed regulation of every customer transaction is deemed essential both ab initio and throughout the customer relationship.
Tragically, the gyrations and misfortunes of the current government have done nothing to reverse these trends. There are three serious consequences. First it destroys incentives – not just for the wealthy but for the aspirational and much maligned middle-class who find themselves paying higher rates of tax on the same real income.”
And further comments about Consumer Duty preperation:
“On a day to day level however, S&U and Advantage in particular continue to enjoy positive relations with their regulators. Advantage’s preparations for the Consumer Duty are well advanced, as is its Development Plan. Meanwhile, Advantage’s industry body, the Finance and Leasing Association upon which two of our executives sit, continues to lobby for a more consistent and coordinated legislative and regulatory regime.”
2) STRATEGIC REVIEW
a) Advantage Finance
A reminder of the type of borrower Advantage aims for:
“S&U operates in two areas of specialist finance. The first and most established is Advantage Finance, based in Grimsby and engaged for the past two decades in the non-prime sector of the motor finance business. During those 23 years the remarkable success of Advantage in producing competitive finance products, lent responsibly with excellent customer service has been reflected, in a near perfect (two covid years apart) record of consistently increased annual profits.
This long experience has enabled Advantage to gain a significant understanding of the kind of simple hire purchase motor finance suitable for customers in lower and middle-income groups. Although decent, hardworking and well intentioned, some of these customers may have impaired credit records, which have seen them in the past unable to access rigid and inflexible “mainstream” finance products. Advantage provides transparency, simplicity, clarity and suitability to both service and product, which these customers require.”
Unique applications topped 2 million this year versus “nearly” 1.5 million for the year before:
“As a result, Advantage currently now receives over 2m unique applications…
More on Consumer Duty:
“This year the Financial Conduct Authority produces one of the biggest overhauls of its regulatory approach to the financial services industry for many years. In addition to the now aged Consumer Credit Act, a raft of secondary legislation and regulatory controls over the past 20 years have now all been encapsulated in the new Consumer Duty regime.”
Ensuring the rather broad “good outcomes for retail customers” was always going to be the issue with this “paradigm shift“:
“This “paradigm shift” represents a major part of the FCA’s 2022 – 2025 strategy and extends the principle of consumer protection from their initial treatment, including underwriting, communication and product design, to a wider concern with “good outcomes for retail customers”.”
But exactly what “good outcomes” are remain uncertain:
“At present these outcomes are inevitably undefined and, given the longevity of some finance agreements, will be difficult to both interpret and monitor in the future.”
The Consumer Duty silver lining for shareholders is perhaps other lenders may suffer more than SUS:
“However, Advantage will responsibly embrace the new Consumer Duty. First, because it is right to do so and second, since it will give well organised companies like Advantage a commercial advantage over those who are not.”
SUS included its usual used-car statistics:
“The success of Advantage, our motor financier, depends as ever upon three fundamental strengths. First, is the enduring reliability of the UK motor market. Enduring does not mean unchanging, since 2022 actually saw used car sales fall in the UK by 13% compared to 2021, the year the market was bouncing back from Covid.
New car registrations in early 2022 also restricted the used cars available for sale. However, the market seems to be rebounding. Used car sales so far in 2023 have increased by 8% on last year with prices rising by 2.7% year on year so far.
Longer term, recent Auto Trader figures recorded consumer demand for the independence and flexibility of car ownership unhindered by a perceived decline in the quality of public transport, as being the strongest for 4 years.”
The 2022 report referred to “significant opportunities with electric-car financing. But this year SUS was not so upbeat:
“The Government set ambitious targets for a ban on the sale of new internal combustion engine cars by 2030, to be replaced by electric vehicles and hybrids. Although Advantage agrees that the proportion of electric vehicles in the UK “car parc” is expected to reach 30% by 2030, electric vehicle sales have recently been weaker than expected. Whilst supply has grown, used EV prices have fallen for 5 consecutive months as demand, concerned at the paucity and efficiency of public charging points, has slowed. For these reasons and for reasons of affordability, electric vehicles do not currently fit well with their customer demographic, although this will change as the used EV market evolves.”
I am always a fan of any company that uses data “forensically to analyse“:
“Advantage’s second strength is its experienced, sensitive and sophisticated under-writing. Backed by ever more customer historical information; Advantage uses this forensically to analyse the likely circumstances of actual and potential customers. This year it has added a third Credit Reference Agency and obtained even more granular household information which it will be using to improve its already sophisticated customer affordability process.”
A third credit-reference agency should help the underwriting, too.
Successful motor-finance collections are underpinned by a greater understanding of customer circumstances:
“Advantage has always regarded its relationship with its customers as a partnership. This involves understanding the more sensitive and frequently changing circumstances of those in the non-prime sector. Whilst the UK labour market remains strong, rising cost of living pressures mean that well intentioned customers occasionally require knowledgeable assistance, particularly should their financial buffers reduce. Collectors at Advantage produce excellent results by being trained and empathetic to the needs of their customers. Collecting and default figures demonstrate this and underpin our responsibility under Consumer Duty and are integral to Advantage’s commercial success.”
b) Aspen Bridging
Confirmation Aspen has tightened its lending:
“Aspen values its security properties very conservatively and keeps gross LTVs to an average 70% and the business now only considers experienced borrowers from the top three quality bands. Such caution is justified. Refinances are slower and mortgage lenders are more risk adverse; these make borrower exits more drawn out. Aspen has therefore sensibly allowed for slightly more subdued lending levels for the first few months of the year as the market stabilised.”
The length of time to sell a house in the Midlands has apparently extended from 3 months to 12:
“Notwithstanding this, under pressure from the cost of living and rising interest rates the housing market in the UK has undoubtedly slowed over the past year. A Midland Estate Agent recently reported that whilst in the summer of 2022 it took 12 weeks for the average house sale, that figure is now nearer 50.”
c) Family management
SUS reiterated the core reason — family management with significant ownership — for the group’s long-time success:
“An over-arching factor in the success of our business over 80 years and through three family generations of management is our business philosophy. The identity of interest between management and shareholders has fused our ambition for growth with a conservative approach to both credit quality and funding.”
3) BUSINESS REVIEW
a) Advantage Finance
Further confirmation about prepping for Consumer Duty and improving the marketing:
”Advantage have prepared thoroughly for the formal consumer duty to be introduced later this year and have made suitable changes to their affordability buffers in line with the rising cost of living. The business has continued to improve its IT capabilities and has improved its marketing which has been bolstered by new advisers, in house recruitment and rebranding to improve our communication with existing and new customers.”
b) Aspen Bridging
Encouraging talk of “increasingly supportive and loyal brokers“:
“Aspen further widened its range of increasingly supportive and loyal brokers, further tightened its valuation and underwriting processes and still insists that every property upon which Aspen lends for security is personally visited by a member of the team.”
4) FUNDING AND BALANCE SHEET REVIEW
Never harms to compliment your lenders in a difficult economy!
“S&U net group borrowings are £192m within S&U’s medium-term facilities in place of £210m with its excellent, loyal and constructive banking partners. These were augmented by £30m in Autumn 2022. It is anticipated that as growth trends become clearer, in what is still a very uncertain macro- economic climate, then these facilities will be further augmented.”
5) PRINCIPAL RISKS AND UNCERTAINTIES
Seems like SUS has learned a lesson about the follies of economic predictions.
The 2022 report predicted inflation would be unlikely to persist above 4% during FY 2023 (to 31 Jan 2023):
“Current projections for growth this year are now just 4.8%. Current trends in interest rates, although upward, are in our view unlikely to be very significant particularly since inflation is unlikely to persist at more than 4% throughout the year. More encouraging are the trends in the labour market where unemployment at 4% seems happily likely to persist.”
This report in contrast said making economic predictions was a “virtually impossible task“:
“Whilst Corporate Governance guidelines, and the loan loss provisioning insisted upon by International Financial Reporting Standards require macro-economic forecasts, both Covid, the recovery from it, current inflationary trends and a continuing war in Europe make this a virtually impossible task. For instance, last year the Office for Budget Responsibility expected the British economy to grow by over 7% in 2022; in fact growth only reached 4% that year.”
a) Consumer and Economic risks, Operational Risk and Risk Management
No significant changes here versus 2022.
b) Funding and Liquidity Risk
A few extra lines here to reflect changes to interest rates:
“The Group is aware of current less stable banking markets but due to its facility maturities and low gearing should be relatively unaffected by this.”
“However, current interest rate levels have prudently been expected to continue throughout this year in our budgeting assumptions.”
This 2023 annual report was published during April 2023 when the BOE base rate was 4.25%, since when the rate has advanced to 5.25%. I do wonder if SUS has been caught out somewhat by rising interest rates.
c) Legal, Regulatory and Conduct Risk
Lots of extra text this year relating to Consumer Duty.
A new manager has overseen the implementation of the regime:
“This year Advantage has prepared for the Consumer Duty regime by setting up a small executive working party charged with an Implementation Plan which was agreed by the Advantage Board in November 2022.
To comply with the Duty by the 31st July 2023, the plan must be monitored and its outcomes managed. To this end the plan’s operation will be overseen by a new Consumer Experience Manager who will ensure that it is reviewed regularly, and upper most in the minds of all committees throughout Advantage. The Consumer Experience Manager will in turn report to Alan Tuplin, Chief Risk Officer.”
The text also sent hints/requests/pleas to the regulator:
“Finally it is hoped that, as pointed out in The Chairman’s Statement, that the interpretation by the FCA of its powers under the new duty is proportionate and promotes innovation and enterprise.
In turn, this should recognise that the moral and commercial interest of firms in creating and maintaining good and responsible long term relationships with their customers are identical. The bedrock for this relationship lies in the rigour of Advantage’s underwriting. This emphasises product design, credit worthiness assessments which are continually updated – particularly during the current pressures on the cost of living – good affordability and in particularly Advantage’s obligation to the small minority who are occasionally Borrowers in Financial Difficulty. The latter is currently rightly a focus for the FCA.
Advantage’s very strong record on these matters is clearly and comprehensively set out in the “Fair Value Assessment” of its HP products and their value for our customers, which will be submitted to the FCA as part of the Consumer Duty preparations.
Given Advantage’s compliance record and the detailed operations above it is to be hoped that, in turn, the FCA will ensure an absolute consistency of purpose and interpretation between itself and other regulators, particularly the Financial Ombudsman Service. Fair and effective regulation does require co-ordination and consistency.”
At least Aspen is not regulated:
“Whilst engaged in the un-regulated sector, Aspen Bridging has adopted procedures which are similar to those required in the regulated sector.”
6) CORPORATE SOCIAL RESPONSIBILITY
SUS publishes a relatively limited CSR section for a main-market listed company; some quoted companies (e.g. CLIG) really go to town with this part of the annual report.
I am all for businesses reducing their emissions, but often the climate-change risk text that the reporting regulations require are understandably very generalised and not of much real use to shareholders.
a) Employees
New text this year about apprentices:
“At Advantage in addition to regular external management and specialist training, significant use is made of the Government’s apprenticeship schemes. At present 8 staff members are so engaged. Four at level 3 business administration and digital support and four member at Level 5 leadership and Management. Last year one person broke local records by completing every exam and assessment with distinction!”
This report reiterated the “family ethos” of focusing on employee performance:
“It goes without saying that a Group based on a family ethos has no truck with discrimination of any kind – except of course on the basis of performance.”
b) Community
Slightly odd SUS repeats the previous annual report and gives the number of complaints reaching the Ombudsman for 2022, but does not disclose the number reaching the Ombudsman for 2023:
“We are proud to enjoy high levels of customer satisfaction. Last year our FIFO rating was 4.7 out of 5. In 2022 67 out of 86 complaints were decided by the Financial Ombudsman Service in Advantage’s favour. In the year to 31 January 2023 73% of complaints which reached and were decided by the Financial Ombudsman Service were related to the satisfactory quality of the vehicle (2022: 57%) and therefore not related to operational issues within Advantage.”
The suspicion is the number of complaints increased during 2023. Meanwhile, 73% of complaints about vehicle quality for 2023 is higher than 2022’s 57%, but is similar to the 74% for 2021.
The following is all new text for 2023:
“This year S&U plans to involve more staff within the Group in active volunteering; Aspen are currently investigating the development of a “volunteer” programme with Marie Curie cancer care both in Solihull and more widely.
Finally, S&U is pleased to announce its support for the Tax Payers Alliance, a non-political charitable organisation committed to ensuring efficient and effective government in the tax payers interest.”
The support for the TPA is perhaps not surprising given the chairman’s political comments!
c) Health and Safety and Diversity Policy
SUS reiterated its welcome policy on “recruiting the best people for the job” rather than applying ‘modern-day diversity’:
“Although we recognise that current thinking means that diversity reporting should be based around a statistical analysis of our staff’s racial origin, given our above long-standing policies, we consider that this can too often itself be divisive and potentially discriminatory. By recruiting the best people for the job, both enhance their self-esteem, irrespective of their background, racial or socio economic, and at the same time create an esprit de corps unmarked by tokenism.”
d) Climate Change
Lots of revamped text here.
This apparent ‘denial of responsibility’ from 2022 was not repeated for 2023:
“However, [Advantage Finance] has no direct control, nor should it have, over the customer’s choice of vehicle and the view on economy, efficiency and the environment this choice implies.”
I suspect Advantage still has no direct control over the choice of vehicles purchased, but efforts are now being made to reduce customer carbon emissions:
“In our motor finance business the average CO2 emissions of the cars and vans we finance reduced from 131 CO2 g/km last year to 129 CO2 g/km this year and by working with customers and other companies in our supply chain we are looking to accelerate this reduction.”
SUS has changed the timescale for wider adoption of electric vehicles from 30 to 20 years:
“Currently about half of customers opt for diesel vehicles, whilst the proportion of fully electric vehicles, principally on the grounds of their significant cost, is at present negligible. These proportions will change over the next twenty years as the market changes.”
Emissions understandably do not look excessive for what is primarily an office-based business:
Business-travel emissions have emerged for some (unexplained) reason, but a general reduction was recorded for 2023 due in part to “solar panels on our office buildings in Grimsby” and greater usage of electric company vehicles.
Revenue per tonne of C02 reduced by 0.3 during 2023. Target for 2024 is below 1.3. Target for 2023 was originally 1.8 (versus 1.3 actual), so SUS might be well below target again.
All the climate text boiled down to two generalised risks:
SUS’s conclusion was simple:
“Climate risk is an emerging risk but it is not currently considered a significant risk for the Group.”
7) BOARD OF DIRECTORS
Various changes here versus 2022 and subsequent to the publication of this 2023 report:
i) The understandable appointment of Aspen Bridging boss Ed Ahrens as an executive after the 2023 year end during February 2023.
ii) The retirement of non-exec Demetrios Markou during October 2023. He had served on the board as a non-exec for 25(!) years, which contravenes corporate-governance best practice (of 9 years).
iii) The appointment of Karl Werner to replace Graham Wheeler as boss of Advantage Finance during October 2023. SUS said Mr Wheeler would become a non-exec, but a formal announcement has not been forthcoming. Nor has a formal announcement been made as to whether Mr Werner has joined — or will join — the main board as an executive. Mind you, Mr Wheeler only joined the main board a year after being appointed as Advantage Finance boss.
I think the current board therefore remains staffed by 9 directors: the 3 Coombs family executives, the FD, Mr Ahrens, the now non-exec Mr Wheeler and 3 other non-execs.
One of the other non-execs, Jeremy Maxwell, was appointed during January 2022 and his bio — “broad expertise in digital innovation, marketing, commercial development and customer experience from over 25 years in the retail and B2B distribution industries” — underlines the greater emphasis on marketing (see point 2b).
8) DIRECTORS’ REMUNERATION REPORT
Lots of useful snippets here.
a) 2022/23 key decisions and pay outcomes
The 2023 pre-tax result was 6% ahead of budget:
“As a result Group profit before tax is £41.4m for the year ended 31 January 2023 which is 6% up on budget and compares to an average during the 2 previous pandemic years of £32.6m group profit before tax (2020/21: £18.1m; 2021/22: £47.0m).”
The 6% outperformance translated into £50k bonuses for the two lead Coombs executives and the FD:
“The Remuneration Committee judged the level at which the annual bonus payments should be made. Group Profit Before Tax (“PBT”) for the year increased by 27% on the average of the 2 previous years to £41.4m and ROCE was 13%. This was significantly above the PBT target level of £39.0m. Therefore, the Remuneration Committee determined that for the financial year 2022/23 bonuses equivalent to the maximum target annual bonus opportunity of £50,000 each would be awarded to Anthony Coombs and Graham Coombs and £50,000 to Chris Redford which represented target performance but was below the maximum potential annual bonus for Chris Redford of £75,000, given the stretch bonus target of £42.9m group PBT was not reached.”
The ‘stretch’ pre-tax target of £42.9m for the FD was 10% ahead of the pre-tax budgeted £39.0m.
The maximum £50k bonuses for the two lead Coombs executives compares with the maximum £30k paid out to the brothers for 2022.
I note the FD just about managed to ensure his shadow options vested. The target of £40.95m was exceeded by pre-tax profit of £41.4m by only £0.45m:
“In May 2022 Chris Redford was granted 6,000 shadow share options under the 2021 LTIP, as disclosed in last year’s Directors Remuneration Report. The Remuneration Committee determined that 6,000 of these shadow share options vested with reference to performance during the year ended 31 January 2023 based on group PBT being above the group PBT stretch target level for shadow share options of £40.95m.”
Interesting that the shadow-option LTIP stretch target (£40.95m) is lower than the annual-bonus stretch target (£42.9m)… yet the LTIP paid out a much higher sum (6,000 nil-cost shadow options = £128k (see point 8b) than the maximum bonus (£75k).
For the previous year, the stretch targets for the shadow options and the annual bonus were the same (£25.5m). Also, the FD received 6,000 shadow options this year versus 5,000 for 2022.
Mr Wheeler collected his full £75k bonus and 6,000 shadow options, albeit his divisional stretch targets were (as usual) not disclosed:
“The Committee judged the level at which the annual bonus payment should be made. For the financial year 2022/23 a bonus of £75,000 was awarded to Graham Wheeler for achieving stretch targets. In May 2022 Graham Wheeler was granted 6,000 shadow share options under the new LTIP, as disclosed in last year’s Directors Remuneration Report. The Remuneration Committee determined that 6,000 of these shadow share options vested with reference to performance during the year ended 31 January 2023 with reference to the underlying profit performance of Advantage and achievement against the stretch PBT and ROCE based targets set for that year.”
Jack Coombs enjoyed a modest £25k bonus versus a very modest £10k for 2022:
“For the financial year 2022/23 a bonus of £25,000 was awarded to Jack Coombs.”
b) Single-figure remuneration table
Pay rises of various scales were enjoyed during 2023:
The lead Coombs executives limited their pay increases to 3.8%, with the FD at 5.4%. Mr Wheeler enjoyed a 20% increase (to £300k), which I think was more a ‘catch up’ to the lead Coombs brothers’ pay (which averaged £366k):
The 10% pay rise for Jack Coombs does not seem outrageous given his (relatively modest for a quoted-company executive) new £110k salary. The wider workforce collected a useful 9% pay rise.
The lead Coombs executives may not be underpaid at a £366k average and I do think a non-family business would not require both an executive chairman and an executive deputy chairman.
Still, the chairman’s salary CAGR has been 1.9% over the last five years, while shareholder income through the dividend has been a 4.8% CAGR. The chairman’s benefits have almost doubled during that time though.
Bonuses seem limited to 25% of salaries, which is modest these days for quoted companies. Mind you, the FD and Jack Coombes enjoyed chunky 14.5% pension contributions, while Mr Wheeler received 10%. The employee-pay footnote suggests all employees received average c4% pension contributions. Best practice I believe is executives receiving pension contributions in line with the wider workforce.
The aforementioned shadow options gave decent £128k payouts to the FD and Mr Wheeler. I should add between 2017 and 2021, the FD’s shadow-option LTIP paid out £0, £0, £53k, £74k and £0, so not every year is a bumper year.
c) Key remuneration decisions and related matters for the year ending 31 January 2024
Aside from the modestly salaried Jack Coombs, pay rises for 2024 are limited to 3.3% or less:
New board executive Mr Ahrens is on £207.5k and received 3,000 shadow options for 2024. The FD and Mr Wheeler received 5,000. I am not sure why the number of shadow options increased from 5,000 to 6,000 for 2023 and is now back to 5,000 for 2024 for those two executives.
Pay and bonuses may soon be linked to non-financial measures:
“The Remuneration Committee believes that an element of the executive remuneration should be linked to non-financial KPIs that align with the Company’s purpose and long-term strategy, particularly around the Company’s governance structures and environmental impact. The Company is in the process of developing and implementing its sustainability strategy and the Remuneration Committee will continue to develop clear and measurable non-financial KPIs to be included in executive remuneration, factoring in externalities linked to the overall strategy. Environmental, Social and Governance factors have become critical to good business practice and are tied to the success and long term sustainability of organisations across all sectors. As a result, the Remuneration Committee is considering how best these can be incorporated, measured and linked to the overall strategy and purpose of the Company.”
The board’s remuneration policy is due to be updated for 2024…
“The Remuneration Policy is planned to be updated at least every 3 years and was last updated in 2021 and published in full in the 2021 Annual Report.”
…which may the be the opportunity to introduce new non-financial influences to pay. Of course that could mean bonuses being paid when the financial performance has been sub-par! SUS would not be the first company to pay executive bonuses for meeting an ESG target.
Voting at the 2022 AGM did not show huge dissent on pay:
Of the c5.6 million votes cast in favour, approximately 4.9 million probably relate to the Coombs family directors and an associated venture:
From this annual report combined with subsequent RNSs, I calculate Anthony Coombs owns 10%, Graham Coombs owns 13.5%, Jack Coombs owns 13.8%, Jennifer Coombs owns 3.8%, Richard Coombs owns 0.02% and Grevayne (a Coombs vehicle) owns 3.1% = 44.2% or c5.4 million of the 12.15 million share count.
Now Demetrios Markou has retired, none of the non-execs own any shares.
Total board pay was nearly £2.3m, or 1% of the £225m net asset value or a notable 19% of the total £12.2m employee expense.
The 2024 pay report will be interesting to read given the year-end profit warning issued on 09 February. Director pay was frozen and bonuses reduced during the pandemic, and I do feel the Coombs executives are pretty straight with outside shareholders and SUS’s longer-term track record does not lead to obvious remuneration complaints about rewards for failure.
9) GOVERNANCE
a) Audit committee report
As noted in the blog post above, the FRC made contact during the year:
“Regulatory Correspondence
FRC request for information
The Company received a request for information from the Financial Reporting Council (FRC), who regularly review listed company accounts, in respect of disclosures around the net increase in overdraft, expected credit losses and collateral in S&U’s accounts to 31 January 2022. The company has provided further information to the FRC and agreed to amend a narrative comparative figure for the net overdraft and to further enhance disclosures in the areas of expected credit losses and collateral in its accounts to 31 January 2023. The company is grateful to the FRC for its helpful and constructive observations and the FRC have confirmed that their review is now closed.”
Aside from the FRC contact, the only additional committee text for 2023 was “The Committee also reviewed the impairment, revenue recognition and strong receivables growth of our Property Bridging Finance business.
The committee’s “significant matters” remain judging the impairment of motor-finance receivables and the revenue recognition of motor finance (the two key audit matters — see point 11) .
b) Corporate Governance
No changes to the text for 2023.
A reminder of why SUS’s family management is not entirely compliant with corp-gov best practice:
“In S&U’s case this has always meant an identity of interest between major shareholders and the executive management of the Company. The requirement of the Code of Principles for Board’s to “promote the long-term sustainability or success of the Company, generating value for shareholders and contributing to wider society” is sustained by this and by our consistent mantra of “steady, sustainable growth.” Our mission statement is published on the inside front cover. Family investment and management has over the past 85 years been reflected in ambition for growth and for new markets buttressed by a conservative approach to risk, to treasury activities and to return on capital employed. The same culture is seen in “work force engagements” through employment stability, good communications and a streamlined, non-bureaucratic, management structure, as a staple of S&U well before the Governance Code even existed.”
Under Provision 9 of the Code it is recommended that the Chairman should be independent on appointment and should not have previously served as Chief Executive of the Company and under Provision 19 of the Code it is recommended that the Chairman should not remain in post beyond nine years from the date of their first appointment to the Board. Mr. Anthony Coombs was appointed Chairman in 2008 as part of an established succession plan reflecting the Coombs family’s significant holding in S&U, the identity of interest between management and shareholders and the consequent success of the Company. As explained above this has been (and is perceived by the investing community) as a significant strength in the responsible, long-term strategic approach to S&U’s development. Mr. Coombs now serves as Executive Chairman and his responsibilities as Managing Director have been transferred to the Chief Executive of Advantage Finance and the Chief Executive of Aspen Bridging.”
The “streamlined, non-bureaucratic, management structure” manifests itself through just five main board meetings and one remuneration meeting:
10) DIRECTORS’ REPORT
Confirmation the maximum number of directors is 10:
“The Board may appoint a director during the year and until the dissolution of the next AGM as long as the maximum number of 10 directors is not exceeded.“
11) INDEPENDENT AUDITOR’S REPORT
A few changes here for 2023.
a) Key audit matters
The key audit matters remain i) measuring loan impairments and ii) revenue recognition.
Measuring loan impairments included some fresh text that indicated the calculations were becoming “even more challenging:”
“The estimation of expected credit losses (ECL) on loans and advances to customers is complex and inherently judgemental. The models require probabilities of default (PD), loss given default (LGD) and exposures at default (EAD) to be determined, as well as significant increase in credit risk (SICR) triggers, that are altogether adjusted to take into account probability weighted forward looking economic scenarios. In the financial year, this has been made all the more challenging by inflation hitting 11% and the cost of living crisis putting additional financial pressure on household finances and their ability to service debt. The unprecedented economic environment is making modelling even more challenging, resulting in the Group applying post model adjustments to its macroeconomic scenarios.”
New tasks for the auditor for this key matter were:
”* Performing a stand back assessment of the resulting ECL estimates to assess its appropriateness; and
* Assessing the adequacy of the Group’s disclosures in relation to ECL.”
The revenue-recognition key audit matter did not carry any notable text changes.
b) Scope and materiality
A full-scope audit was undertaken on 100% of the group (parent company, Advantage Finance and Aspen Bridging).
Overall materiality was set to the standard 5% of pre-tax profit.
However, performance materiality was set to 65% (vs 60% for 2022) of overall materiality and included some new text that, while not alarming, did not read quite well:
“ We set performance materiality at £1.3m (2022: £1.4m), which represents 65% (2022: 60%) of overall materiality. In determining the performance materiality, we considered a number of factors, including the effectiveness of internal controls and the history of misstatements, and concluded that an amount toward the upper end of our normal range was appropriate.”
12) ACCOUNTING POLICIES
a) Financial assets and financial liabilities
New text clarifying how the group’s loans are classified for accounting purposes (“amortised cost“):
“1.3 Financial assets and financial liabilities accounting policy
When initially recognising a financial asset it is classified into one of the following three categories based on the group’s business model for managing that asset and the asset’s contractual cash flow characteristics:
i) Amortised cost – a financial asset is measured at amortised cost if both of the following conditions are met:
a) The asset is held within a business model whose objective is to hold assets in order to collect contractual cash flows;
and
b) The contractual terms of the financial asset give rise on specified dates to cash flows that are payments of principal and interest on the principal amount outstanding.
ii) Fair value through other comprehensive income – financial assets are classified and measured at fair value through other comprehensive income if they are held in a business model whose objective is achieved by both collecting contractual cash flows and selling financial assets.
iii) Fair value through profit or loss – any financial assets that are not held in one of the two business models mentioned are measured at fair value through profit or loss.
The group has classified its financial assets and its financial liabilities as measured at amortised cost.”
b) Impairment and measurement of amounts receivable from customers
Revised text for Stage 2 impairments, which confirms pandemic payment-holiday customers are now classified within a different Stage or are no longer a customer:
“Stage 2 currently includes customers who have a good payment record but have been identified as vulnerable by trained staff. Vulnerability can be driven by factors including health, life events, resilience or capability. All customer facing staff are trained to help recognise characteristics of vulnerability. Stage 2 previously included some pandemic payment holiday customers but these customers have all now had 12 months to re-establish their post holiday payment track record and are therefore now either correctly included in another stage or their agreement has finished.”
Stage 1 customers are those with up-to-date payments, Stage 2 customers are those with up-to-date payments but have been identified as “vulnerable” to missing future payments, and Stage 3 customers are those that are behind on their payments.
c) Macroeconomic overlay for our motor finance business
A new IFRS 9 overlay for 2023:
For unemployment, the weighted scenario averages for Q1s 2023, 2024 and 2025 are 4.29% (was 4.75%), 4.97% (was 5.20%) and 5.65% (unchanged). So minor changes.
For inflation, the weighted scenario averages for Q1s 2023, 2024 and 2025 are 10.96% (was 5.88%), 3.39% (was 2.37%) and 1.13% (was 1.81%). So a significant change for Q1 2023, which underlines the suggestion SUS was caught out by rising rates and inflation. The weighted-average inflation projection for Q1 2026 is only 0.45%, which seems very bold but obviously possible.
As per the blog post above, SUS introduced new overlays relating to used-car prices for its impairment assumptions.
“Used vehicle price overlay and sensitivity for our motor finance business
Our used vehicle price overlay is based on used vehicle guide price information and the mileage and condition of each vehicle is estimated which is uncertain. It is also based on an uncertain assumption at 31.1.23 that used car prices which increased significantly in 2021 and 2022 will fall by 13.5%. This used vehicle price overlay has increased loan loss provisions at 31.1.23 by £6,656,000 (2022: increased provisions by £4,552,000). If used car prices were only assumed to fall by 8.5% instead, then this would result in a decrease in loan loss provisions of £2,815,718. If used car prices were assumed to fall by 18.5% instead, then this would result in a further increase in loan loss provisions of £2,717,750.”
Assuming used-car prices fall 13.5% appears very conservative.
The overlay calculations now also include projections for Aspen Bridging:
“Expected loss sensitivity for our property bridging business
The PD/LGD expected loss impairment provision model calculations developed for our Aspen bridging business have been based on extrapolating an inherently low volume sample of historic defaults and losses to reflect the current receivables and current market conditions. If the probability of default were assessed to be 10% higher than these calculations then this would result in an increase in loan loss provisions of £290,727. If the probability of default were assessed to be 10% lower than these calculations then this would result in a decrease in loan loss provisions of £290,727.”
13) SEGMENTAL ANALYSIS
The segmental split of assets and liabilities indicates how the group is structured for the board to make its ‘capital allocation’ decisions:
Debt is held within the parent company, and the borrowed money is then lent internally to both divisions as required. The positive c£70m liabilities for the Central segment reflect the sums owed by the two divisions to the parent company. Both divisions transfer their profits (via an internal dividend) to the parent company and then the board allocates those profits, either to i) reinvest into the same division, ii) invest in the other division, iii) reduce debt, or iv) pay out as a dividend.
14) EMPLOYEES
Average wage and total cost per employee was £47k and £54k respectively:
Both figures are a fraction higher than the equivalents for FY 2022 and a bit higher than those for FYs 2019, 2020 and 2021, but match those for FYs 2017 and 2018. So employee expenses have generally been kept under control. As per the blog post above, the motor-finance workforce has not really shown great productivity improvements on a gross-receivables and interest-received basis.
15) AUDIT FEES
Audit fees are vey much under control at less than 0.2% of revenue (£163k/£102.7m):
16) FINANCE COSTS
This note is becoming increasingly important as interest rates rise and profit (as per the 09 February warning) falls:
Bank interest of £7,342k versus average year-end debt of £154.5m ((£113.6m+£195.5m)/2) = 4.8%.
The Companies House archives show the 31.5% preference shares were introduced during FY 1985 after being converted from the then 17.5% cumulative participating preference shares. The £141k dividend payable on these legacy instruments absorbed 31% of underlying earnings in FY 1985, but for FY 2023 thankfully absorbed only 0.4%.
Management was asked about redeeming the preference shares on a webinar the other year, but said the group’s money could be invested at a better rate in the business.
17) AMOUNTS RECEIVABLE FROM CUSTOMERS
a) Stage 2 customers
More clarity on the Stage 2 customers:
“The credit risk inherent in amounts receivable from customers is reviewed as per note 1.5 and under this review the credit quality of assets which are neither past due nor impaired was considered to be good with the exception of 473 vulnerable or Covid impacted payment deferral customers who although not in arrears at 31.1.23 were assessed from a review of internal data to have a significant increase in credit risk (2022: 1,688). Under IFRS9 therefore these customers although not in arrears are included in stage 2 at 31.1.23 with an increased impairment provision.”
b) Stage 3 customers
This table underlines the risks of used-car financing. Motor customers that are now in arrears are still due to repay original loans totalling £116m yet SUS expects to retrieve only £47m:
As per the blog post above, at least that £47m is underpinned by the £65m value of the cars (before recovery and disposal costs) associated with the loan agreements:
“Motor finance – except for loans valued at £4.658m (2022: £4.103m), where we are aware the security is held on a used vehicle for each hire purchase motor finance agreement. As stated in used vehicles secured under our hire purchase agreements is uncertain as the condition and mileage of the used vehicle are unknown. We estimate the trade value of collateral held at 31.1.23 for motor finance loans currently in stage 3 was £64.5m (2022: £59.0m) – these estimated values are stated before taking into account recovery and disposal costs.”
Collateral for Stage 3 property customers is £13.4m — or 2x the £6.6m SUS expects to retrieve (£7,073k lent less £422k provision):
“Property bridging finance – the estimated value of first charge secured properties held under our bridging loan facility agreements at 31.1.23 is £184.7m (2022: £107.0m). This includes £13.4m estimated value of properties secured which is held for loan agreements currently in Stage 3 (2022: £1.5m).”
The advantages of property lending versus motor lending are properties i) don’t move (and therefore do not go missing) and ii) tend to increase in value.
18) BORROWINGS INCLUDING BANK OVERDRAFTS AND LOANS
As per the blog post above, SUS does not disclose the type of borrowings (e.g. fixed or variable etc) nor their interest-rate costs:
The lack of disclosure is very poor form, given how interest expenses have since risen and profit (as per the 09 February warning) is set to decline.
19) SHARE BASED PAYMENTS
No concerns here:
The last options from the old LTIP have been exercised and no more such options can be granted. Only shadow options — essentially a cash bonus based on the value of a ‘proper’ nil-cost option — are now issued and these of course do not dilute shareholders while their accounting value is the actual cash cost not some theoretical calculation.
20) RETIREMENT BENEFIT OBLIGATION
This scheme remains trivial:
Plan assets of almost £1.1m paid benefits of £38k, and SUS with earnings of £33m for FY 2023 should have the resources to keep the benefits flowing even if the plan assets erode entirely. The scheme has been closed to new members for than 40 years and the beneficiaries are not directors nor employees.
Maynard