01 April 2022
By Maynard Paton
Happy Friday! I trust your shares have performed better than mine so far this year.
A summary of my portfolio’s first quarter:
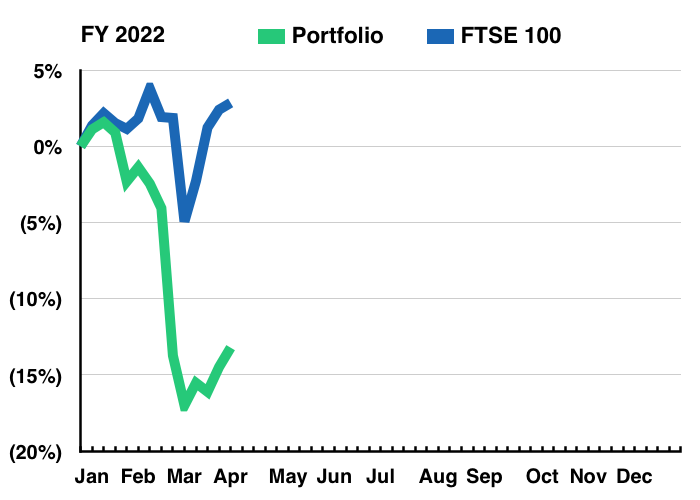
- Q1 return: -13.2% loss* (FTSE 100: +2.9% gain).
- Q1 trades: None.
- Q1 winners/losers: 0 winners vs 11 losers.
(*Performance calculated using quoted bid prices and includes all dealing costs, withholding taxes, broker-account fees and paid dividends)
My portfolio’s 13.2% Q1 drop is sadly my worst three-month performance since I commenced this blog at the start of 2015. My largest three-month declines prior to this year were 11% during August, September and October 2018 and 8% during January, February and March 2020.
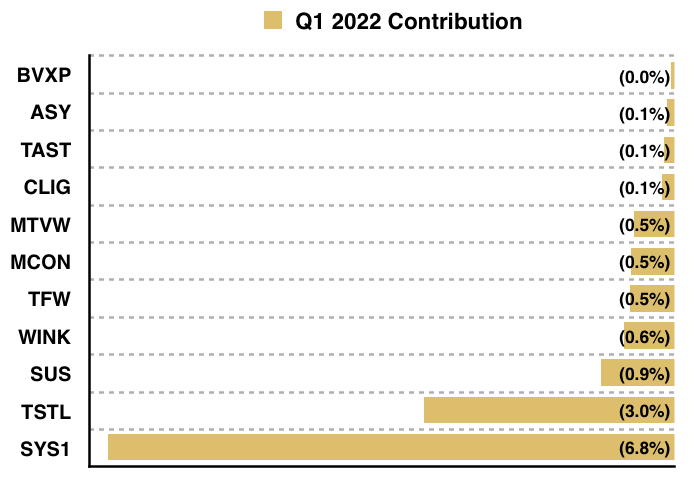
The primary cause of my Q1 reversal was a profit warning from (by far) my largest holding, System1. Not helping matters were underwhelming results from (what was) my second-largest holding, Tristel.
The rest of my portfolio seems to have suffered from the market’s general unease towards smaller companies.
Still, company news within my portfolio was not all doom and gloom. City of London Investment, FW Thorpe and M Winkworth were particular highlights after each declared special dividends to underpin some confidence about their immediate futures.
But I confess none of my investments has issued startling results during this Q1; many RNSs have instead referred to ongoing repercussions from the pandemic and higher operating costs. I have my fingers crossed a mix of respectable competitive positions, capable managers and asset-rich balance sheets can limit further portfolio damage.
I have summarised below what happened to my portfolio during January, February and March. (Please click here to read all of my previous quarterly round-ups). I will then outline how to identify companies that could be vulnerable to surging energy prices.
Contents
- Disclosure
- Q1 share trades
- Q1 portfolio news
- Q1 portfolio returns
- Surging energy prices and the companies most vulnerable
Disclosure
Maynard owns shares in Andrews Sykes, Bioventix, City of London Investment, Mincon, Mountview Estates, S&U, System1, Tasty, FW Thorpe, Tristel and M Winkworth. This blog post contains SharePad affiliate links.
Q1 share trades
None.
Q1 portfolio news
As usual I have kept an eye on all of my shareholdings. The Q1 developments are listed below:
- Standstill earnings but the dividend raised 21% at Bioventix.
- Flat funds under management alongside a special dividend at City of London Investment.
- Profit up 10% and a special dividend at FW Thorpe.
- Upbeat trading and a special dividend at M Winkworth.
- Encouraging commentary mixed with unchanged profit at Mincon.
- A record annual dividend and confident remarks from S & U.
- A profit warning due to reduced ‘legacy’ consultancy work at System1.
- Ambitious talk of opening new restaurants from Tasty.
- Subsidiary closures plus greater US sales opportunities at Tristel.
- Nothing of significance from Andrews Sykes and Mountview Estates.
Q1 portfolio returns
The chart below compares my portfolio’s weekly 2022 progress to that of the FTSE 100 total return index:
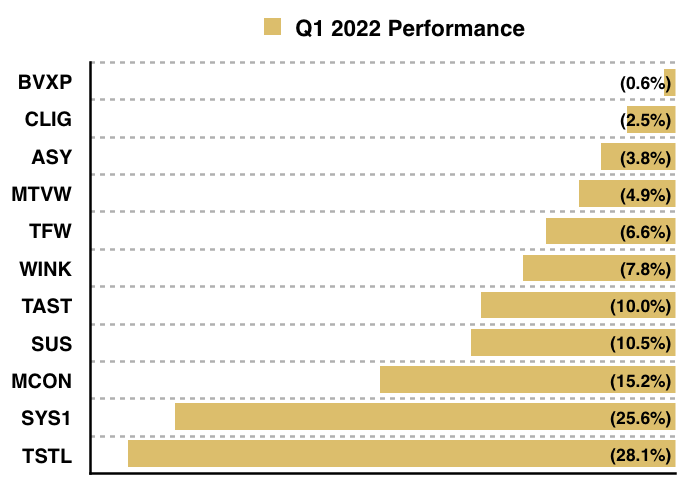
The next chart shows the total return (that is, the capital gain/loss plus dividends received) each holding has produced for me year to date:
The following chart shows each holding’s contribution towards my portfolio’s 13.2% decline:
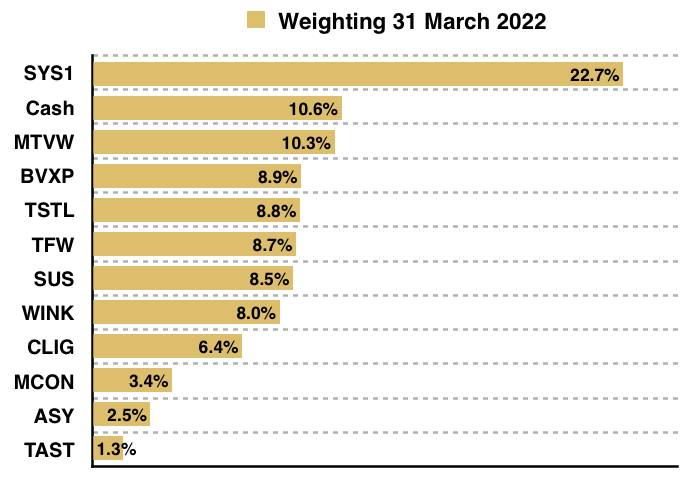
And this chart confirms my portfolio’s holdings and their weightings at the end of Q1:
Surging energy prices and the companies most vulnerable
You don’t need me to tell you that prices for gas and electricity have surged during recent months:
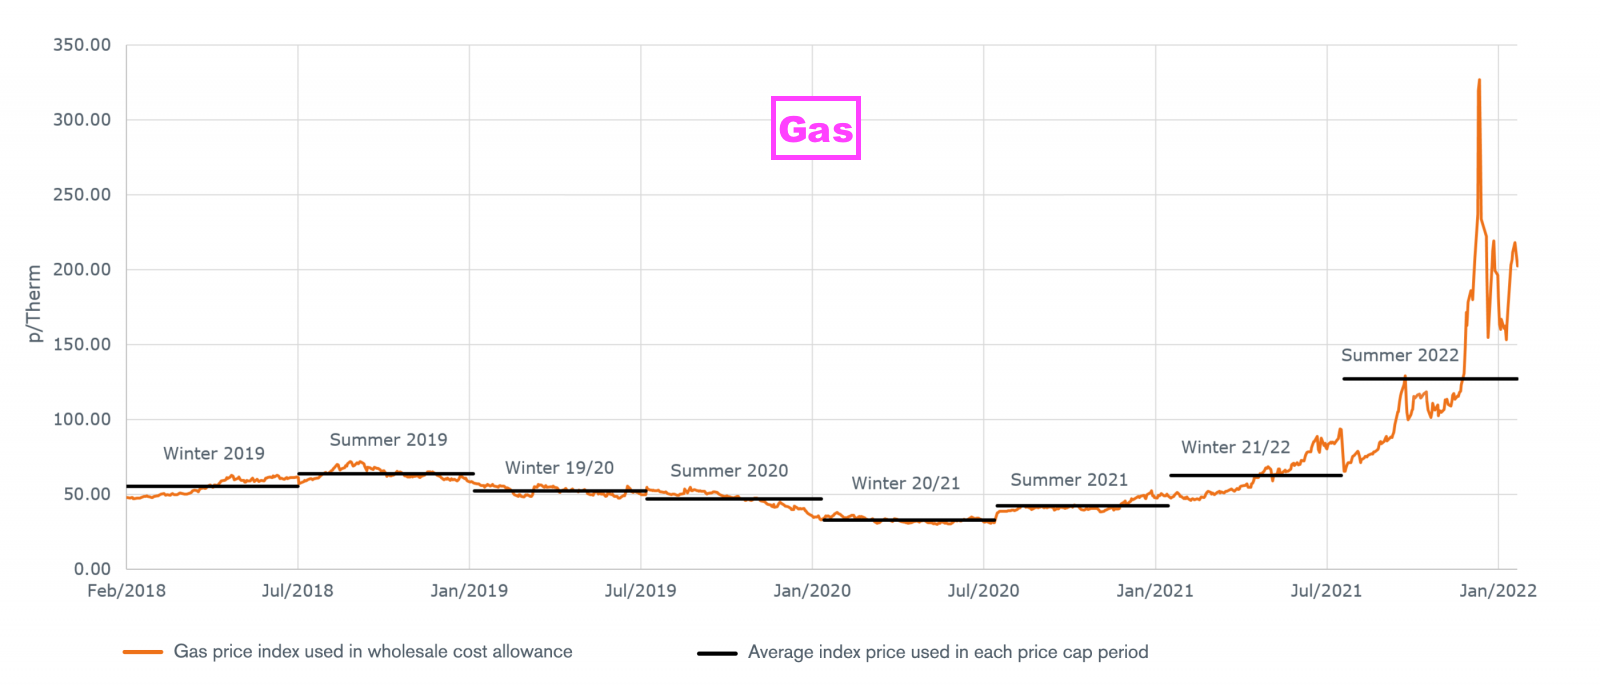
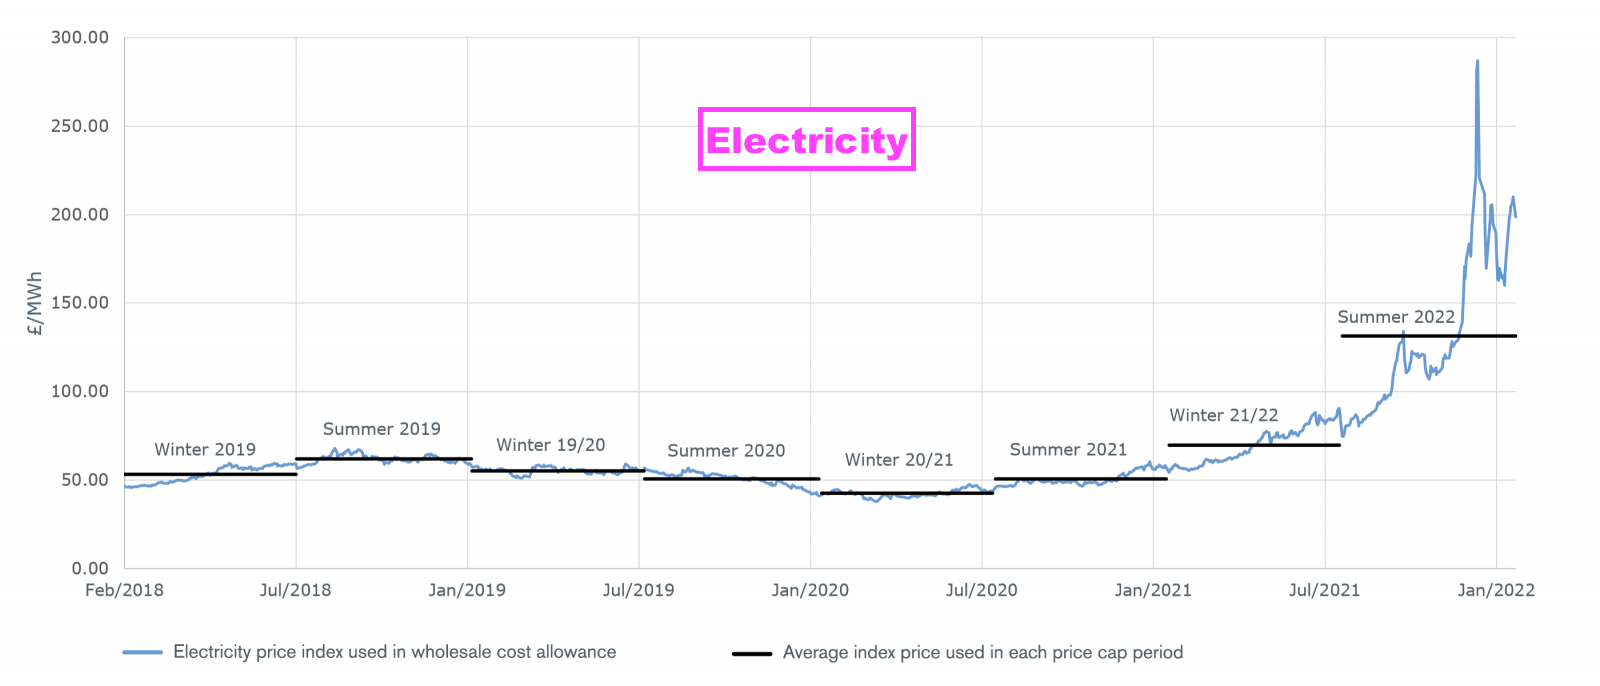
OFGEM reckons household energy bills will today increase by an average £693 a year after what the regulator described is a “once in a 30-year event“.
Consumers are of course protected by OFGEM’s price caps…
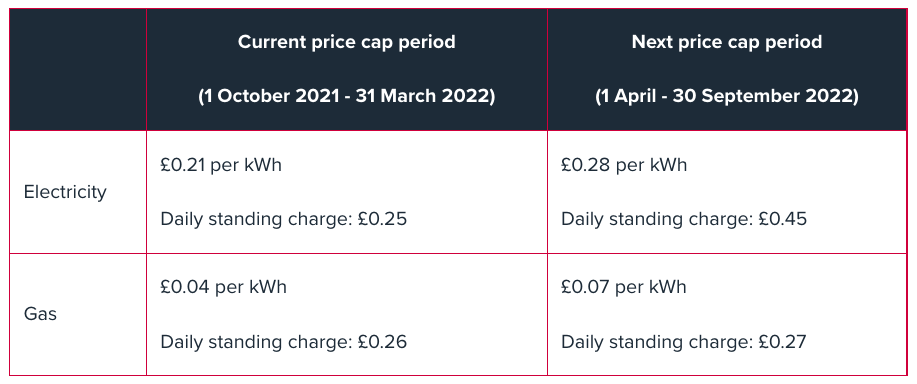
…but businesses have no such protection. Many quoted companies are therefore referring to higher energy costs within their results. Recent examples include:
Bodycote: “The Group saw inflationary pressure build through the year, most notably in energy costs during the second half.”
James Cropper: “The start of the Russia/Ukraine conflict and the resulting jump in energy costs has, however, significantly affected Paper, which is by far our most energy-intensive division…“
Ocado: “EBITDA margins will reflect the same key factors as those outlined in the Q4 Trading Statement, and may be further impacted by the significant increases in energy costs where uncertainty remains.“
Reach: “We began to see the impact of increasing inflation towards the end of the year, particularly in the cost of newsprint, which is being heavily impacted by rising energy costs. We expect this to continue in 2022.“
Robinson: “We have seen sharp increases in global oil and energy costs which will flow through to polymer resin and other raw material prices and impact our costs.”
Strix: “In addition to increases in line with sales, the main drivers of increase in costs were higher commodity and labour costs, increased inward carriage and freight costs, and higher energy costs, all following general global inflationary trends as the world recovered from the pandemic“
We of course want to know whether our shares are vulnerable to higher energy costs before the bad news emerges via an RNS!
The Streamlined Energy and Carbon Reporting regulations
Help comes from the Streamlined Energy and Carbon Reporting (SECR) regulations, which were introduced during 2019 and require all quoted companies to disclose their energy usage and greenhouse gas emissions.
Andrews Sykes provides a good example of the SECR information that should be contained within the annual report:
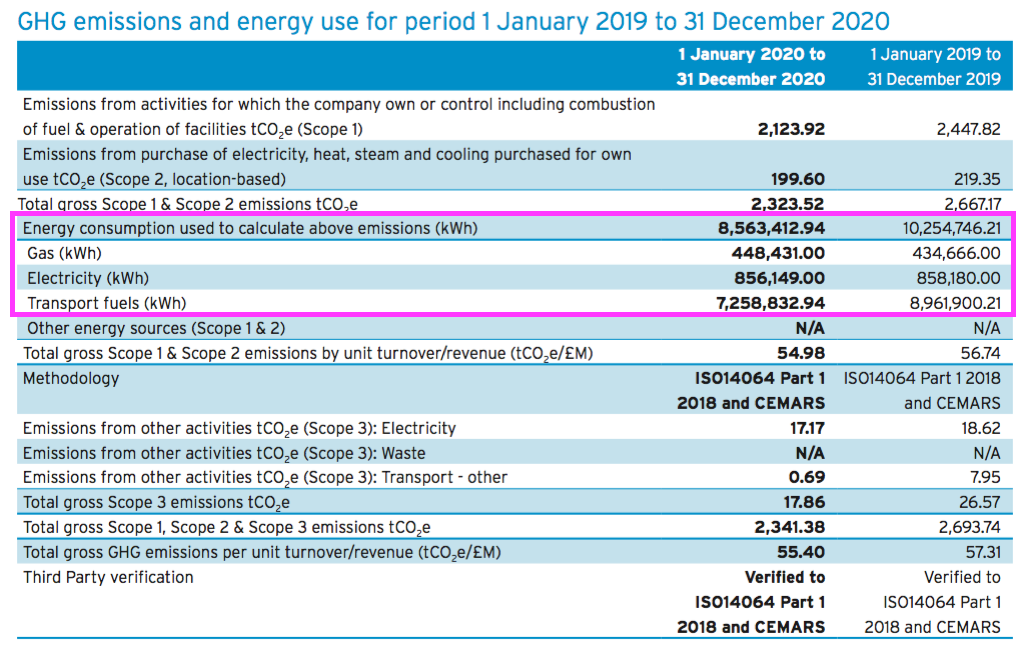
The total kWh figure for gas, electricity and transport fuel can then be compared to revenue, with those companies consuming the most energy but generating the least sales being at greater risk of rising energy costs eventually hitting profits.
The table below lists the eleven shares in my portfolio, and compares each company’s revenue to the energy usage disclosed within the annual report:
| Company | Year to | Revenue (£m) | Energy (mWh) | Revenue per kWh (£) |
| Andrews Sykes | Dec 2020 | 67.3 | 8,563 | 7.85 |
| Bioventix | June 2021 | 10.9 | not disclosed | - |
| City of London Inv | June 2021 | 55.1 | 402 | 137.12 |
| FW Thorpe | June 2021 | 117.9 | 7,430 | 15.86 |
| M Winkworth | Dec 2020 | 6.4 | not disclosed | - |
| Mincon (*€m) | Dec 2021 | 114.4* | not disclosed | - |
| Mountview Estates | Mar 2021 | 65.7 | not disclosed | - |
| S & U | Jan 2021 | 83.8 | not disclosed | - |
| System1 | Mar 2021 | 22.8 | not disclosed | - |
| Tasty | Dec 2021 | 34.9 | 12,872 | 2.71 |
| Tristel | June 2021 | 31.0 | not disclosed | - |
As is so often the case with quoted companies, their interpretations of the same disclosure requirements differ widely.
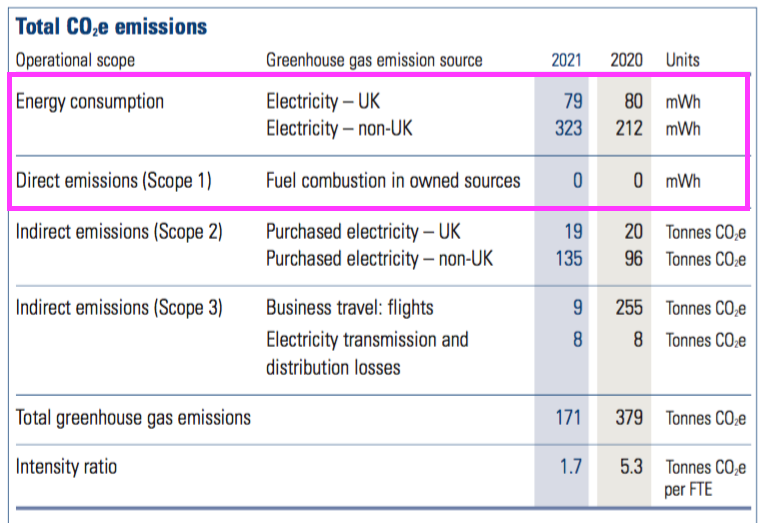
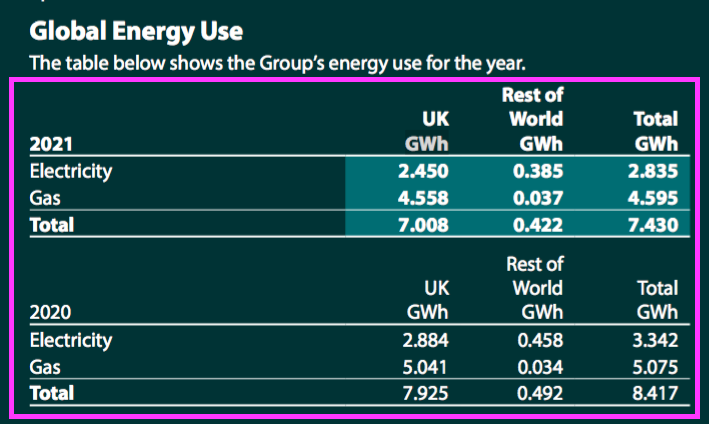
Only City of London Investment and FW Thorpe matched the level of disclosure shown by Andrews Sykes:
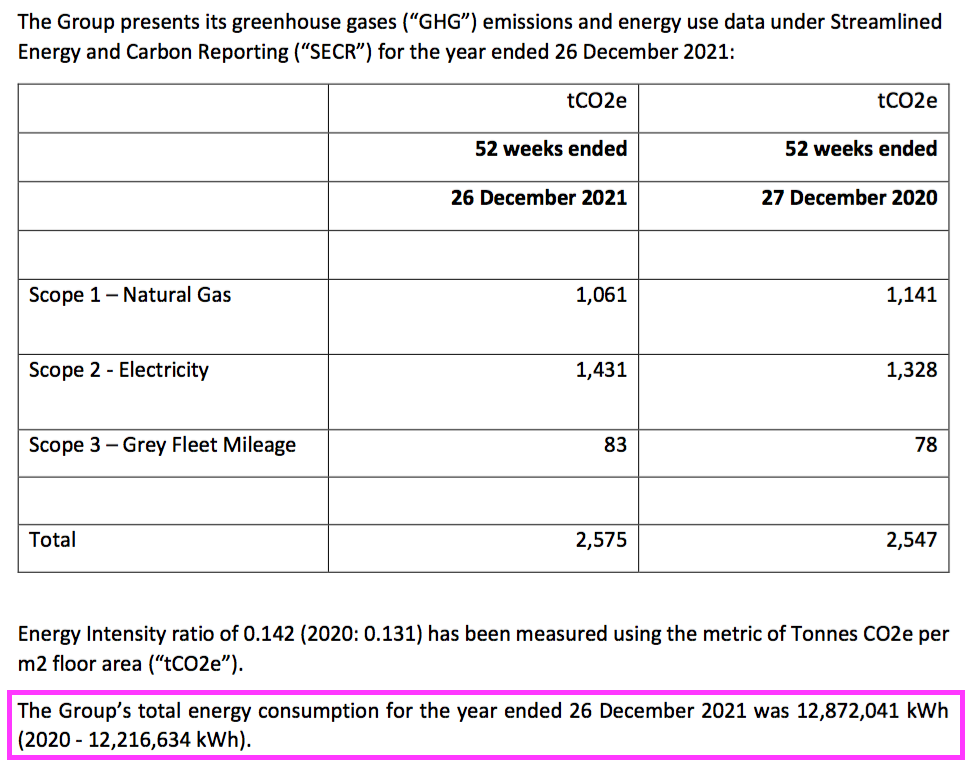
Tasty meanwhile gave a total kWh figure, but did not provide separate kWh numbers for gas and electricity:
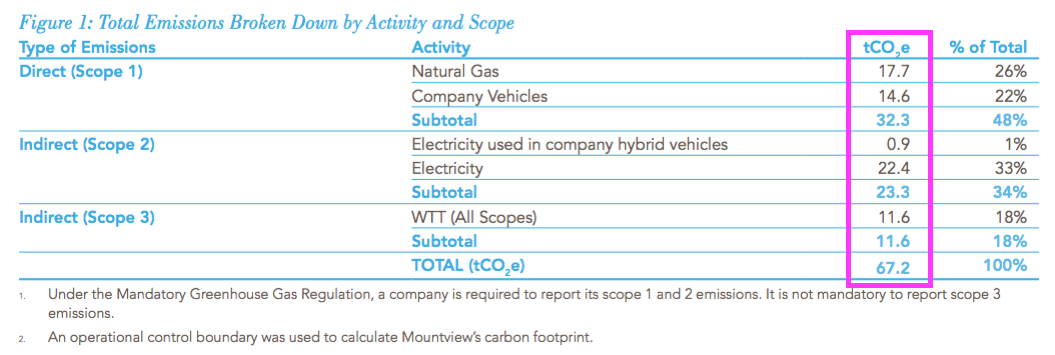
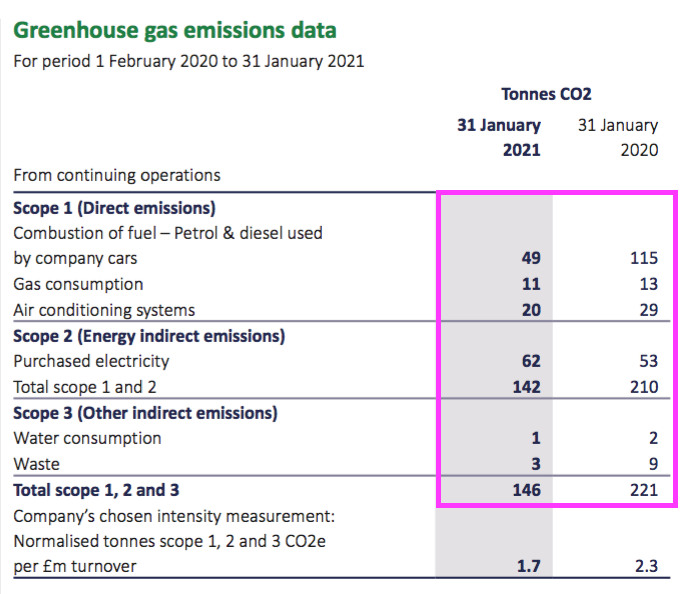
Of the seven not providing any kWh figures, Mountview Estates and S & U supplied emission data that can then be converted from tonnes of carbon dioxide (tCO2) into kWh:
But why my other five shares disclosed no SECR data whatsoever is a mystery.
(Note: The SECR regulations do allow for “low energy users” — companies that consume less than 40,000 kWh a year — to disclose they are a “low energy user” and skip the reporting requirements. 40,000 kWh is the equivalent annual consumption of a few residential properties.)
At least Mincon looks set to disclose its SECR numbers this year:
“We are in the process of conducting a detailed review of our carbon emissions and will be reporting on this and associated reduction targets in the first half of 2022″
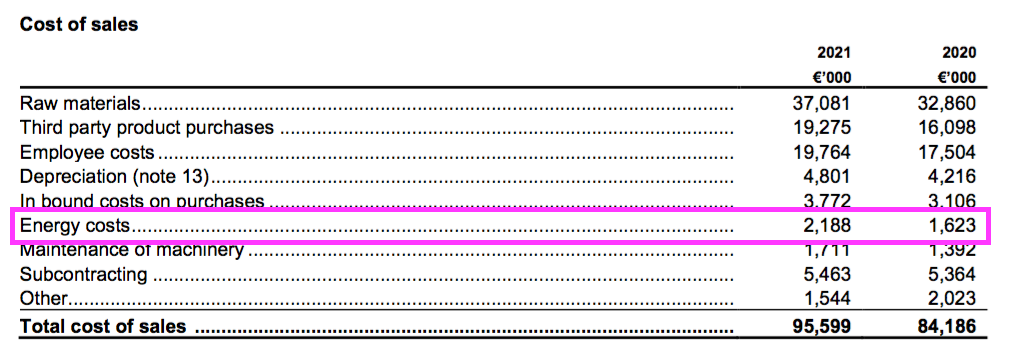
The drill manufacturer commendably reports its actual energy costs:
Among my other shares, Bioventix and Tristel did report some energy-saving measures within their small print:
Bioventix: “We adhere strictly to the specified maintenance schedules for laboratory and other equipment and have recently completed significant refurbishment of the facilities ensuring that replacement equipment, for example our cold storage, freezers and autoclave, and showers and toilet facilities, have improved water utilisation and energy efficiency“
Tristel: “Transfer of the Groups energy providers, wherever possible, to renewable energy tariffs, installation of LED lighting and implementation of other energy saving initiatives.“
System1 and M Winkworth meanwhile provided no SECR data and no energy-saving snippets. Both are office-based businesses though, which should mean consumption levels are relatively low.
From my table above, Tasty appears the most vulnerable to higher energy prices. But a larger sample is needed to provide greater perspective.
SharePad companies
This next table lists 16 companies I have reviewed for SharePad and their respective revenue and energy-consumption figures:
| Company | Year to | Revenue (£m) | Energy (mWh) | Revenue per kWh (£) |
| Fuller, Smith & Turner | Mar 2021 | 73.2 | 42,296 | 1.73 |
| Goodwin | Apr 2021 | 131.2 | 69,737 | 1.88 |
| Victrex | Sept 2021 | 306.3 | 131,954 | 2.32 |
| Greggs | Dec 2020 | 811.3 | 269,193 | 3.01 |
| James Halstead | June 2021 | 266.4 | 68,377 | 3.90 |
| AG Barr | Jan 2021 | 227.0 | 46,494 | 4.88 |
| Avon Protection | Sept 2021 | 248.3 | 33,911 | 7.32 |
| Domino's Pizza | Dec 2020 | 505.1 | 63,641 | 7.94 |
| Headlam | Dec 2021 | 667.2 | 66,081 | 10.10 |
| Renishaw | June 2021 | 565.6 | 51,800 | 10.92 |
| Games Workshop | May 2021 | 353.2 | 16,597 | 21.28 |
| JD Sports Fashion | Jan 2021 | 6,167.3 | 187,178 | 32.95 |
| ASOS | Aug 2021 | 3,910.5 | 55,873 | 69.99 |
| Focusrite | Aug 2021 | 173.9 | 1,745 | 99.67 |
| Boohoo | Feb 2021 | 1,745.3 | 12,718 | 137.24 |
| Fever Tree | Dec 2020 | 252.1 | 115 | 2,195.42 |
Tasty with revenue of £2.71 per kWh consumed does indeed seem more exposed to higher energy prices than most companies.
True, a lot of businesses — including Tasty — suffered during the pandemic and their revenue per kWh consumed may well be temporarily distorted. Comparisons within the same sector are nonetheless quite instructive.
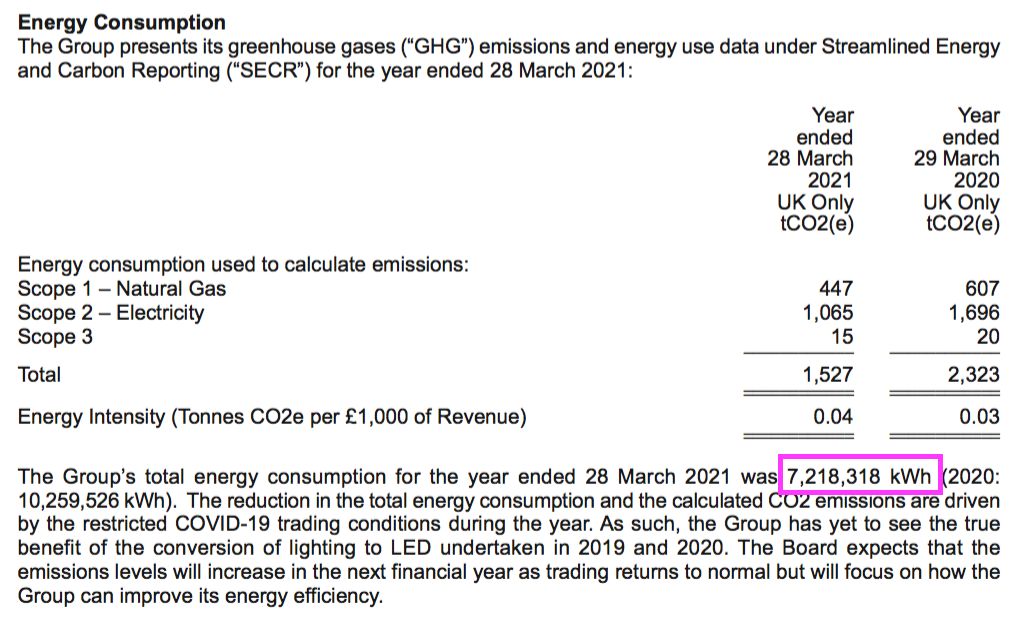
For example, during the year to March 2021 fellow restaurant chain Fulham Shore earned revenue of £40.3m and consumed total energy of 7.2 million kWh. Revenue per kWh consumed was therefore £5.58 — more than double that of Tasty:
Quite why Tasty consumes so much more energy relative to revenue than Fulham Shore is not clear to me. No wonder Tasty cited within its recent results:
“As part of our ongoing energy efficiency programme there has been a focus on energy saving“
Tasty also referred to “utility price volatility” as a challenge to possible profits:
“…2022 will not be without its challenges with labour shortages, food inflation, the ending of Government support in terms of reduced VAT and business rates and utility price volatility, impacting profitability.“
How much extra will businesses have to pay?
Good question. Clear answers are hard to find, but some companies do give useful guidance. Restaurant Group for example has admitted:
“Material market-driven increases in electricity and gas will cost the Group an additional £6m to £7m in FY22“
An additional £6m to £7m is not insignificant when Restaurant Group reported an adjusted pre-tax profit of £75m for (pre-pandemic) 2019.
For Tasty and all the other companies where gas and electricity kWhs are not disclosed, emission data can be converted into kWhs using the government’s Greenhouse Gas Reporting: Conversion Factors document.
From my understanding:
- One kWh of natural gas emits 0.183 kilograms of carbon dioxide and;
- One kWh of electricity emits 0.212 kilograms of carbon dioxide;
So for 2021, Tasty emitted:
- 1,061 tonnes of carbon dioxide related to gas purchases (‘Scope 1’), which is equivalent to 5.8 million kWh, and;
- 1,431 tonnes of carbon dioxide related to electricity purchases (‘Scope 2’), which is equivalent to 6.8 million kWh.
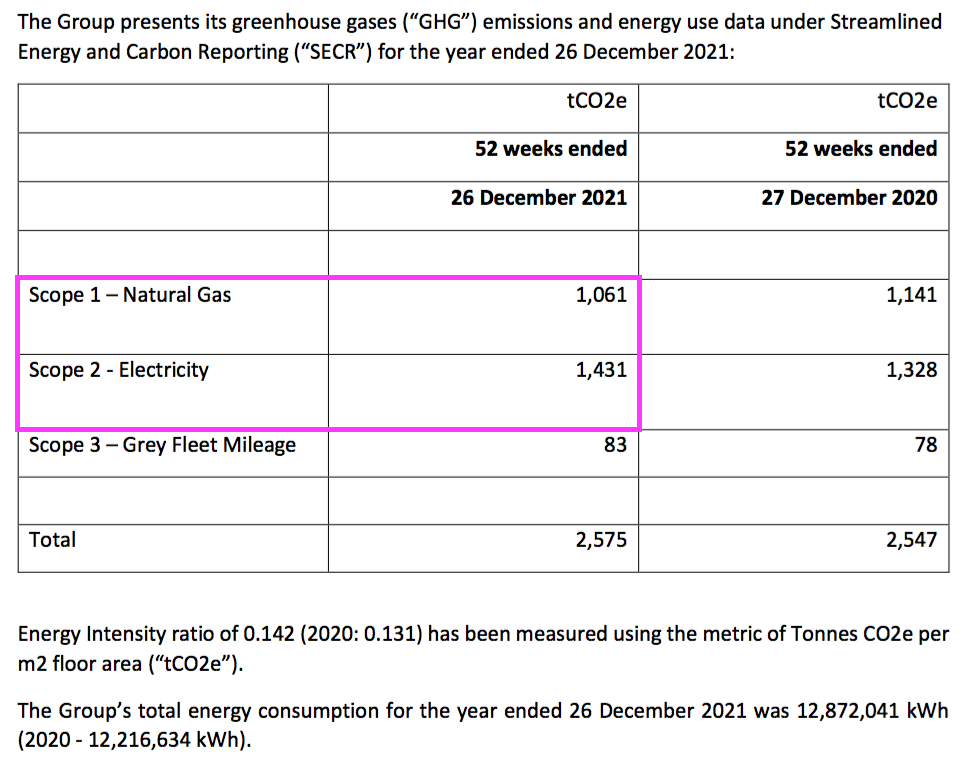
The total of 12.6 million kWh is close enough to Tasty’s stated 12.9 million kWh, and using the following government energy prices for 2021…
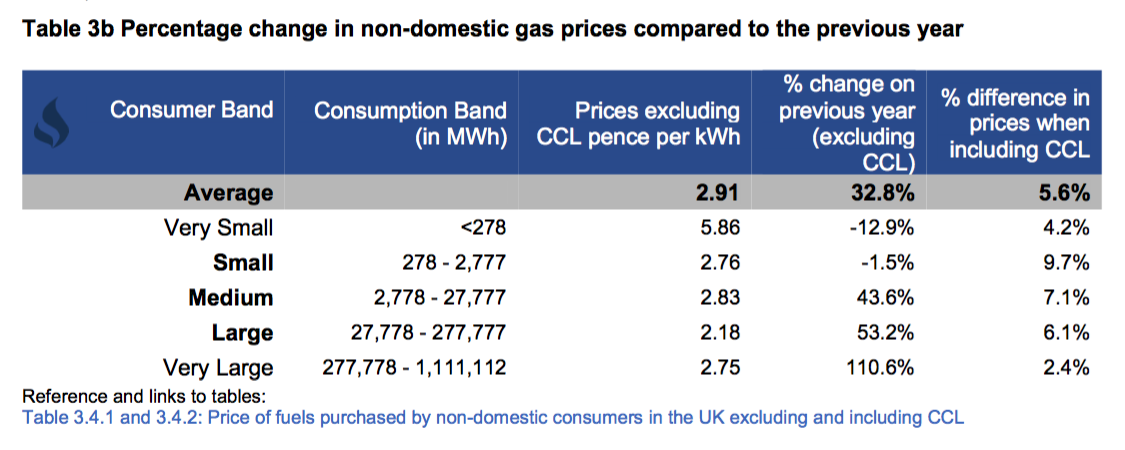
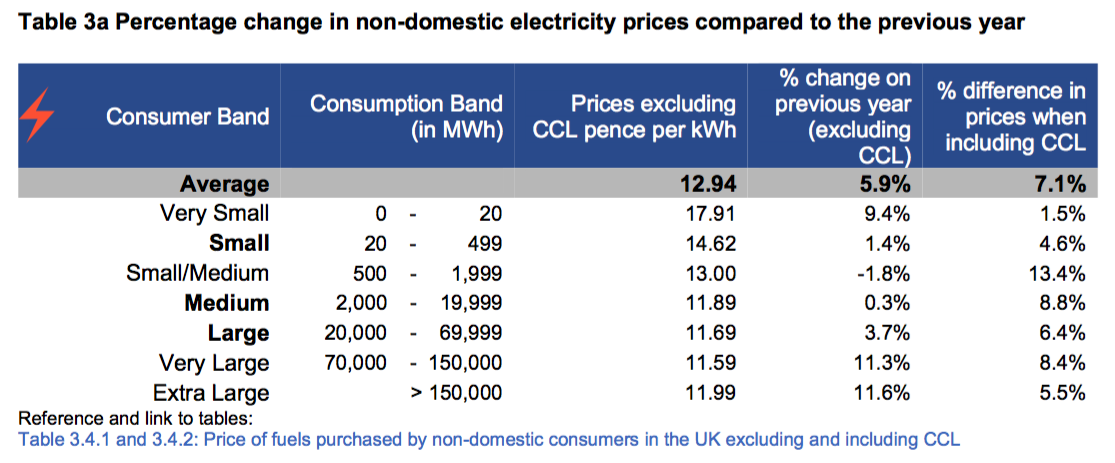
…Tasty may have last year paid:
- 5.8 million * c2.8p per kWh = £160k for gas, and;
- 6.8 million * c12p per kWh = £816k for electricity.
This news item meanwhile reports the hospitality industry facing “skyrocketing” energy price hikes of 95%:
“The joint poll by trade organisations UKHospitality, the British Institute of Innkeeping (BII), the British Beer and Pub Association (BBPA) and Hospitality Ulster revealed that 76% of businesses are mitigating skyrocketing energy costs by reducing their gas and electricity usage and raising prices, while 38% have cut their trading hours.
Average energy price increases of 95% are the latest hurdle the hospitality sector must negotiate as it struggles to recover from the devastating effects of Covid. “
A near-doubling of energy costs for Tasty would mean the group would have to find an extra £1m or so to pay its utility bills — a not insignificant sum when 2021 revenue of £35m led to profit of only £1m.
‘The rule book has been well and truly rewritten’
A friend of mine who co-founded a business energy consultancy tells me:
“Most major energy users didn’t predict prices going to anything like this level, so the rule book has been well and truly rewritten.“
But exactly how a particular quoted company will cope with surging energy costs is almost impossible for outsiders to determine.
My friend revealed larger businesses pay for energy using flexible contracts, whereby differing durations and hedging strategies — alongside volatile wholesale markets! — give an enormous range of pricing outcomes.
Mind you, he did cite “illustrative” current contract prices of 8p per kWh for gas and 40p per kWh for electricity, which are well beyond the 6p and 24p rates I applied to derive that extra £1m bill for Tasty. No wonder my friend says his clients are not locking in energy prices beyond this year.
For now at least, the SECR data ought to provide some idea of which companies are most at risk from surging energy prices causing lower profits. Just find the kWh info within the annual report, plug in some unit prices…
…and see for yourself the potential impact of higher utility bills at your investments.
Until next time, I wish you safe and healthy investing.
Maynard Paton

Hi Maynard,
Commiserations on a poor Q1 performance; you are definitely not alone!
On the topic of energy price inflation and its impacts on specific companies – as you say, it’s very hard to know what the impact will be and digging into the specifics of each company might not help that much.
Very simply, I’d say it boils down to the company’s ability to pass increasing costs onto customers. Some companies will have to phase in price increases over several years (e.g. Unilever, which is one of my holdings) and others can pass the costs straight on (e.g. distributors of various kinds).
It’s interesting that you mention Bodycote, as I own a small slice of that company. Bodycote’s argument is that inflation won’t be a problem because companies effectively outsource their heat treatment processes to Bodycote, and since Bodycote can carry out these processes more efficiently (i.e. using less fuel) than its customers, the higher the energy price the more incentive there is for customers to outsource to Bodycote.
We’ll have to see whether that actually happens or not, but it’s an interesting point of view that rising energy prices aren’t necessarily a bad thing for every company and can even be a positive.
John
Hi John
Thanks for the message.
Yes, passing on higher energy costs to customers is one consideration. But perhaps not having high energy usage in the first place may be a better option for investors!
Mind you, companies without high energy usage (e.g. online retailers) may be customers of companies with high energy usage (e.g. delivery firms with fuel expenses etc), and so may well suffer higher costs that way.
So, not easy to decipher what exactly is going on, what will happen and who eventually foots the bill. But at least I have a better understanding of energy use at my holdings and where problems are more likely to emerge.
Maynard
Thanks Maynard – yes, you are not alone. My portfolio is down 7% versus a level FTSE All-share which is my worst quarter ever. I think the only winners really are large-cap commodity heavy portfolios. Small-caps have been awful.
Thanks Simon. I would take -7% as my worst quarter ever!
Maynard
Hi Maynard
Thank you for the in depth and honest review, which are always interesting. We only have BVXP in common, which I have held since 2015 and is showing a tidy profit.
Like you I am down 10.2% with 4 winners and 9 losers. Unfortunately two of my largest holdings BOO and AAZ (well Boohoo is now one of my smallest holdings) have been hit very hard. While I think there is little sense to the amount these stocks have sold off (falls from one year highs range from 74.3% to 13.2% companies like VLX and GAW of -40%) and I believe they will all come back in my time frame.
With all that said I have decided that I need to pivot away from an all small cap centric portfolio (I do hold GAW and BOO but to be honest they behave like small caps) and balance it with larger cap US and possibly EU large cap stocks. To that end I have started buying BRK.B, SP500 ETF and a small basket of large tech. Maybe this will signal the top of US mega cap tech :-).
Basically going try to follow Buffett’s tenet of buying amazing companies at reasonable prices and hopefully have a portfolio with slightly less gut-wrenching volatility.
Regards
Michael
Thanks Michael. Yes, the S&P 500 has trounced many hand-picked portfolios over the last 5-10 years and you do have to wonder whether we should all have followed Buffett’s advice about trackers, too. Like every stock picker, I am hopeful my multi-baggers will (one day) arrive and in the meantime try (very hard!) to see price volatility as potential buying opportunities.
Maynard
Adam from AMX Energy Services kindly spoke to me about business energy costs.
He confirmed the subject of business energy costs is complex. As I noted in the blog post above: “My friend revealed larger businesses pay for energy using flexible contracts, whereby differing durations and hedging strategies — alongside volatile wholesale markets! — give an enormous range of pricing outcomes.
Adam mentioned costs can even be dictated the type of meter and differing standing charges. Electricity can be purchased at a single rate, or differing day and night rates, while standing charges for gas meters can vary depending on the volume of gas supply (i.e. larger pipes). Figures below are all ballpark.
Standing charges for energy have risen after energy companies saw their income drop during the lockdowns and wanted to recoup the money lost. Such charges have not been reduced; indeed one example cited involved a company paying £1/day for electricity standing charge a few years ago — now £30/day.
But the standing charge is not the largest energy cost, and can be offset by lower unit prices. The example company would pay 15p/kWh for a one-year contract with a lower standing charge (<£10/day), but pay 13p/kWh for a three-year deal with that £30/day charge. Gas prices three years ago were 3p/kWh and by April 2020 and the first lockdown had dropped below 2p and contract prices as low as 1.3p were achieved. Now looking at 7p-10p depending on volume. Electricity is more complex pricing wise, but was 12-14p/kWh for heavy usage and 16-17p for SMEs three years ago. Now 25p for a day rate for heavy users, with SMEs at 30p. Energy contracts can last for 1-5 years. Earlier expectations were for prices to moderate later this year, but now prices are expected to remain elevated until late 2023/early 2024. Talk of companies renewing contracts at double/triple rates versus July 2021 and even +75% for annual contracts renewing later this year. I found this video from EDF explaining in layman terms the options for purchasing energy for businesses: https://www.edfenergy.com/large-business/buy-energy/fixed-contracts
Maynard
Standing charges seem so arbitrary, opaque and unfair. They disproportionately punish those least able to afford energy costs.
The higher the proportion of the standing charges relative to the total bill the more any incentive to reduce energy usage is eroded.
Standing charges could in theory be increased to such a level that the actual energy usage could be given for free!
It seems an almost scam like charge which is impossible to justify as it has no relationship to usage.
Peter
Hi Peter,
Yes, my domestic standing charge for electricity has doubled over the last 18 months! Gas equivalent up 33%. Can’t disagree with your view, at least for standard residential properties. Not sure there is a cap for standing charges either.
Maynard