30 September 2021
By Maynard Paton
Happy Thursday! I trust your shares are flourishing and that you still find my blog useful.
A summary of my portfolio’s third quarter:
- Q3 change: +5:1%*
- Q3 trades: none
- YTD change: 19.0%*
- YTD winners/losers: 9 winners vs 2 losers
(*Performance calculated using quoted bid prices and includes all account fees, dealing costs, withholding taxes and paid dividends)
I am pleased the portfolio gains recorded during the first half of the year were extended during Q3.
Newsflow from my shares has been generally encouraging, and I hope boardrooms will remain optimistic as the pandemic subsides.
This quarter also marked the return (at least for me) to in-person company meetings. I attended the Mountview Estates AGM during August and I plan to attend a Tristel presentation a few weeks from now. While I welcome companies engaging with investors online through webinars, nothing quite beats a face-to-face Q&A!
I have summarised below what happened within my portfolio during July, August and September. (Please click here to read all of my previous quarterly round-ups). I will then explain why I study revenue per employee.
Contents
- Disclosure
- Q3 share trades
- Q3 portfolio news
- Q3 portfolio returns
- Linking revenue per employee to investment success
Disclosure
Maynard owns shares in Andrews Sykes, Bioventix, City of London Investment, Mincon, Mountview Estates, S&U, System1, Tasty, FW Thorpe, Tristel and M Winkworth. This blog post contains SharePad affiliate links.
Q3 share trades
None.
Q3 portfolio news
As usual I have kept watch on all of my shareholdings. The Q3 developments are listed below:
- First-half profit up 14% at Andrews Sykes.
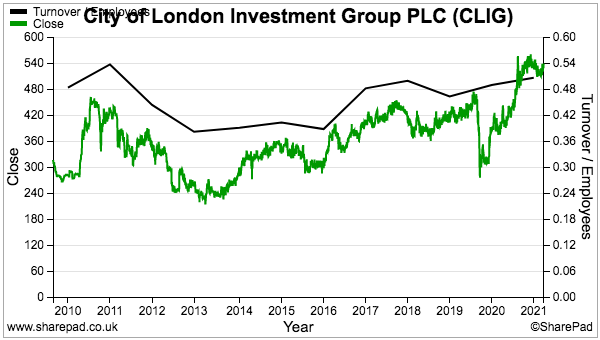
- A 10% annual dividend increase at City of London Investment.
- A special payout and bumper interim earnings at M Winkworth.
- A mixed H1 performance at Mincon.
- Useful AGM snippets at Mountview Estates.
- Upbeat H1 progress at S&U.
- Better-than-expected annual figures/Q1 trading at System1.
- Optimistic results commentary at Tasty.
- Confirmation of ongoing pandemic disruption and a profit shortfall at Tristel.
- Nothing from Bioventix and FW Thorpe.
Enjoy my blog posts through an occasional email newsletter. Click here for details.
Q3 portfolio returns
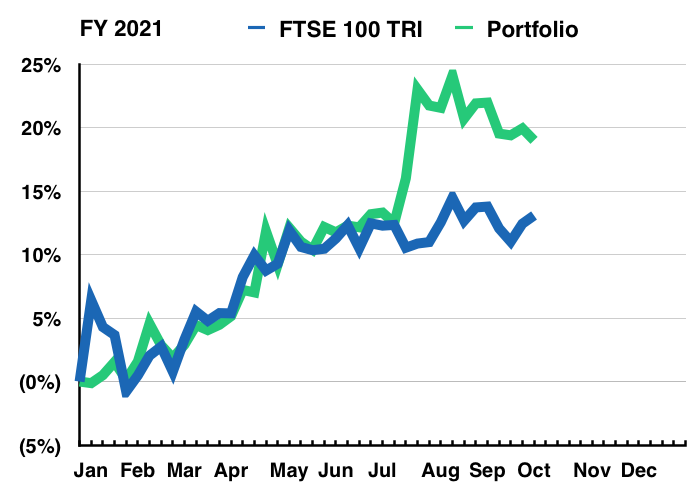
The chart below compares my portfolio’s weekly 2021 progress (in green) to that of the FTSE 100 total return index (in blue):
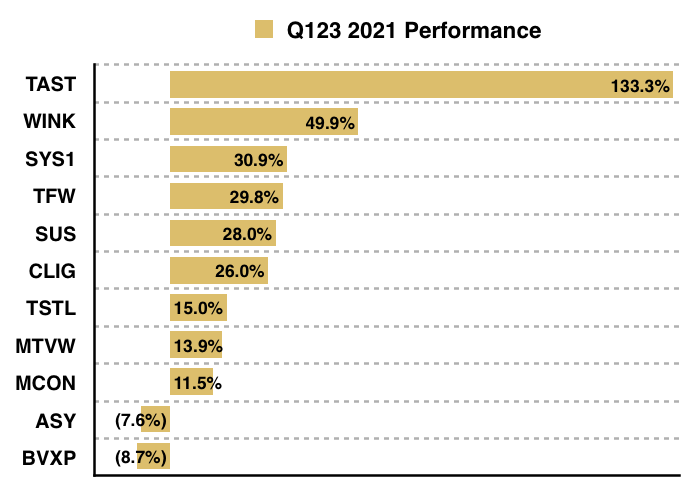
The next chart shows the total return (that is, the capital gain/loss plus dividends received) each holding has produced for me year to date:
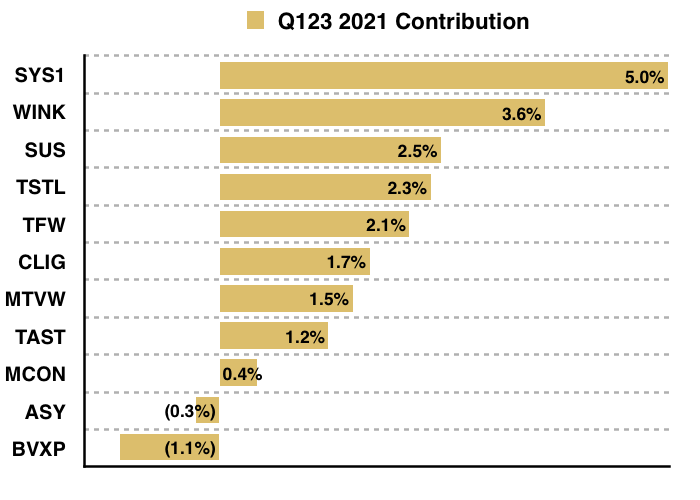
This chart shows each holding’s contribution towards my overall 19.0% gain:
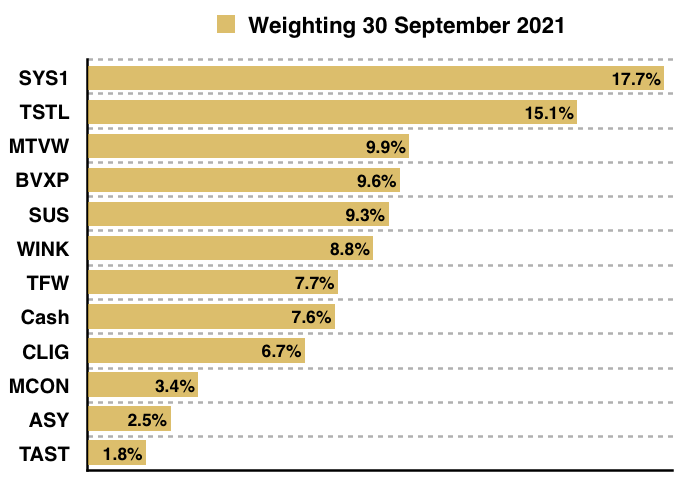
And this chart shows my portfolio’s holdings and their weightings at the end of Q3:
Linking revenue per employee to investment success
Revenue per employee (R/E) is a measure I often consider when studying my shares and companies for SharePad.
The theory is quite straightforward:
- Most competitive advantages today are created by people; the human talent that develops a patent, designs a product, builds a brand or leads a culture.
- Such ‘intangible’ employee advantages can be very difficult to replicate.
- An improving R/E could therefore mean a growing dependence on valuable workforce skills.
R/E should ideally improve as employees develop higher-value products that widen a competitive ‘moat’. That said, R/E can also advance due to greater operational efficiencies or simply through customers readily accepting price increases.
Either way, a more skilful and/or productive workforce ought to benefit shareholders over time.
R/E is very simple to calculate. Employee numbers are always shown in the annual report notes…
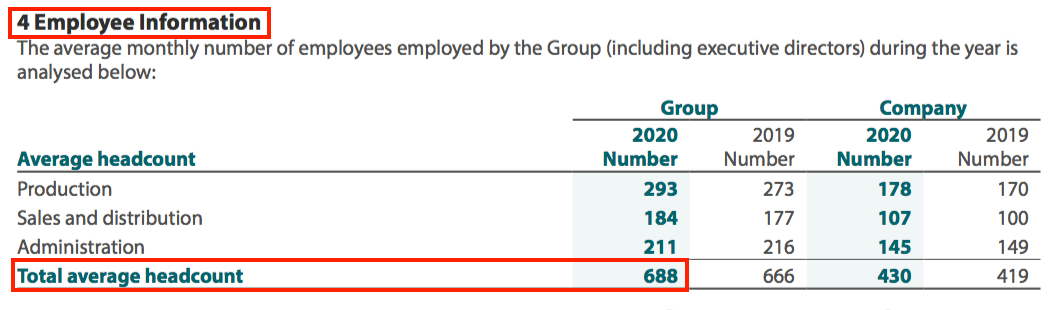
… and revenue is then divided by that number. SharePad can easily produce charts such as this…
…to do the calculations for you.
Reader offer: Claim one month of free SharePad data. Learn more. #ad
I believe R/E offers these advantages to investors:
- Less accounting judgement required: The ratio is not subject to ‘exceptional’ adjustments that interfere with measures such as operating margin and return on equity;
- Management may use it as a real-life KPI: Most companies will consider how the salaries of extra employees will be covered by income, and;
- Not a mainstream investor measure: Earlier/better investing signals may be generated in comparison to conventional ratios.
The largest share-price winners of the last 20 years show a loose correlation between improved staff productivity and investment returns. SharePad lists the top 15 winners below:
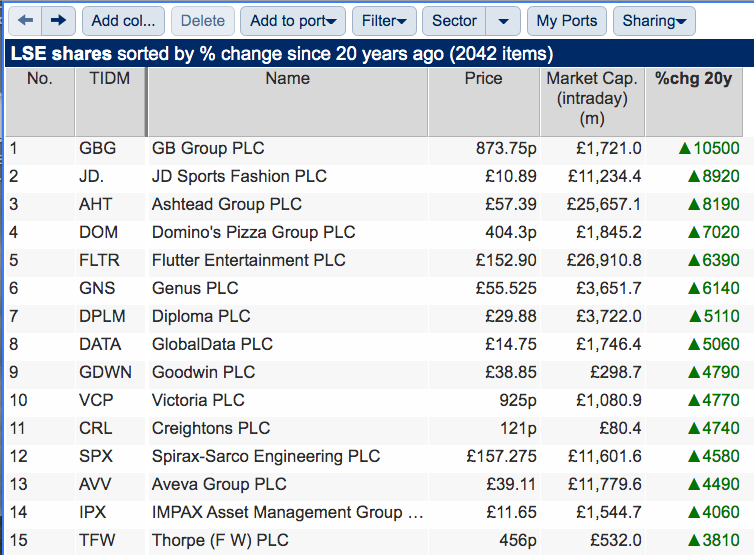
Identity software specialist GB Group heads the table with a 106-bagger return, which has in part been driven by significant improvements to R/E (black line, right axis below):

Revenue per GB employee has advanced from £55k to £209k (black line, right axis) between 2001 and 2021:
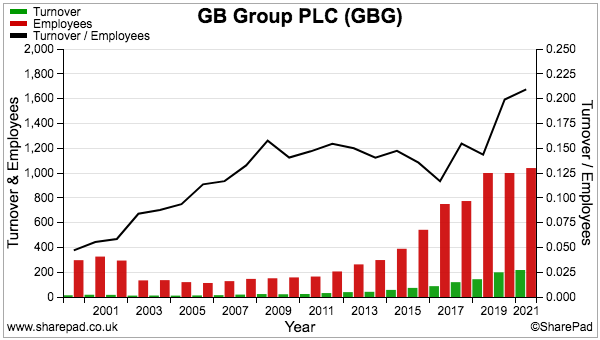
Note that GB’s R/E was improving well before the share price took off.
Between 2001 and 2010, GB’s R/E (black line, right axis) more than doubled while the share price went nowhere:

True, other factors may have justifiably kept a lid on GB’s share price during those nine years. But something favourable was clearly happening to the underlying business that allowed much greater sales to be earned from each staff member.
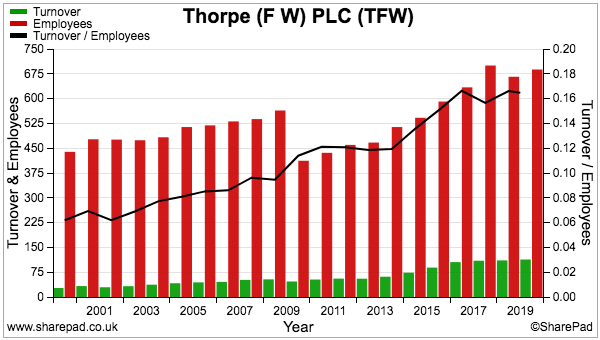
Many of the shares within that top 15 exhibit consistent R/E improvements. Ashtead, Diploma and FW Thorpe are three examples:

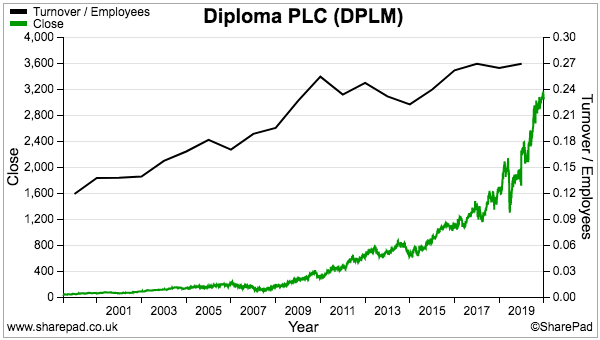

This trio emphasises how even humdrum activities such as forklift hire, distributing fasteners and manufacturing lights can deliver incredible long-term returns through greater workforce productivity.
I hold FW Thorpe shares and they have five-bagged since my initial purchase. Other big winners in my portfolio show favourable R/E trends, too:


Mind you, some of my more average performers have shown no great R/E progress:

Similar to that top 15 list above, my own portfolio does suggest some link between R/E advances and investment success.
With that in mind, I hope monitoring R/E can lead to early indications of improved fortunes at some of my other holdings.
For example:
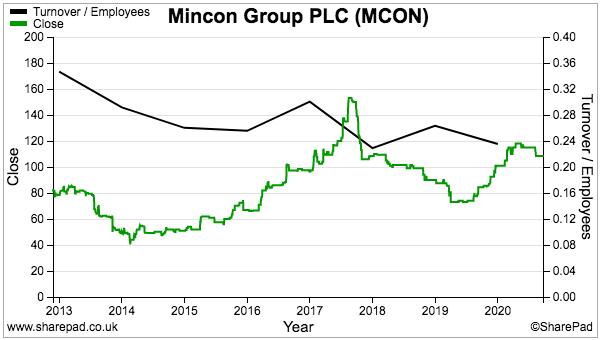
- Mincon is an industrial drill manufacturer that has acquired smaller businesses to widen its product range and capture larger supply contracts:
- System1 is an advert-testing specialist that is migrating from bespoke consultancy work towards an automated, data-led service:

- Tasty is a beleaguered restaurant chain that may have discovered new efficiencies and additional income sources during the pandemic.
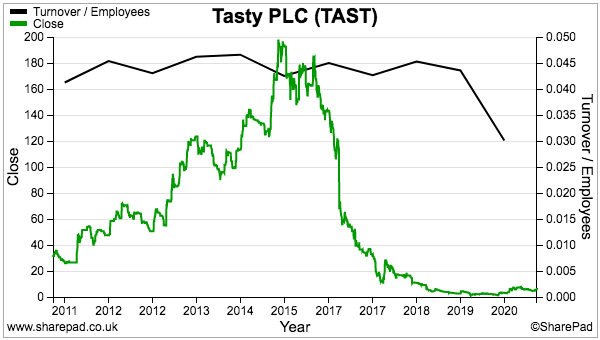
All three have witnessed their R/Es stagnate or decline as they underwent significant strategic, operational and/or industry changes.
But as those companies emerge from their transitions, I am hopeful their R/Es will eventually pick up and indicate their operational quality has improved.
And if those R/Es do advance, maybe those increases will appear before clear improvements are seen at margins, returns on equity and other traditional measure. I will report on my blog if they do.
I must add that, similar to other ratios, R/E is not perfect and should never be used in isolation. A tip-top workforce will not prevent shareholder trouble if, for example, a debt-loaded balance sheet is mixed with a sudden setback.
Studio Retail has for instance seen its R/E triple over the last 20 years…
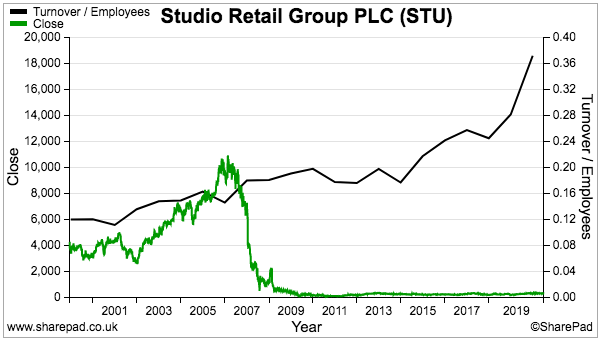
…but hefty borrowings plus a profit shortfall prompted emergency share placings during its time as Findel…and the shares are down 90% over the same 20 years.
Until next time, I wish you safe and healthy investing.
Maynard Paton
PS: You can receive my blog posts through an occasional email newsletter. Click here for details.

Thanks Maynard. Always interesting and useful to se what others are doing and to read your thoughts on your PF and what drives your decisions.
Thanks Kevin. Glad you found it useful.
Maynard