30 March 2021
By Maynard Paton
Results summary for Mincon (MCON):
- Acceptable pandemic progress, with underlying revenue up 6% and profit up 28% due almost entirely to margin improvements.
- Strategic efforts to sell drills direct and supply the construction market seem to have borne fruit and underpinned the higher earnings.
- A margin comparison with larger rivals raises questions as to whether MCON’s products enjoy an indisputable competitive ‘moat’.
- Rising costs and enormous stock levels raise further questions about the group’s underlying economics.
- New products expected to “transform” drilling plus a desire to “innovate and disrupt the market” might justify the 19x-plus P/E. I continue to hold.
Contents
- Event links, share data and disclosure
- Why I own MCON
- Results summary
- Revenue, profit and dividend
- Direct sales and sector diversification
- Greenhammer project
- Epiroc and Sandvik
- Financials: Gross margin
- Financials: Working capital and return on equity
- Financials: Cash flow
- Valuation
Event links, share data and disclosure
Event: Final results and presentation for the twelve months to 31 December 2020 published 22 March 2021
Price: 110p
Shares in issue: 212,191,152
Market capitalisation: £233m
Disclosure: Maynard owns shares in Mincon. This blog post contains SharePad affiliate links.
Why I own MCON
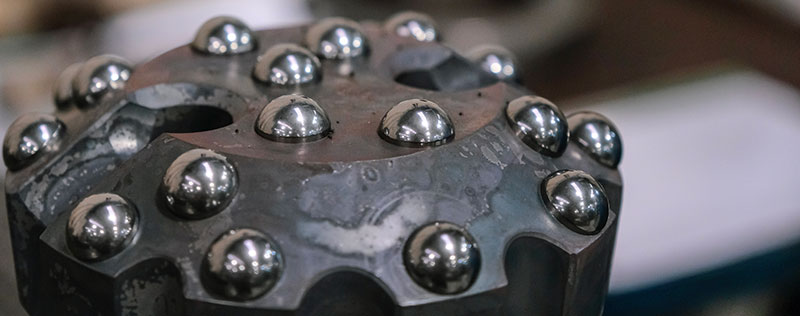
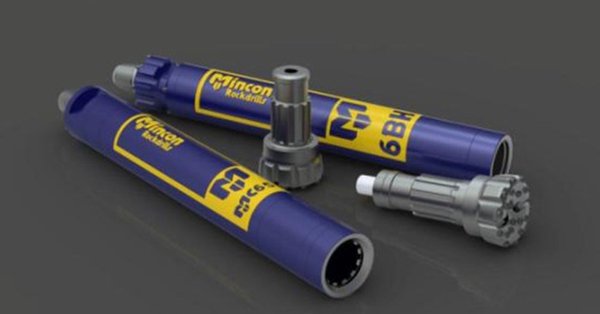
- Designs and manufactures industrial drills and bits, with sales supported by established reputation, engineering excellence, product patents and technical innovation.
- Boasts veteran family management with 43-year tenure, 57%/£132m shareholding and long-term perspective.
- Offers rising profit potential through pandemic resilience, greater direct sales, construction market entry and “disruptive” new products.
Further reading: My MCON Buy report | All my MCON posts | MCON website
Results summary
Revenue, profit and dividend
- A generally satisfactory H1 followed by news of a reinstated interim dividend had already signalled an acceptable FY 2020 performance.
- But the results were not easy to interpret.
- Total revenue gained 8%, although:
- Excluding acquisitions, revenue growth was 3%, and;
- Excluding acquisitions and currency movements, revenue growth was 6%.
- Annual revenue up 8% compared to up 4% for Q1, up 8% for H1 and up 12% for Q123. MCON’s quarterly performances were therefore somewhat variable.
- Profit progress was hard to decipher. Matters to consider included:
- Covid-19 government benefits (see below);
- Exceptional items, impairments and inconsistent reporting (see below);
- Unspecified contributions from acquisitions, and;
- Capitalised R&D spend without any associated amortisation (see Greenhammer project).
- MCON admitted pandemic grants had bolstered reported profit by €1.3m:
“We also availed of employee related government grants in Australia, Sweden and the UK, totalling €1.3 million in the year. These grants compensated for the Group being affected by the impact of the pandemic in those countries.”
- MCON acknowledged the receipt of the government handouts at the half-year, and had appropriately suspended the dividend.
- However, these FY 2020 results confirmed the suspended interim payout would now be paid alongside the final dividend…
- …yet MCON appears to have kept the government benefits.
- MCON’s actions sadly do not meet the standard set by FW Thorpe, which did not apply for furlough money and instead kept all would-be furloughed staff on full pay at its own expense.
- The €1.3m state aid MCON received compares to €2.3m to fund the reinstated interim dividend.
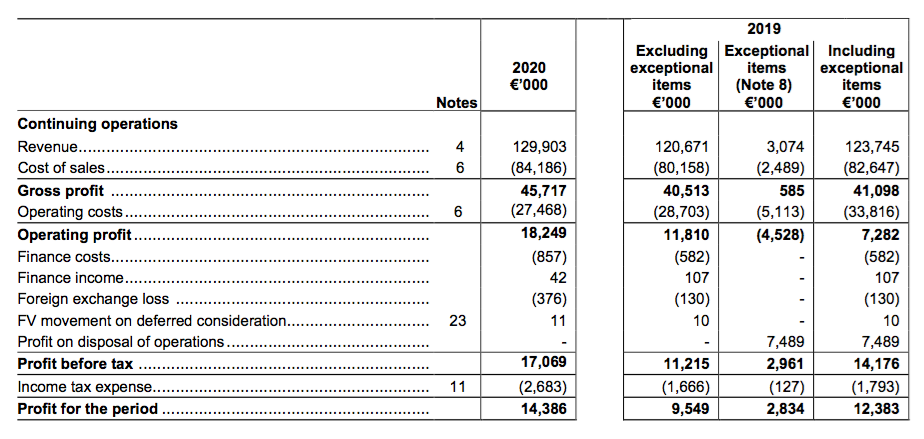
- These FY 2020 figures set new records for both revenue and operating profit:
| Year to 31 December | 2016 | 2017 | 2018 | 2019 | 2020 |
| Revenue (€k) | 76,181 | 97,358 | 117,688 | 120,671 | 129,903 |
| Operating profit (€k) | 10,178 | 14,040 | 16,352 | 11,810 | 18,249 |
| Exceptional charges (€k) | - | (3,174) | (166) | (2,754) | - |
| Exceptional gains (€k) | - | 3,124 | 747 | 7,489 | - |
| Discontinued operations (€k) | - | - | - | (1,774) | - |
| Other items (€k) | 1,125 | (1,273) | (618) | (120) | (365) |
| Finance income (€k) | 30 | (79) | (31) | (475) | (815) |
| Pre-tax profit (€k) | 11,333 | 12,638 | 16,284 | 14,176 | 17,069 |
| Earnings per share (c) | 4.39 | 4.79 | 6.45 | 5.84 | 6.72 |
| Dividend per share (c) | 2.00 | 2.05 | 2.10 | 2.10 | 2.10 |
- The FY 2019 results included stock/debtor impairments of €2.6m that were not deemed as exceptional.
- Exclude these impairments, and operating profit was €14.3m for FY 2019 and advanced 28% during FY 2020.
- H2 operating profit before impairments and exceptionals appeared to rally 36%:
| H1 2019 | H2 2019 | FY 2019 | H1 2020 | H2 2020 | FY 2020 | ||
| Revenue (€k) | 59,922 | 60,749 | 120,671 | 64,654 | 65,249 | 129,903 | |
| Operating profit before impairments & exceptionals (€k) | 6,939 | 7,362 | 14,301 | 8,263 | 9,986 | 18,249 | |
| Stock impairment (€k) | (1,992) | 300 | (1,692) | - | - | - | |
| Other impairments (€k) | (582) | (217) | (799) | - | - | - | |
| Operating profit before exceptionals (€k) | 4,365 | 7,445 | 11,810 | 8,263 | 9,986 | 18,249 | |
| Exceptional costs (€k) | (2,978) | 224 | (2,754) | - | - | - |
- The figures within the above table are not perfect. Confusing the ‘underlying’ FY 2020 profit performance were:
- A €257k stock impairment recorded during H1 followed by a zero stock impairment recorded for the full year, and;
- Acquisition and related costs of €343k recorded during H1 but nothing declared for the full year.
- The bumper profit advances were supported almost entirely by the full-year operating margin improving from 12% to 14%.
- However, MCON still has some way to go to recapture the 20%-plus margins of the past (see Financials: Gross margin).
Enjoy my blog posts through an occasional email newsletter. Click here for details.
Direct sales and sector diversification
- These results highlighted MCON meeting two strategic objectives:
- Selling more products directly to customers, and;
- Selling more products beyond the group’s traditional mining customers.
- Two years ago MCON embarked on selling direct to its end customers rather than through intermediaries:
“We are differentiating ourselves from the less developed businesses in low margin activities in the sector, and we are positioning ourselves to deal directly with end customers and to win large contracts.“
“Going forward we plan to… seek long-term partnerships and multi-year contracts with end customers incorporating direct delivery to their sites.”
- The plan appears to have worked. The FY 2020 presentation confirmed direct sales gained 19% to represent 77% of total revenue:
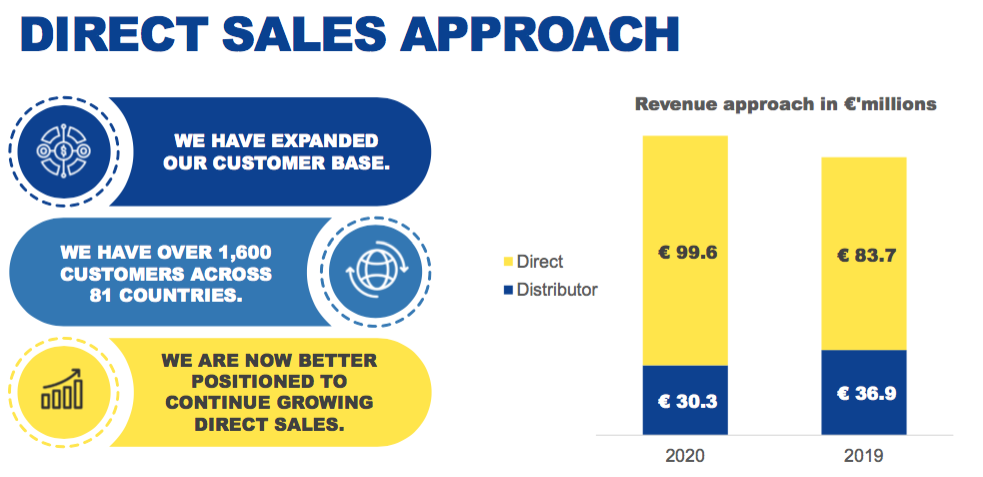
- Direct sales should benefit MCON by cutting out the intermediary margin and providing greater insight into future customer requirements.
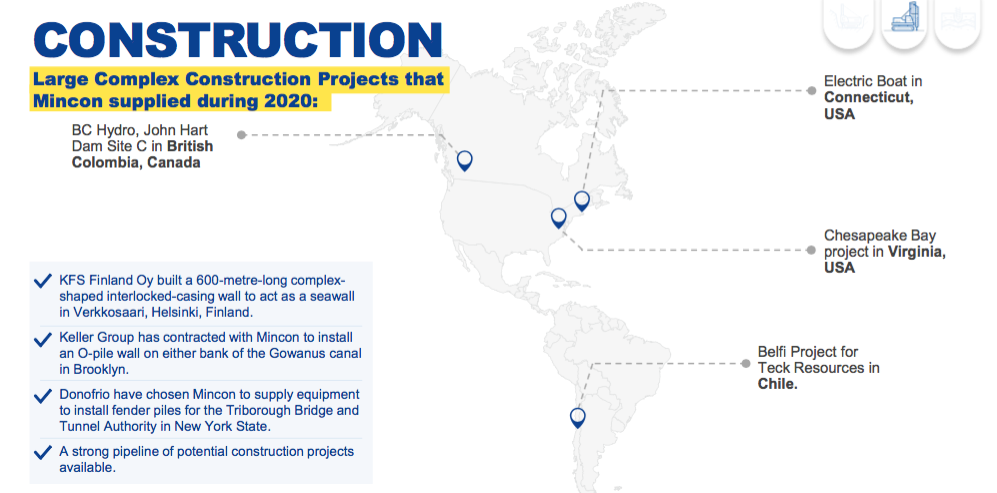
- MCON said its construction division bolstered the FY 2020 performance:
“We continued our expansion into the construction industry with significant year-on-year revenue growth of 33% in the industry, which accounted for 30% of the Group’s revenue in 2020 (2019: 25%).
“Our operating margin increased to 14.0% of revenue in 2020 (2019: 9.8%), as we experienced stronger gross margins from large construction projects in the Americas.”
- Construction revenue growth was biased heavily towards H1, with the division witnessing only a 2% revenue advance during H2:
| Revenue | H1 2019 | H2 2019 | FY 2019 | H1 2020 | H2 2020 | FY 2020 | |
| Mining (€k) | 36,552 | 27,403 | 63,956 | 33,620 | 32,630 | 66,251 | |
| Construction (€k) | 8,988 | 21,179 | 30,168 | 17,457 | 21,514 | 38,971 | |
| Geothermal (€k) | 13,183 | 10,951 | 24,134 | 12,284 | 11,098 | 23,383 | |
| Other (€k) | 1,198 | 1,215 | 2,413 | 1,293 | 6 | 1,299 |
- Construction activity appears dependent on large projects, the timing and frequency of which could mean the associated income is unpredictable:
- H2 mining revenue gained 19% due to a weak comparable, while water-well and geothermal bore-hole drilling was hindered slightly by the pandemic.
- Other revenue comprises mostly of sales of manufactured carbide to competitors, and decreased as MCON used the supply for itself.
- MCON’s construction division was essentially formed during FY 2017 following the purchase of Finnish operator PPV:
“We acquired PPV, a company in Finland that can bring us into the construction industry and which has given us a new suite of products.”
- Further acquisitions have helped construction revenue expand to 30% of the group total — an ambitious achievement in four years.
- Innovations such as the Sprial Flush system have assisted the construction division’s progress:
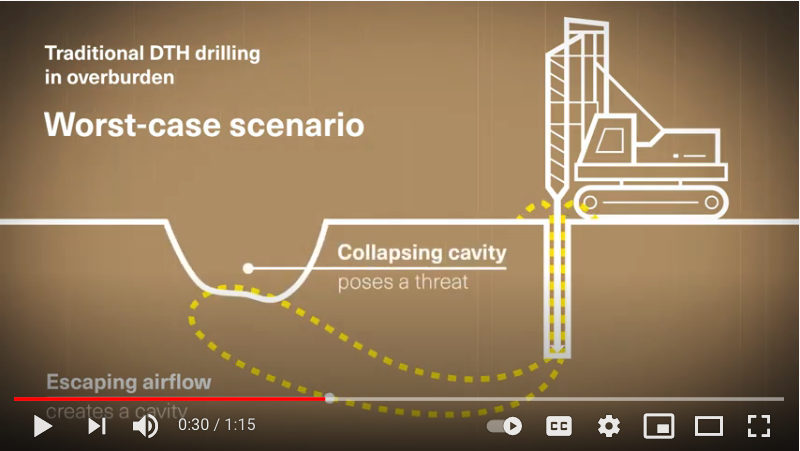
Greenhammer project
- The apparent success of the direct-selling transition and construction-division expansion gives hope that MCON’s Greenhammer project may one day also bear fruit.
- Two years ago the firm described this new hydraulic drilling system as:
“[A] disruptive technology, offering tremendous savings in fuel, with an ambitious planned partnership programme in our customer base”.
- The project was first mentioned within the FY 2016 results while the FY 2018 results said the investment had started seven years beforehand.
- The customer evaluating the Greenhammer system has suffered one hold up after another.
- 2018 witnessed technical delays and flooding.
- A “serious mechanical issue” on the customer’s own rig then dogged the trial during 2019.
- And then Covid-19 emerged and delayed the tests last year:
“The pandemic affected product development of our Greenhammer technology in Australia. Site access was — and continues to be — limited to essential personnel only, primarily due to strict lockdowns imposed by the Australian government.”
- MCON nonetheless remains bullish:
“Mincon remains committed to the commercialisation of this exciting technology that we believe will transform the hard-rock surface mining market.”
- MCON capitalised Greenhammer costs of €1.1m during the year to take the project total to €5.8m since FY 2016.
- Not a eurocent of that €5.8m expenditure has been charged against earnings. Amortisation will commence only when the system enters commercial use:
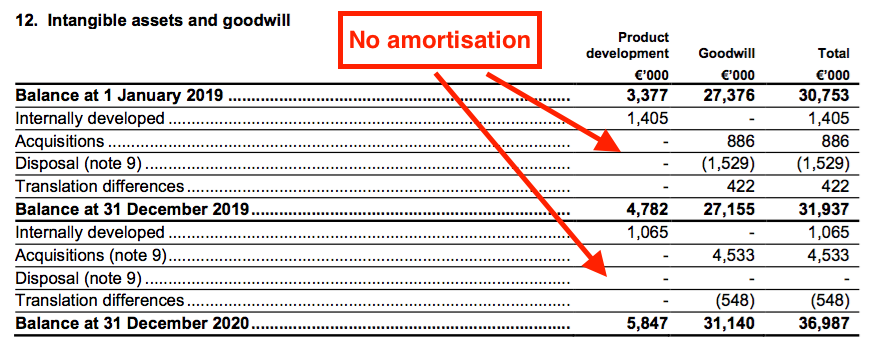
- The €5.8m investment represents 8% of the €71m aggregate operating profit before exceptional items reported during the same time.
- If the entire Greenhammer project is written off, arguably past profits between FY 2016 and FY 2020 were overstated by 8%.
Quality UK investment discussion at Quidisq. Visit forum.
Epiroc and Sandvik
- This FY 2020 statement made several references to first-class products:
“Mincon has a strong background in design, manufacture, delivery, and service of high-quality surface drilling solutions“
“We pride ourselves on innovative engineering and superior manufacturing and service, something that has always been at the core of what we do.“
“Ongoing product development and continuous improvement of existing product lines, ensuring that we remain the industry benchmark.“
“Continuous improvement for our range of open, and sealed-bearing, rotary drill bits, to deliver market-leading performance in terms of life and penetration rates.”
- Yet MCON’s operating margin is not commensurate with customers paying premium prices for top-notch drills and five-star service.
- The margin has been limited to 14% during the last few years:
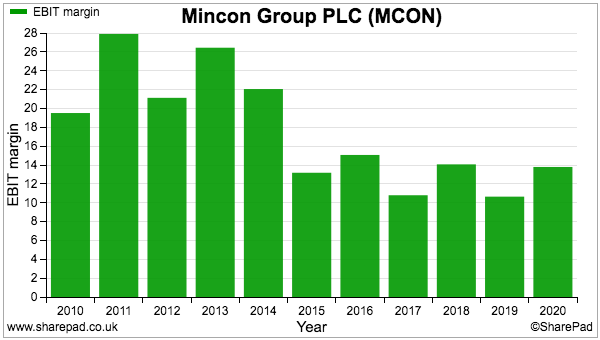
- A 14% margin is reasonable, but not indisputable evidence of a competitive ‘moat’ and customers having few viable alternatives.
- Bear in mind the 14% margin for FY 2020 is not adjusted for pandemic grants and Greenhammer costs.
- I bought MCON shares during early 2015 due in part to the (then) high margins:
“[H]igh margins underpin the notion that MCON has a respectable competitive advantage. The group converted 19% of revenue into profit during 2014 and above 20% during 2011, 2012 and 2013.”
- A comparison between MCON and its rivals puts greater perspective on the margin issue. Perhaps manufacturing heavy-duty drills is inherently a low-teens-margin activity.
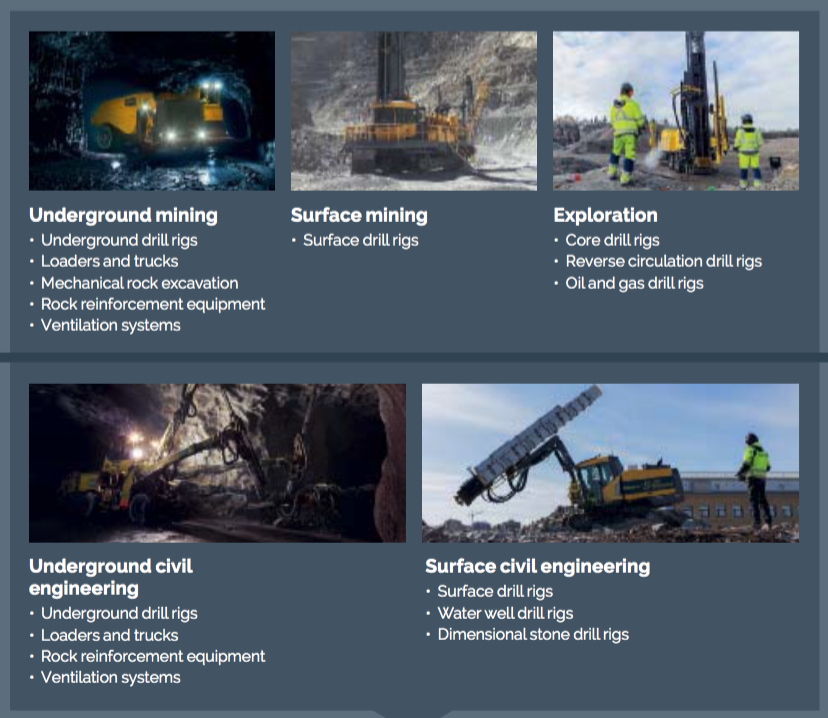
- MCON helpfully named Epiroc and Sandvik as competitors within its 2019 annual report (point 6):
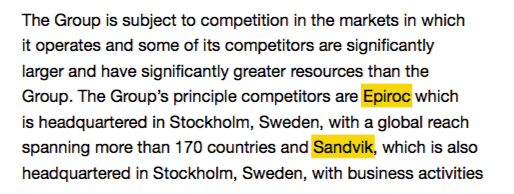
- Strict comparisons are difficult, as Epiroc and Sandvik are far larger organisations and supply different products to MCON. Epiroc for example manufactures equipment for both surface and underground drilling while MCON supplies items only for surface drilling:
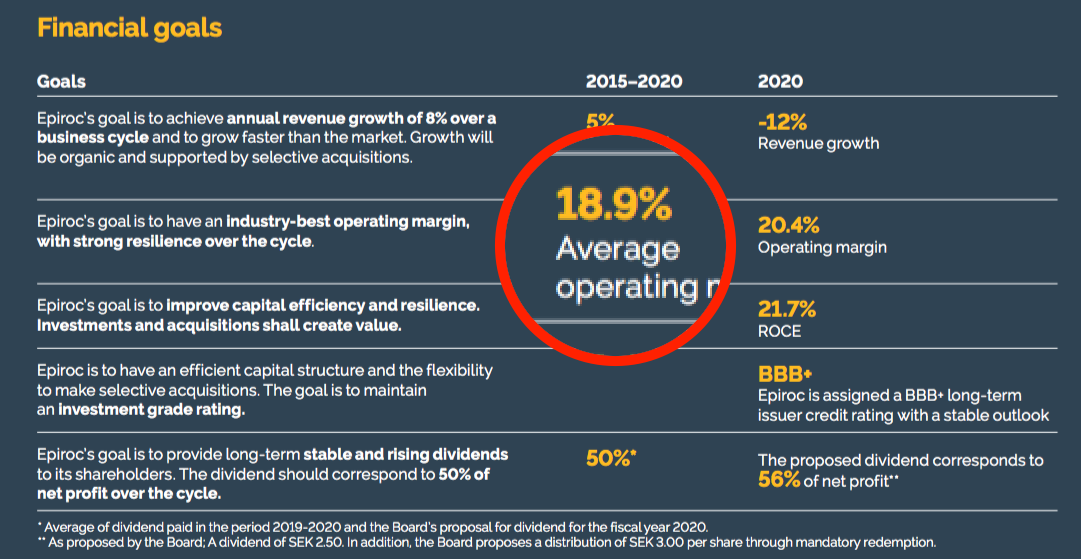
- Epiroc’s annual report says the group achieved a 19% five-year average margin:
- Sandvik meanwhile reports its Mining and Rock Technology division has enjoyed a similar 19% adjusted margin:
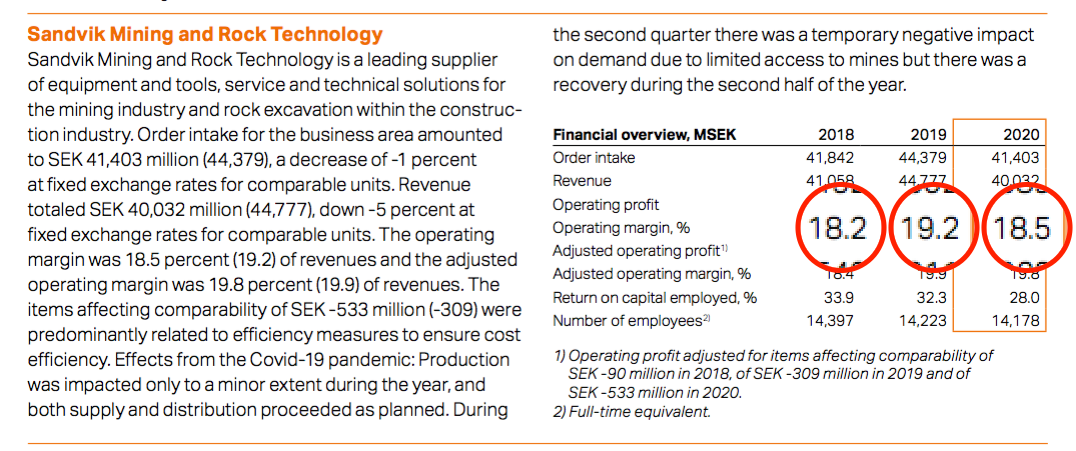
- Both Epiroc and Sandvik have the benefit of scale. Their aforementioned 19% margins were generated on revenue of between €3b and €4b during 2020. MCON’s revenue by comparison was €130m.
- MCON’s 14% margin versus 19% at two larger rivals does not feel great.
- The comparison raises some questions:
- Does MCON’s smaller size put the group at a competitive disadvantage?
- Are MCON’s products actually “market-leading” and the “industry benchmark“?
- Do Epiroc and Sandvik enjoy higher margins on equipment MCON does not supply (e.g. for underground drilling)?
- Can drill manufacturers in fact make greater profits by selling cheap products that require frequent replacement?
- I do not have the answers. I would therefore welcome any insight from drilling professionals on the pros and cons of MCON’s products. You can reach me through the comment box below, the Quidisq forum or my contact form.
Financials: Gross margin
- MCON’s operating margin being limited to 14% is due simply to expenses rising faster than sales.
- MCON’s cost of sales has in particular shown notable price inflation.
- The table below compares MCON’s own-brand sales against raw material costs and direct employee expenses:
| Year to 31 December | 2014 | 2015 | 2016 | 2017 | 2018 | 2019 | 2020 |
| Own-brand revenue (€k) | 41,816 | 52,786 | 56,360 | 74,965 | 100,319 | 100,731 | 108,556 |
| Raw materials (€k) | 11,035 | 15,166 | 16,473 | 24,517 | 33,221 | 39,190 | 33,913 |
| Direct employee costs (€k) | 4,951 | 6,714 | 7,162 | 9,588 | 14,728 | 14,045 | 17,504 |
| Proportion of own-brand revenue | |||||||
| Raw materials (%) | 26.4 | 28.7 | 29.2 | 32.7 | 33.1 | 38.9 | 31.2 |
| Direct employee costs (%) | 11.8 | 12.7 | 12.7 | 12.8 | 14.7 | 13.9 | 16.1 |
- Raw materials as a proportion of own-brand sales has topped 30% since FY 2017. The ratio was previously below 30%.
- Direct employee costs as a proportion of own-brand sales has now reached 16%. The ratio was previously below 13%.
- Raw materials and direct employee costs alone have combined to take an extra nine percentage points from MCON’s own-brand revenue since FY 2014.
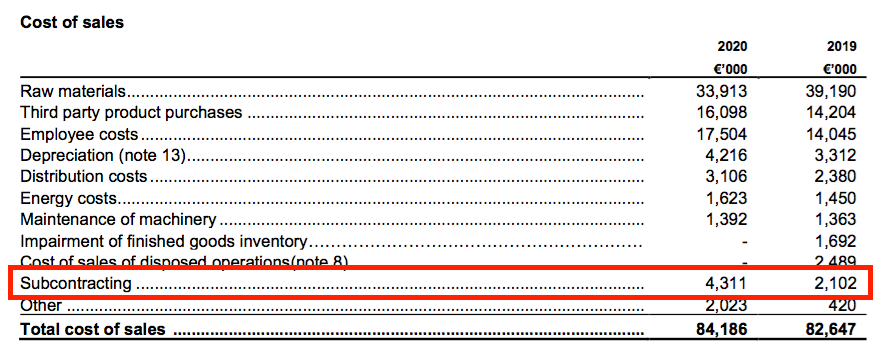
- Other costs have advanced, too. I note “subcontracting” now appears as an identifiable expense, the cost of which doubled during the year:
- Perhaps making top-quality drills has simply become more expensive, and MCON has been unable to recoup that extra cost from customers…
- …although Epiroc and Sandvik do not seem to have faced the same problem.
- Note also that MCON’s third-party sales can’t really explain the limited 14% operating margin:
| Year to 31 December | 2016 | 2017 | 2018 | 2019 | 2020 |
| Revenue | |||||
| Own brand (€k) | 56,360 | 74,965 | 100,319 | 100,731 | 108,556 |
| Third party (€k) | 19,281 | 22,393 | 17,369 | 19,940 | 21,347 |
| Cost of sales | |||||
| Own brand (€k) | 30,058 | 41,940 | 59,437 | 65,954 | 68,088 |
| Third party (€k) | 15,562 | 17,580 | 13,625 | 14,204 | 16,098 |
| Gross margin | |||||
| Own brand (%) | 46.7 | 44.1 | 40.8 | 34.5 | 37.3 |
| Third party (%) | 21.5 | 21.5 | 21.6 | 28.8 | 24.6 |
| Group (%) | 40.1 | 38.9 | 37.9 | 33.6 | 35.2 |
- Third-party products represented only 16% of total revenue during FY 2020 and the gross-margin differential with own-brand turnover has actually narrowed over time.
- I can’t imagine MCON curtailing raw-material costs and employee expenses while at the same time expanding the business.
- I can only conclude lifting margins to a ‘moat’-type level probably requires new products such as Greenhammer attracting customers willing to pay hefty premiums.
Financials: Working capital and return on equity
- MCON has persistently operated with significant working capital (stock plus trade and other receivables less trade and other payables):
| Year to 31 December | 2016 | 2017 | 2018 | 2019 | 2020 |
| Working capital (€k) | 45,186 | 41,690 | 58,041 | 58,083 | 63,200 |
| Revenue (€k) | 76,181 | 97,358 | 117,688 | 120,671 | 129,903 |
| Working capital/Revenue (%) | 59.3 | 42.8 | 49.3 | 48.1 | 48.7 |
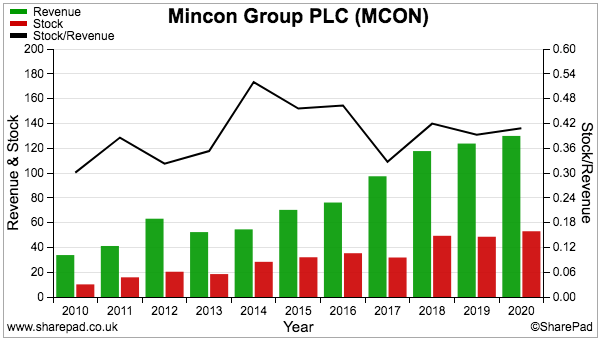
- Stock is the largest component of MCON’s working capital and indeed the largest entry on the balance sheet:
| Year to 31 December | 2016 | 2017 | 2018 | 2019 | 2020 |
| Stock (€k) | 35,310 | 31,851 | 49,357 | 48,590 | 53,017 |
| Revenue (€k) | 76,181 | 97,358 | 117,688 | 120,671 | 129,903 |
| Stock/Revenue (%) | 46.4 | 32.7 | 41.9 | 40.3 | 40.8 |
- Large amounts of stock can mean the company:
- Owns slow-moving items that carry greater risk of obsolescence;
- Applies inefficient working practices, and/or;
- Requires greater cash investment for future sales expansion.
- MCON’s year-end stock represented 41% of revenue (black line, right axis):
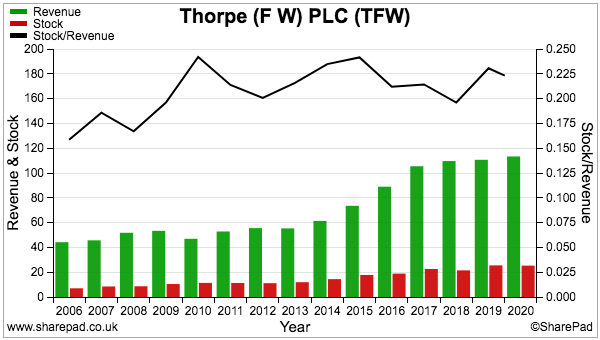
- For comparison, among my other portfolio shares, stock held by FW Thorpe represented 22% of FY 2020 revenue…:
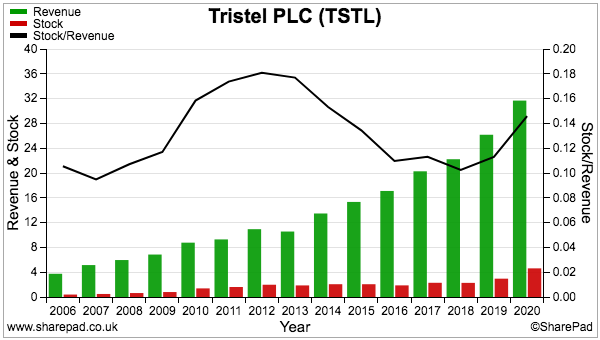
- …while stock held by Tristel represented 15% of FY 2020 revenue:
- MCON has for some time suggested working-capital improvements were on the way. The 2019 annual report (point 2) for instance claimed “management expect that the Group’s inventory will continue to decrease”.
- But the 2019 annual report (point 2) also reported:
“The most beneficial way for the Group to compete is to partner with customers that are viewed as blue chip customers in certain markets, and though this brings spikes in working capital, it will give the Group better margins with less risk. It is management’s intention to bring more long-term value to the Group through targeting more customers that require a large volume of product with better service from the supplier, a sales and service approach…”
- From what I can tell, elevated working-capital levels seem a fundamental requirement of this business.
- The sizeable working-capital demands go some way to explain the modest returns on equity:
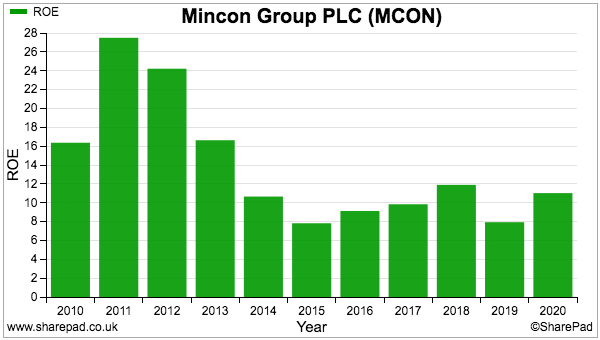
- But during recent years, respectable returns have been enjoyed on retained earnings.
- The table below shows MCON creating extra revenue of €60m that led to extra earnings of €6m between FY 2015 and FY 2020:
| Year to 31 December | 2015 | 2020 | Change |
| Revenue (€k) | 70,266 | 129,903 | 59,637 |
| Working capital (€k) | 38,286 | 63,200 | 24,914 |
| Net cash* (€k) | 38,610 | (4,556) | (43,176) |
| Net asset value (€k) | 97,904 | 132,936 | 35,032 |
| Earnings (€k) | 7,980 | 14,221 | 6,241 |
| Earnings margin (%) | 11.4 | 10.9 | (0.5) |
(*includes IFRS 16 lease obligations)
- Net asset value during the same five years advanced by €35m.
- Retaining €35m of earnings in exchange for an additional €6m profit gives a worthwhile 17% return.
- Those five years witnessed MCON spend its entire €39m net cash position on acquisitions and other expansionary activities.
- The 17% return implies the expenditure — including the extra €25m directed into working capital — was put to satisfactory use.
- Note that the 17% figure was not bolstered by enhanced margins; earnings as a proportion of revenue remained at approximately 11%.
- Whether MCON can reinvest another €35m during the next five years to deliver another €6m earnings gain is open to question.
- The absence of a €39m net cash position to invest could mean additional profits are slower to emerge.
Which is best for stock-screening: Stockopedia or SharePad? See my verdict.
Financials: Cash flow
- The full-year profit increase led to MCON producing its highest level of free cash since at least FY 2010:
| Year to 31 December | 2016 | 2017 | 2018 | 2019 | 2020 |
| Operating profit (€k) | 10,178 | 14,040 | 16,352 | 11,810 | 18,249 |
| Depreciation* (€k) | 2,332 | 3,014 | 3,896 | 3,898 | 4,666 |
| Net capital expenditure** (€k) | (5,246) | (5,639) | (12,552) | (7,930) | (6,981) |
| Working-capital movements (€k) | (1,152) | (4,408) | (14,870) | 2,095 | (2,912) |
| Free cash flow (€k) | 1,972 | 3,270 | (11,118) | 3,175 | 11,393 |
| Net cash (€k) | 34,960 | 26,142 | 846 | 5,586 | 461 |
(*excludes IFRS 16 depreciation **excludes Greenhammer expenditure)
- But as the aforementioned disappearance of that €39m net cash position testifies, the company likes to invest its cash.
- During the last five years, total earnings of €60m have converted into total free cash of only €9m after:
- €21m was spent on tangible capital expenditure beyond the associated depreciation charge;
- €6m was spent on Greenhammer, and;
- €21m was invested in extra working capital;
- The last five years also saw a net €22m spent on acquisitions and €19m spent on dividends, which has left MCON with only a €461k net cash position (excluding IFRS 16 leases).
- Gross bank loans/finance leases of €17m are not alarming versus cash also at €17m and earnings of €14m, although references to 10.5% overdraft rates are uncomfortable:
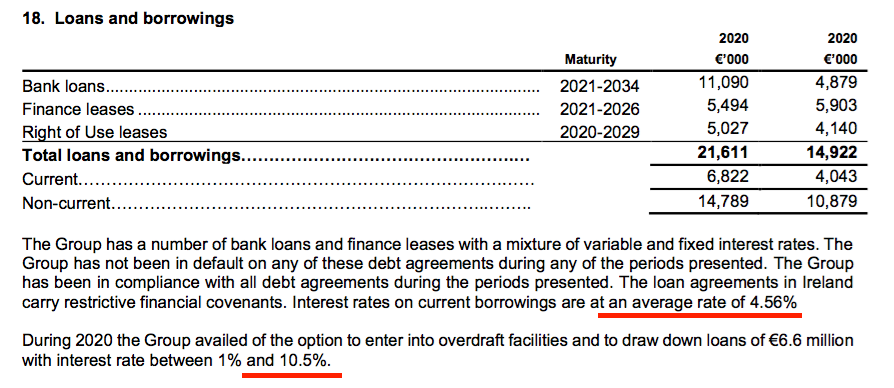
- At least MCON says current borrowings attract a 4.56% rate.
- In fact, bank interest of €525k and average bank loans/finance leases employed during the year of €14m imply an even more reassuring 3.8% interest charge.
- Bear in mind MCON is on the hook for contingent acquisition earn-outs of €4.7m.
- And bear in mind the results commentary suggested the cash expenditure will not subside:
“Growth through strategic acquisitions remains part of the Group’s strategy.”
“Mincon also has an ambition to push the limits of drilling technology. We want to innovate and disrupt the market with unique uses of our existing technologies in new applications…”
“To support and manufacture our expanding product range, we will continue to review and update our well-invested factories…“
“On 1 January 2021, the Group completed the acquisition of the Hammer Drilling Rigs (HDR), a specialist in supply of hard rock drilling attachments based in the USA, for a consideration of €2.1 million.”
- At least MCON’s finances are not complicated further by pension obligations.
Valuation
- MCON did not make any predictions for FY 2021.
- Assuming the coming year replicates the last, the shares do not appear obviously cheap.
- The reported €18.2m operating profit less:
- €0.8m for debt/lease costs, and;
- The 16% tax applied in these results…
- …gives earnings of £11.8m or 5.6p per share with GBP:EUR at 1.16.
- Dividing the 110p share price by my 5.6p per share earnings guess gives a possible P/E of 19x.
- Further adjustments for the earn-outs, Greenhammer expenditure and pandemic grants would push the multiple beyond 20x.
- The present rating may be supported by:
- Welcome pandemic resilience;
- Greenhammer coming good;
- Extra construction opportunities;
- Greater direct sales leading to higher margins;
- Management’s commitment to product quality, and;
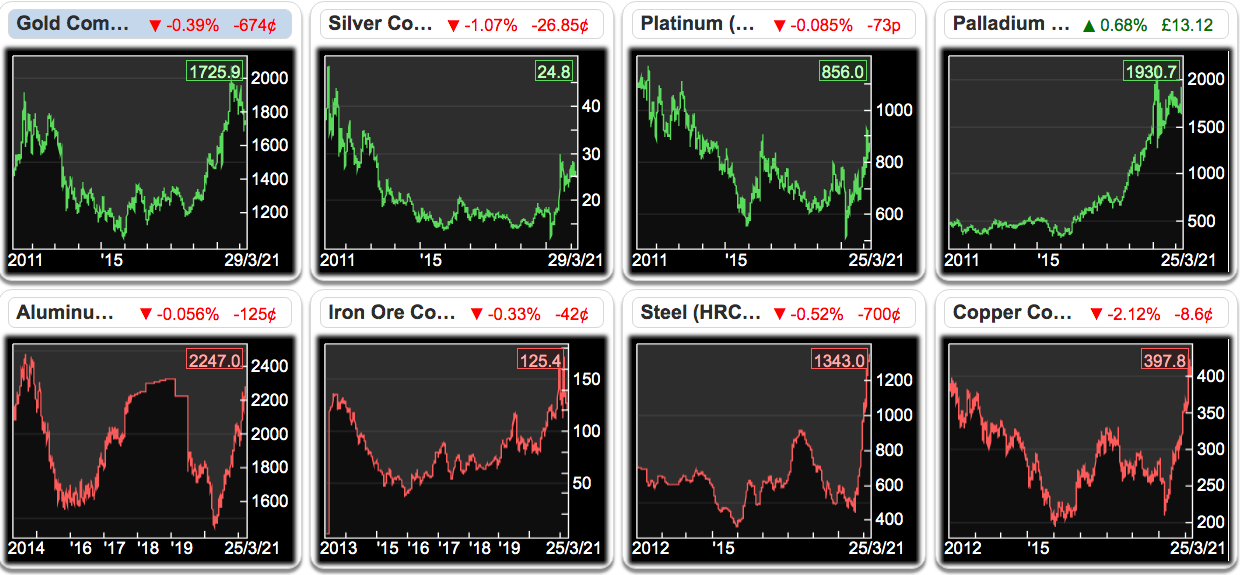
- Rising metal prices prompting greater mining activity and demand for drills (see charts below):
- I continue to believe MCON remains in a ‘moat-rebuilding’ phase — the duration and cost of which is unknown.
- Could the group’s operating margin return to, say, the 19% exhibited by Epiroc and Sandvik?
- A consistent 19% margin would certainly demonstrate the emergence of a competitive advantage to layman shareholders.
- The share price is of course likely to be somewhat higher if/when a wide moat becomes very obvious.
- The trailing dividend yield of 2.1 eurocents, or 1.8p, per share, supports a modest 1.6% income (before Irish withholding taxes for UK-resident investors).
Maynard Paton
PS: You can receive my blog posts through an occasional email newsletter. Click here for details.

Mincon (MCON)
Annual General Meeting held 06 May 2021
MCON commendably invited questions ahead of its AGM and I submitted the four below. All were answered by management on the AGM conference call. No other questions were submitted. Management’s replies were useful and are paraphrased from my rough notes.
Maynard
———————————————————————————————————–
1) The company received government pandemic-related grants of €1.3m during the year — but later declared dividends for the same year. Why did management decide to declare dividends that were arguably part-funded by government aid? Were the grants repaid?
———————————————————————————————————–
The grants were all received by operations outside of Ireland and paid to employees that could not work. These operations did not pay dividends to the group.
———————————————————————————————————–
2) The company’s products are described as “best in class” due to “continuous excellence in technical innovation”.
And yet the reported operating margin of 14% does not seem commensurate with customers paying premium prices for top-notch equipment and five-star service.
Some years ago the company used to convert 20% or so of revenue into profit. Competitors such as Epiroc and Sandvik presently claim to enjoy 18% or 19% adjusted margins.
So: what is management’s margin ambition, at a group level and for the own-brand products? (It would be useful to understand what the group margin would be without the third-party products.) Does management consider 14% for the group to be acceptable? The company’s major expenses are raw materials and employees, which presumably will be hard to reduce if the business expects to grow.
———————————————————————————————————–
The 20% margin of the past was achieved on much lower revenue when the company was manufacturing only part of the drill string and the more profitable DTH drills represented a greater part of the business.
Today the company manufacturers the full drill string, and as such has been able to win large direct contracts and therefore increase profit. That said, 14% is not our level of ambition. The competitors cited manufacture capital mining equipment as well as consumable drilling equipment, while MCON manufacturers only consumable items, which makes a comparison of the consumable operations difficult.
(Management comments about third-party products were made but I could not make out what was said).
———————————————————————————————————–
3) Inventory at €53m continues to be the largest balance-sheet item, equivalent to a significant 41% of revenue. The company has acknowledged substantial levels of stock are required to maintain high levels of customer service.
So: how does management envisage inventory levels changing in the years ahead? If the company has ambitions to say, double revenue, then will inventory levels have to double as well to support such growth? If so, investing a further €53m into additional inventory will of course limit free cash that could be used to pay greater dividends, fund new R&D etc.
———————————————————————————————————–
We consider inventory levels to be high, but that does reflect the wide geographical footprint the company serves. We measure stock levels by days in hand and if sales did double, then inventory would increase, but we’d expect it to reduce as measured by days in hand.
———————————————————————————————————–
4) The Greenhammer project is described as “exciting technology that will transform the hard-rock surface mining market”.
“Transform” seems a bold verb to use, so can management explain the scale of the opportunity here and how popular this technology could become?
And will Greenhammer create only incremental revenue, or will it simply replace existing sales, as customers in future purchase Greenhammer products rather than other group equipment?
———————————————————————————————————–
Greenhammer is is being tested and currently showing 2-3x improvements on penetration times. Such performance should lead to a decrease of rig requirements for customers, perhaps needing only half the expenditure on labour and fuel as now based on the cost-per-metre of drilling. Greenhammer is being trialled in Western Australia, where there is a large opportunity. Further development is required before the system can be rolled out elsewhere.
Greenhammer could produce significant incremental profitability and there remains a very big market opportunity for other MCON products.
Mincon (MCON)
Interim trading update published 10 May 2021
A promising statement that refers to YTD sales being up on 2020 and names seabed drilling as a new development area.
Maynard
———————————————————————————————————–
Mincon Group plc (ESM:MIO AIM:MCON), the Irish engineering group specialising in the design, manufacture, sale and servicing of rock drilling tools and associated products, today provides an interim trading update.
Trading
We are experiencing good order levels in most markets with a positive momentum building across the business and revenue is ahead of last year for the first four months. Sea freight lead times remain challenging due to the pandemic and we are using air freight where necessary to overcome these freight challenges. We curtailed other overheads to compensate for any increased freight costs.
Covid-19 had an impact on some of our key manufacturing facilities in the early part of the year. In particular the beginning of 2021 was challenging for production in our key hammer facility in Shannon, as we endeavoured to ensure we remained Covid-free. This situation gradually improved and by the end of March our production levels had recovered and pushed ahead of the 2020 run rate.
Future investment
We continue to advance the business of the Group through investing in new product development and manufacturing methods. In January we ordered equipment for new manufacturing techniques to drive efficiency and to reduce manufacturing costs and carbon emissions. In April 2021, the Group was successful in its grant application, as lead member in a consortium, to the Disruptive Technology Innovation Fund promoted by the Irish Government to develop a new robotic seabed drilling system along with the installation and testing of marine anchors using micropile technology. These micropiled anchor foundations will be used for a wide range of applications including offshore wind turbines.
———————————————————————————————————–
Mincon (MCON)
Publication of 2020 annual report
Here are the points of interest:
1) Chairman’s statement
The chairman’s statement is never included within the results RNS. A few choice quotes confirming the company’s dedication to product/service quality…
…encouraging contract wins in Chile…
…and new product launches:
2) Business model
A reminder about the group’s competitive advantage:
3) Risks
No changes to the group’s risks were disclosed. But the top ten customers have increased their share of MCON’s revenue:
4) CFO report
The CFO’s report is never included within the results RNS. The CFO did not reveal anything of great importance, but the CFO did explain why manufacturing has to occur close to customer operations:
Pleasing to see no invoices were written off:
Nothing ground-breaking was said about stock levels, which as the blog post above notes remain significant:
5) Directors’ report
Another reminder about the group’s competitive advantage:
A few extra words about the risks associated with Covid-19:
6) Corporate governance
No major changes to the text this year. MCON confirms results presentations are now published on its website:
Not often you see shareholders invited to group locations beyond the executive suite:
7) Audit committee
A new section for the 2020 report. No great revelations. Held four meetings:
8) Nominations committee
A new section for the 2020 report. Held two meetings, with agenda items including female directors and succession planning:
9) Remuneration committee
A new section for the 2020 report. Held four meetings:
First time MCON has disclosed its bonus calculations:
Encouraging that stock levels are part of the bonus scheme.
A reminder that options require 5%+CPI EPS growth per annum over three years:
The remuneration committee claimed the 2020 performance was “very good“:
The chief exec suffered a 20% pay cut, but captured a €85k bonus to make up the shortfall:
The €55k bonus for 2019 was previously lumped into the Salary figure. Useful that MCON is now disclosing bonuses separately. The 2020 bonuses are the first to be disclosed by MCON.
10) Corporate responsibility
Additional Covid-19 text, with MCON suggesting certain employees may in future be able to work from home:
11) Audit report
Valuation of intangible assets joins revenue recognition as a key audit matter:
Interesting that stock valuation is not a key audit matter despite stock being the largest balance-sheet entry.
No major changes to audit materiality and the scope of the components covered:
12) Revenue geography
I had not realised Sweden was MCON’s third-largest market with c10% of revenue:
Sweden has a significant mining industry. Competitors Epiroc and Sandvik (cited in the blog post above) are Swedish.
13) Operating costs
Pandemic travel restrictions saved MCON €1.6m during the year:
14) Employees
Staff productivity unsurprisingly declined during FY 2020:
Revenue per employee reduced from €257k to €235k after the workforce was increased by 17% while sales gained 8%. Excluding redundant employees, staff costs represented 27% of revenue (versus 25% for FY 2019) but their average cost remained at c€63k.
15) Goodwill
Some useful numbers in here:
Goodwill is carried at €31m, and the €68m difference to its “fair value less cost” suggests MCON believes its 15 acquired business are worth at least €99m. MCON’s market cap at 115p is €280m.
The stated 17.8% Ebitda margin compares to 19.3% for FY 2020. The stated €7.1m capex compares to €7.2m for FY 2020. The stated investment expenditure of €1.1m compares to €1.1m for FY 2020.
MCON does not make clear how far in the future any specific goodwill valuation sums extend out to. The 2019 annual report relayed a different goodwill test, which was based on a specific three-year period followed by the terminal value calculation.
16) Inventory
The sizeable inventory levels referred to in the blog post above consist mostly of finished goods and work-in-progress:
17) Trade and other receivables
Nothing too untoward here:
MCON oddly does not disclose ‘trade receivables’ (i.e. money owed by customers), but only ‘trade and other receivables’. I suspect ‘other receivables’ are small in comparison.
Trade and other receivables represented 16% of revenue, which is at the low end of the 16%-22% range seen since 2010. The receivable impairment charge against earnings was €1.2m, versus €1.1m for FY 2019, so not a dramatic advance. MCON also claimed a €0.4m reduction to past-due-but-not-impaired receivables. All told, MCON appears to have controlled its customer credit well during the pandemic.
18) Trade creditors
MCON does disclose trade creditors (i.e amounts owed to trade suppliers). Largely unchanged on the year:
19) Non-controlling interest
MCON has bought a 20% minority stake for a possible €2m:
The 20% stake produced a €165k profit for FY 2020, so the potential multiple is 12x. Seems high for a private business operating in Africa. But revenue and profit for the subsidiary improved notably during FY 2020, so maybe its future is particularly bright.
20) Options
Options and similar awards number 4,825k, or c2.2% of the share count:
Earnings have to increase by 5%+CPI or 10%+CPI annually over three years for the options and awards to vest.
Maynard