22 March 2017
By Maynard Paton
Quick update on Mincon (MCON).
Event: Final results for the year ending 31 December 2016 published 21 March 2017
Summary: These were quite reasonable results, given MCON is still plugging away serving the subdued mining sector with its heavy-duty drills and bits. The introduction of a new accounting policy was disappointing, although the chief exec’s bullish commentary was encouraging and suggested the group’s expansion could accelerate in the years to come. Such growth ought to improve MCON’s rather average margin and return on equity numbers — at present those ratios may not be doing justice to the group’s competitive position. I continue to hold.
Price: 75p
Shares in issue: 210,541,102
Market capitalisation: £158m
Click here for all my previous MCON posts
Results:
My thoughts:
* Management’s upbeat outlook overshadowed the reasonable figures
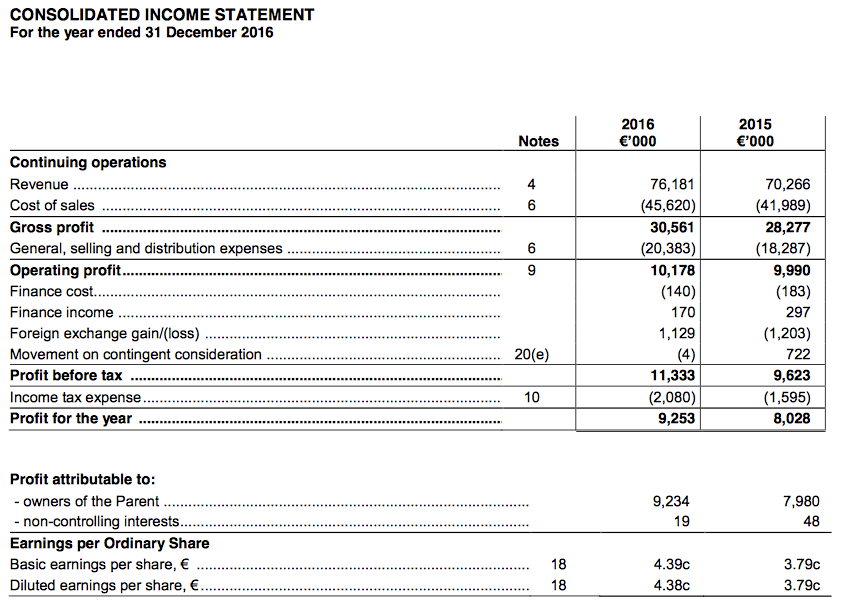
I was broadly satisfied with MCON’s annual results, which showed revenue up 7% and operating profit up 2%.
Various acquisitions this year and last ensured annual revenue reached a new peak during 2016, although profit remains below that recorded during 2011, 2012 and 2013:
| Year to 31 December | 2012 | 2013 | 2014 | 2015 | 2016 |
| Revenue (€k) | 63,143 | 52,343 | 54,544 | 70,266 | 76,181 |
| Operating profit (€k) | 12,724 | 15,012 | 10,350 | 9,990 | 10,178 |
| Other items (€k) | 416 | (2,527) | 364 | (481) | 1,125 |
| Finance income (€k) | 88 | 52 | 535 | 114 | 30 |
| Pre-tax profit (€k) | 13,228 | 12,537 | 11,249 | 9,623 | 11,333 |
| Earnings per share (c) | 4.81 | 4.80 | 4.34 | 3.79 | 4.39 |
| Dividend per share (c) | - | - | 2.00 | 2.00 | 2.00 |
Yesterday’s statement commendably included the full accounting notes, although the management narrative was somewhat terse. I’m therefore hoping MCON’s forthcoming annual report will disclose a little more about the group’s 2016 progress.
Nonetheless, shareholders were told that revenue growth was attributable to both in-house products (up 7%) and third-party items (up 13%), and was recorded in America (up 13%) and Australia (up 25%). Oh, and currency moves knocked €1.5m from the top line.
The statement’s clear highlight was the chief exec’s outlook commentary. The following extracts are the most optimistic I have seen from MCON for some years (my bold):
“The Mincon Group took stock in 2016…as we move towards building a 2020 strategic plan, and setting aggressive objectives for growth in sales and profits.”
“There has been a tone change in the market in 2016, the prices of commodities are on the rise, the companies in our sector speak with a new confidence and enthusiasm, and we see early evidence of renewed interest in reopening and developing business in some of the markets and sectors in which we operate.”
“Mincon is becoming better positioned in the market, and better positioned with innovative products that should see organic growth emerge at a higher level in the coming years.”
“We have an experienced management group, adequate funding, excellent products and an exciting product stream and I look forward to reporting on further progress in 2017 and beyond.“
The theory is that higher commodity prices ought to lead to more mining activity, which ought to lead to greater demand for MCON’s heavy-duty drills and bits.
* H1 vs H2 and the best-ever quarter for revenue
Sadly MCON’s second half was not as profitable as the second half of the previous year:
| H1 2015 | H2 2015 | FY 2015 | H1 2016 | H2 2016| FY 2016 |
| ||
| Revenue (€k) | 32,740 | 37,526 | 70,266 | 36,313 | 39,868 | 76,181 | |
| Operating profit (€k) | 4,507 | 5,483 | 9,990 | 4,903 | 5,275 | 10,178 |
I think the H2 shortfall was due mostly to a freakishly good Q3 during 2015, rather than a disappointing performance during 2016.
I am pleased that MCON’s gross margin was sustained at a 40% average throughout 2016, and that Q4 actually recorded the group’s best-ever quarter for revenue:
| Q1 2016 | Q2 2016 | Q3 2016 | Q4 2016 | |
| Revenue (€k) | 15,947 | 20,366 | 19,370 | 20,498 |
| Gross profit (€k) | 6,379 | 8,553 | 7,942 | 7,687 |
| Pre-tax profit (€k) | 1,563 | 3,445 | 3,680 | 2,645 |
* Margin, product development and competitive position
These results showed the full-year operating margin dropping a percentage point to 13%.
I must confess, that level of profitability is not spectacular for a business that claims its “highest design specifications” and “best manufacturing methods” make it “the driller’s choice worldwide”.
A few years ago when the mining sector was much healthier, MCON’s margin was more than 20%:
| Year to 31 December | 2012 | 2013 | 2014 | 2015 | 2016 |
| Operating margin (%) | 20.2 | 28.7 | 19.0 | 14.2 | 13.4 |
| Return on average equity* (%) | 28.7 | 25.8 | 18.6 | 12.7 | 13.0 |
(*adjusted for net cash and deferred consideration)
Mind you, I do get the impression MCON’s lower margin is due partly to greater product investment and development. This latest RNS included the following hints about where the expenses are going:
“The year has been one of investment for the future, in people, manufacturing capability, engineering design and future products.”
“We have also begun the investment in our carbide plant, with new multi process machinery for powder production, robotised button pressing, and new machinery to insource components for the rest of the Group.”
“We have other products in development and are looking to considerably step up that investment for the current year. Essentially we are building out a new category and are planning a soft release toward the end of the coming year.”
I bet the reference to “considerably step up that investment” is signalling greater costs and/or a lower margin for 2017.
The earlier table shows the lower margin achieved during the last two years has in turn depressed MCON’s return on average equity to a modest 13%.
* Capital expenditure and working capital
MCON’s H1 update revealed nothing in the way of free cash was produced during the first half, and my sums indicate less than €1m was produced for the full year.
The main cash-drain was capital expenditure, which used €5.2m throughout 2016 and presumably was associated with the aforementioned new-product development. MCON’s Q3 update had disclosed the existence of a “three-year plan”, which implies the heftier capex is set to continue this year and next.
| Year to 31 December | 2012 | 2013 | 2014 | 2015 | 2016 |
| Operating profit (€k) | 12,724 | 15,012 | 10,350 | 9,990 | 10,178 |
| Depreciation and amortisation (€k) | 1,708 | 1,874 | 2,053 | 2,346 | 2,332 |
| Net capital expenditure (€k) | (5,050) | (2,070) | (1,750) | (1,768) | (5,246) |
| Working-capital movements (€k) | (7,315) | (389) | (6,503) | (2,837) | (1,152) |
| Net cash (€k) | 7,396 | 48,600 | 41,754 | 38,610 | 34,960 |
Meanwhile, working-capital movements for the year did not appear too bad, with a net €1.2m being absorbed into stock, debtors and creditors. However, I do recall MCON’s H1 statement suggesting the overall movement would be closer to zero for 2016.
After these results, I am now more hopeful that MCON will be able to prevent repeating the large working-capital outflows seen during 2012 and 2014.
That said, MCON’s warehouses continue to hoard immense amounts of stock — €35m at the year-end, compared to revenue of €76m.
Furthermore, past-due invoices currently represent 21% of all outstanding invoices, which is notably higher than the 9%-14% range seen during the previous five years:

Indeed, the Q3 update ominously referred to some debtors being on a “work out”. I think that was code for MCON trying to “work out” whether those invoices would be paid or not.
* “A distortion to short-term earnings”
Something new — and unwelcome — to MCON’s accounts was the capitalisation of certain R&D costs.
MCON had previously written off all R&D costs as incurred, and I had warmed to such conservative bookkeeping.
However, these results unveiled costs of €500k side-stepping the income statement to instead be placed on the balance sheet:
“We have capitalised €499,000 in development expenditure in 2016, which we expect to begin to release as a particular set of products become commercialised in the next year or so.”
This next quote prepares the ground for greater capitalisation for 2017 (my bold):
“While this is not hugely material as it stands and we have historically written off R&D as we spend it, we are going to have to step up the expenditure around this project in order to bring it to a commercial proposition with an accelerated timetable.”
What unnerves me about this accounting change is that it was implemented (perhaps) to ensure reported earnings would not suffer:
“We have addressed the matter in 2016 as otherwise the expenditure in 2017 would potentially cause some distortion of short term earnings.”
Oh dear. I reckon most investors will easily see through the forthcoming earnings flattery.
I just hope MCON’s amortisation policy will write off this expenditure sooner rather than later. No amortisation was applied during 2016.
* Dividend, cash position and acquisition strategy
With free cash flow at less than €1m, I guess it was no surprise the annual dividend was held at €0.02 per share (€4.2m).
Cash in the bank dropped from €41m to €37m during the year, and the funds remain available for acquisitions.
However, MCON did reinforce comments from previous updates that it was particularly choosy when it came to evaluating potential purchases. As far as I can tell, the main focus at present is organic expansion (which I welcome).
(Past acquisitions have not been too grandiose anyway, with €16m spent on nine deals during the last three years.)
The balance sheet also carries debt of almost €2m and a deferred-consideration liability of nearly €6m, which leaves effective net cash at about €29m.
Valuation
MCON’s 2016 operating profit of €10.2m converts to £8.9m at £:€ 1.15. Apply last year’s 18% tax rate and earnings come to £7.3m or roughly 3.4p per share.
Then subtracting the effective €29m (£25m) net cash position from the £158m market cap, my estimate of MCON’s enterprise value (EV) comes to £133m or 63p per share.
Dividing that 63p per share EV by my 3.4p per share EPS guess gives a multiple of 18 at the present 75p mid-price.
I think the group would really have to deliver on the chief exec’s optimism for the next year or two for that rating to be viewed as an obvious undervaluation.
Meanwhile, the maintained €0.02 annual dividend currently funds a 2.2% income.
Maynard Paton
Disclosure: Maynard owns shares in Mincon.

Mincon (MCON)
Publication of 2016 annual report
MCON published its full accounts within its annual results RNS, so there wasn’t too much extra information supplied in the annual report. However, the management narrative did not contain as much information as the 2015 report. In particular, there was no reference to revenue derived from particular products while the large ‘strategic goals’ table (which compared the group’s targets after flotation to what subsequently occurred) was absent.
Anyway, here is what I found of interest:
1) Extra chief exec commentary
The chief exec’s commentary contained two extra snippets of info.
First, the group’s greater level of capex will continue for 2017:
Second, customers remain hard to please:
2) Industry overview
This report contained a much shorter ‘industry overview’. I hope that was because the sector appears to be recovering and there is no need for a lengthy explanation about cyclicality.
Here is the ‘industry overview’, with the interesting text highlighted:
3) Net working capital
The report helpfully provided some extra commentary on the group’s somewhat significant working-capital movements. Apparently the management has a stock ‘right-sizing’ objective for 2017:
4) Trade receiveables
The report also disclosed a little extra information about the mysterious ‘work-out’ of certain trade debtors I referred to in the Blog post above:
It appears the owed money is being slowly collected.
5) Group strategy
The report presented a revised ‘group strategy’, which contained nothing too radical from the previous effort. Here are the full details:
6) Director pay
No complaints here. Executive wages were held at 2015 levels:
7) Employee costs
Nothing too untoward here:
The average employee cost was €64.4k (€64.9k for 2015) and the average revenue per employee was €256k (€260k for 2015). Total employee costs as a proportion of revenue was 25.2% (24.9% for 2015).
Maynard
Mincon (MCON)
Q1 Trading Update
This Q1 statement was actually published on 28 April. However, my time back then was being absorbed by matters outside of investing and I completely overlooked the update. It was only catching up on MCON’s interim results from August — overlooked again by me because of different matters outside of investing! — that I realised this Q1 update was quite significant.
Anyway, here is the Q1 statement interspersed with my comments:
——————————————————————————————————————————-
Revenue
Revenue in Q1 2017 has increased 34% compared to Q1, 2016 driven by increased sales volumes achieved across all of our main geographic regions with particular progress in Africa, but strong growth seen also in Australia, North America, and Europe. On a constant currency basis the growth is approximately 25%.
Very little of this uplift was driven by acquisition uplift as we bedded down what we had previously bought and co-ordinated the businesses better in the second half of last year. We also had a tremendous amount of new engineered products coming through and while this added little to the sales in Q1, the future profitability of the Group is determined, in large part, on additional and better engineered product being our market advantage.
Q1 revenue up 34% — or 25% adjusted for currency movements — is very promising, especially as the progress is almost entirely organic. For 2015 and 2016, underlying annual sales improved by 7-8% — so there is a suggestion now that a step-change in fortunes may have occurred.
Indeed, my Blog post above did note how MCON’s chief exec had become somewhat bullish within March’s annual results. With hindsight, it appears that bullishness was based on these Q1 figures, which were almost in the bag at the time.
Based on my own estimates of MCON’s quarterly progress, I reckon Q1 2017 witnessed revenue of €21,368k — MCON’s best-ever quarterly sales performance.
What’s more, Q1 is traditionally the group’s quietest quarter.
For 2014, 2015 and 2016, Q1 revenue represented 18%, 20% and 21% of full-year revenue respectively.
As such, this Q1 performance bodes well for the rest of the year. I am hopeful quarterly revenue could approach €24m or even €25m later this year.
Sales of Mincon manufactured product rose 27% in Q1, 2017, while that of third party manufactured product increased by 58%. Some of that third party product in Q1, 2017 (c.US$800,000) was the sale of small third party rigs in Africa at very little margin, in effect an agency type of transaction. We still have our rigs inventory, but see signs of the market finally beginning to move, with renewed interest, but still with little financial support as yet.
We sell products complementary to our own manufactured ranges, upon which we receive a distributor margin. While these products may make a meaningful contribution to addressing the sales and administration overhead, they do not add a great deal to the bottom line. We make a better margin on Mincon manufactured product and we actively consider the product ranges we make and buy to see what adds value and what, over the longer term, may not.
Sales of MCON’s own product gained 27%, which I guess after currency movements may be about 18% and still very impressive.
It appears a fair amount of other, distributor-type, sales carried very little margin. That said, it is encouraging that customers are buying more third-party equipment and underlining the suggestion that MCON’s mining clients may be happier to spend again.
Margins
Overall, due mainly to the change in the sales mix, the gross margin came down a couple of points compared to last year in Q1 to 37% as opposed to the 40% of 2016, but the operational gearing effect led to an operating profit for the quarter of 11.5%, compared to 10% in Q1, 2016, and an Ebitda margin of 14.7%. A small adverse FX charge delivered profit before tax at 10.8% compared to 9.8% last year.
What we added to the margin through capitalising the investment in the new hammer range, we have reduced by establishing additional provisions, so on a look through basis the results for last year and this are directly comparable. The new hammer range and service is progressing well, and on schedule for beta testing in H2. A new service centre has been established and staffed in Australia, proximate to key customers.
While there is some supplier pressure on inputs, the improving market will, through the cycle, also offer the opportunity to earn a better margin through engineering. The market will reward better products in an up cycle.
Okay, so the greater revenue hasn’t really translated into greater margins. And as per my comments in the Blog post above, MCON’s operating margin (of 11% in this Q1) is not spectacular for a business that claims its “highest design specifications” and “best manufacturing methods” make it “the driller’s choice worldwide”.
I continue to believe MCON is investing significantly in new products etc and as the company claims, these better products will enjoy better margins during an “up cycle“.
Balance sheet
The Group balance sheet continues to be undergeared with net cash at the end of Q1, 2017 of €37.3 million (31st December 2016: €35 million), and while sales have advanced strongly the trading working capital was unchanged with the only change being the deposits of €540,000 on capital equipment approved and on order from the year end. Working capital remains a key focus of management.
There were no other items of significance in the balance sheet at the end of Q1, though Q2 will see the further investment in capital equipment as previously highlighted at the year end, and the payment of the final dividend.
I like the term ‘undergeared’ :-) I also welcome the fact that “trading working capital was unchanged“. For a few years now, MCON’s working-captial position has absorbed a significant amount of cash flow and, as per my remarks in the Blog post above, I am hopeful the group is now able to manage is stock, debtors and creditors with greater efficiency.
Acquisition of PPV Finland (PPV) by our subsidiary Mincon Nordic Oy.
In April, 2017 we acquired the product range, including the engineering, customer base, patents and brands of the PPV business. The sales run rate for PPV was approximately €3 million last year. We also signed a four year manufacturing agreement for the existing range with the current supplier, Lehti Group, and we will continue to build out and staff this strategic development by integrating it in our new engineering and sales hub in the Nordic region.
The PPV core products
PPV designs, develops and sells innovative contracting tools for the foundation and well drilling industries. The products are especially useful for complex ground conditions, and where ground disruption must be minimized, such as heavily built up areas, or for example, off-shore.
The core products are:
· Overburden drilling systems
· Large diameter rock bits
· Drill string components
· Large diameter hammers
· Modification sets for rigs
· Rock socket grouting systems for large O piling
· Products that can be used on and off shore
The acquisition is strategic, with products that complement our existing range and extend it, which reduce our dependence on distributors that are emerging as competitors, and which will give us opportunities to access new markets for our existing and growing portfolio of products. We will continue to build out our hammer and bit ranges.
The 34 inch hammer developed by PPV and the very large diameter bits occupy the top end of our current ranges, and complement the manufacturing capability established by Mincon last year. Since that investment we have successfully launched our new 12 inch and 18 inch hammers, and the addition of PPV gives us a wide range of reference sites in piling, tunneling and construction.
We are actively engaged in further acquisition discussions to add products, companies and management teams to our Group.
This acquisition does not look too alarming to me. It seems to fit MCON’s past strategy of purchasing smaller operators that can fill a product niche that is currently absent from the wider group’s range.
Market comment
We would, in general, caution against taking this first quarter as a new run rate, even though the growth has been spread across most of our markets. A sector recovery, and to a degree we depend on this for growth in revenue and margin, can be fitful at the early part of the cycle and may not follow a straight line recovery profile by any means. However we believe we are working towards an improving position in products, people, customers and resource for the next few years, to build growth and resilience in our business.
Well, it is difficult not to take this Q1 performance as a new run rate, given past Q1s have been the quietest quarters of the year. The remark about growth being spread across most of the group’s markets is encouraging for further progress, too.
——————————————————————————————————————————-
Maynard