13 September 2016
By Maynard Paton
Quick update on City of London Investment (CLIG).
Event: Final results for the year ending 30 June 2016 published 12 September 2016
Summary: I’m starting to go off City businesses. First it was Record and now it is CLIG that wants to pay its employees a lot more… despite profits at both having gone nowhere for years. Sadly, CLIG’s revised bonus plan has offset some promising news of greater funds under management and the real prospect (finally!) of a dividend lift. I can only hope the fund manager can soon deliver the much-needed performance to justify the extra bonus cost. I continue to hold.
Price: 360p
Shares in issue: 26,896,707
Market capitalisation: £96.8m
Click here for all my previous CLIG posts
Results:
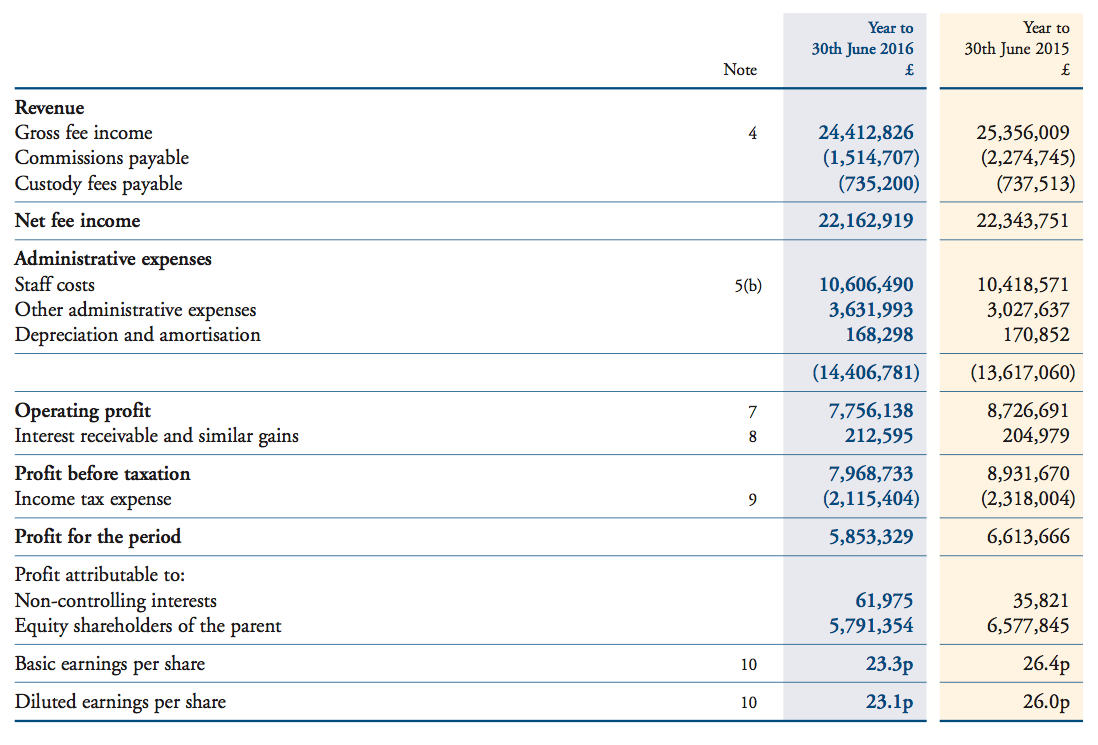
My thoughts:
* These results confirmed the summary accounts issued during July
The numbers showcased within yesterday’s RNS were no real surprise — the figures had already been summarised within a trading update during July.
However, these final results did not exactly match the earlier summary numbers.
Earnings and net assets were declared as £5,853k and £14,121k respectively, versus the £5,945k and £14,213k stated during July. The differences were due to £92k being added to the tax charge.
Accompanying the results RNS was the 2016 annual report, and the various charts it contained had not changed from July’s update.
* New client money did fall short of expectations, but not as much as I had calculated previously
I must confess that I knocked CLIG unfairly within my verdict on July’s update.
I wrote back then that CLIG had “predicted new money of $500m could be garnered during the year just passed”.
I then added: “However, I see from the latest 2016 presentation that the money from the 13 new clients secured during 2015 and 2016 came to less than $400m.”
The 2016 annual report clarifies exactly how much new money was raised:
Where I went wrong was by looking at the amount of new money raised from new clients, instead of new and existing clients.
Nonetheless, the $476m of new money raised from all clients was still short of the original $500m target.
Furthermore, the $125m of net new money raised does mean that CLIG’s funds lost $341m due to investment performance last year — equivalent to 8% of their starting value.
At least that 8% loss was better than the 12% loss suffered by CLIG’s emerging-market benchmark index.
* Staff bonus pot to increase from 30% to 35% of pre-bonus profit
I mentioned in July that CLIG was still contemplating changes to the group’s employee share ownership plan (ESOP).
I also mentioned that the term “Existing ESOP is considered uncompetitive” was telling me that the new ESOP would be more expensive to shareholders.
Sure enough, these results have confirmed the new plan will indeed be more expensive to shareholders.
Here is the relevant text from the annual report:
“While CLIG has had an ESOP in place for many years, the shares held for the ESOP by the Trustees on behalf of staff have not received dividends. This has meant that the annualised rate of total return of approximately 11% received by an initial investor at the point of CLIG’s IPO has been reduced very significantly for ESOP holders. Specifically over the past few years the dividends have made up a very significant percentage of the total return.
In an attempt to broaden the base of employee ownership, encourage direct staff participation and make CLIG shares more attractive to staff, we will be bringing forward to shareholders a proposal at the forthcoming AGM. This proposal will include, for a four year period, an increase in the staff bonus pool from 30% to 35%. This increase will only apply while the dividend payable to shareholders is at least maintained at 24p.
The additional 5% from the bonus pool will be offered to staff as a contribution towards the new Employee Incentive Plan, on condition that they put up matching funds.
This will have the effect of incentivising participating staff by matching their investment with an equivalent contribution from the company.”
I can’t say I’m impressed.
For a start, it is not obvious to me that CLIG’s performance during the last few years justifies a larger bonus pool for staff.
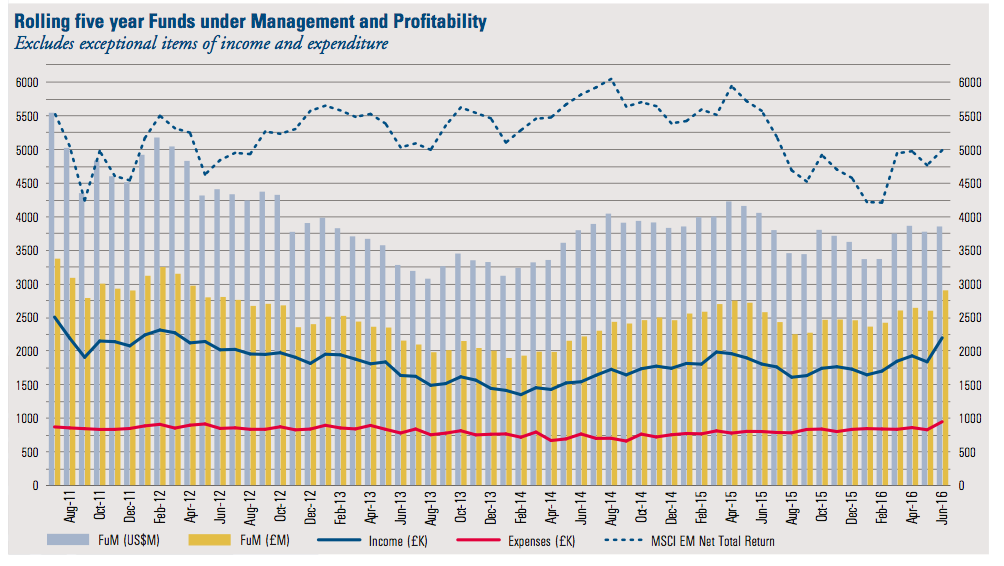
The chart below shows that funds under management (the light blue bars) have declined much further than emerging markets in general (the dotted line), leaving CLIG’s income (the dark blue line) stagnant at best since 2011:
Judging by the annual report, it appears CLIG’s employees are annoyed about their ESOP shares not accumulating the significant dividends that have been declared during recent years.
I would counter that by arguing that if the staff had actually worked harder to increase and maintain funds under management, their ESOP shares might have been worth a lot more through substantial capital gains…
…and the missed dividends may not have been so much of an issue.
As it is, the staff have seen the price of their ESOP shares go nowhere for the last five years:
…and sadly management has given in on the (presumed) unrest within the company.
* Why not just pay the staff their ESOP dividends?
For some perspective, the 30% bonus pool last year came to £3,720k… and therefore a 35% pool would have added a further £620k to the pot.
That extra £620k bonus would have reduced 2016 pre-tax profit by almost 8%, although the tax charge would have been £165k lighter at £1,950k to leave after-tax profit a net £455k down at £5,399k.
In my opinion, a fairer way to appease staff would be to simply pay the waived dividends on the ESOP shares:
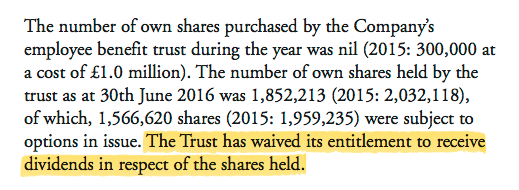
At the last count there were 1,852k ESOP shares, which would have cost CLIG an extra £444k had they all received last year’s 24p per share dividend.
This dividend-based alternative is not ideal, as it still involves a not insignificant extra cash cost to shareholders.
However, the dividend alternative would more align CLIG’s staff with shareholders.
You see, as the proposed bonus plan stands now, CLIG’s staff could enjoy the extra bonus as earnings rise… but with shareholders still receiving the same 24p per share dividend.
And that brings me to another niggle about all of this — it is a tad galling to see the 35% bonus pool can be operated during years when the dividend is held (but not reduced).
I mean, loyal shareholders have survived on the same 24p per share payout for six years now…so it would be nice if the additional ESOP payments were made only if our payout was raised, too.
* More votes against executive pay at the AGM?
The plan to enlarge the bonus pool to 35% of pre-bonus profit is subject to a vote at October’s AGM.
I’m certainly against the proposal, and I dare say other investors will be as well.
In fact, the annual report shows 18% of votes cast objecting to CLIG’s Remuneration Policy last year:
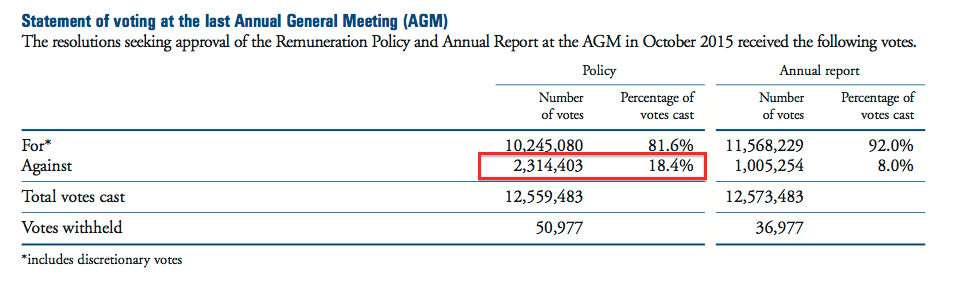
The two previous years witnessed protest votes of 16% and 74%, as various concerns were voiced about the ESOP plan and payoffs to former directors.
Anyway, I do hope this enlarged bonus-pool resolution is voted down. I guess many shareholders have simply become fed up with CLIG’s expensive employees and their stagnant performance.
But it could be worse — CLIG might have ‘done a Record’ and just given staff members a flat 10% pay rise… without any performance justification or shareholder vote whatsoever.
* Some stats about staff performance
To CLIG’s credit, the annual report does include a ten-year table that summarises the “average employee remuneration” and the percentage change on the previous year:
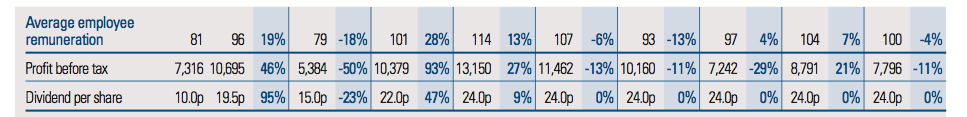
I have performed my own calculations, where “employee remuneration” includes all employee costs (wages, bonuses, taxes, pensions, options, etc).
I have also compared funds under management and gross fee income to the number of employees. Here is a summary from the last five years:
| Year to 30 June | 2012* | 2013* | 2014** | 2015 | 2016 |
| Funds under management ($m) | 4,479 | 3,713 | 3,944 | 4,211 | 4,005 |
| Gross fee income (£k) | 34,143 | 29,364 | 24,215 | 25,356 | 24,413 |
| Total employee cost (£k) | 12,178 | 11,666 | 9,550 | 10,419 | 10,606 |
| Number of employees | 77 | 77 | 70 | 70 | 72 |
| Per employee: | |||||
| Funds under management ($m) | 58.2 | 48.2 | 56.3 | 60.2 | 55.6 |
| Gross fee income (£k) | 443 | 381 | 346 | 362 | 339 |
| Average employee cost (£k) | 158 | 152 | 136 | 149 | 147 |
| Total employee cost/Gross fee income (%) | 35.7 | 39.7 | 39.4 | 41.1 | 43.4 |
(*Year to 31 May ** 13 months to 30 June)
Essentially fee income per employee has reduced significantly, while the overall cost per employee is down by much less. As such, the proportion of fee income being paid to staff has advanced notably — from 36% to 43%.
All told, the employee stats do not suggest any major improvements in productivity of late. And yet CLIG’s board wishes to expand the bonus pool from 30% to 35% of profit…
There is one straw to clutch here — greater funds under management may not need more in the way of expensive staff. During 2011, 68 staff members looked after almost $6bn of client money — or $86m each (versus $56m for 2016).
* At least the accounts appear to be in order
The fundamentals of CLIG’s accounts remain quite satisfactory.
The full balance sheet was confirmed as holding cash of £10,151k, investments of £2,200k, non-controlling investments of £632k and zero debt. I make that to be net cash and investments of £11,719k.
Less regulatory required capital of £1,400k gives me effective net cash of £10,319k or 38p per share.
Meanwhile, the cash-flow statement once again displayed little in the way of capital expenditure and demands on working capital:
| Year to 30 June | 2012* | 2013* | 2014** | 2015 | 2016 |
| Operating profit (£k) | 11,034 | 8,359 | 6,998 | 8,727 | 7,756 |
| Depreciation and amortisation (£k) | 348 | 223 | 185 | 171 | 168 |
| Net capital expenditure (£k) | (400) | (60) | (38) | (108) | (137) |
| Working-capital movement (£k) | 109 | 1,046 | (1,933) | 442 | (22) |
| Net cash and investments (£k) | 12,356 | 13,947 | 11,031 | 11,707 | 11,719 |
(*Year to 31 May ** 13 months to 30 June)
And despite CLIG’s high wage bill, profitability remains impressive and leads to some appealing return on average equity numbers:
| Year to 30 June | 2012* | 2013* | 2014** | 2015 | 2016 |
| Operating margin (%) | 32.3 | 28.5 | 28.9 | 34.4 | 31.8 |
| Return on average equity (%) | 57.5 | 85.7 | 36.1 | 47.7 | 42.7 |
(*Year to 31 May ** 13 months to 30 June)
Valuation
The 2016 annual report includes CLIG’s usual exchange-rate/FUM table, although it uses a 30% staff profit share for the calculations:
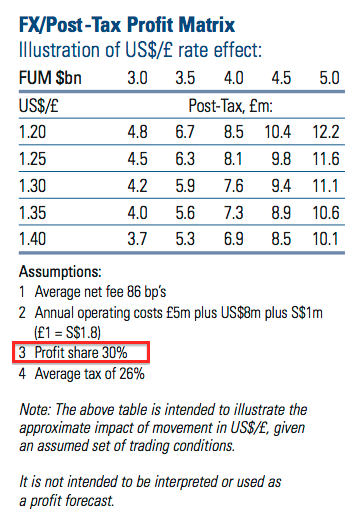
I would have thought a 35% profit share would now be more appropriate.
Anyway, CLIG’s results confirmed that funds under management had enjoyed a welcome 10% advance to $4.4bn since the year-end.
So, with £1 currently buying $1.33, I reckon current earnings could be running at £8.1m or 30.2p per share based on the above table but with a 35% profit share.
(With a 30% profit share, I calculate earnings could be £8.7m or 32.5p.)
After adjusting for my net cash figure of £10.3m, my enterprise value (EV) for CLIG is roughly £86m or 322p per share. Dividing that EV by my earnings guess gives me a possible P/E of 10-11.
That multiple does not look outlandish at present, although do bear in mind the shares have rarely traded at extended multiples in the past.
At least my 30.2p per share earnings guess supports what could be a lifted dividend for the current year.
The payout has been stuck at 24p per share for six years now and the annual report does hint at a payout improvement:
For now, though, a 24p per share dividend on a 360p share price gives a 6.7% income.
Maynard Paton
Disclosure: Maynard owns shares in City of London Investment.

City of London Investment (CLIG)
Further snippets from the annual report:
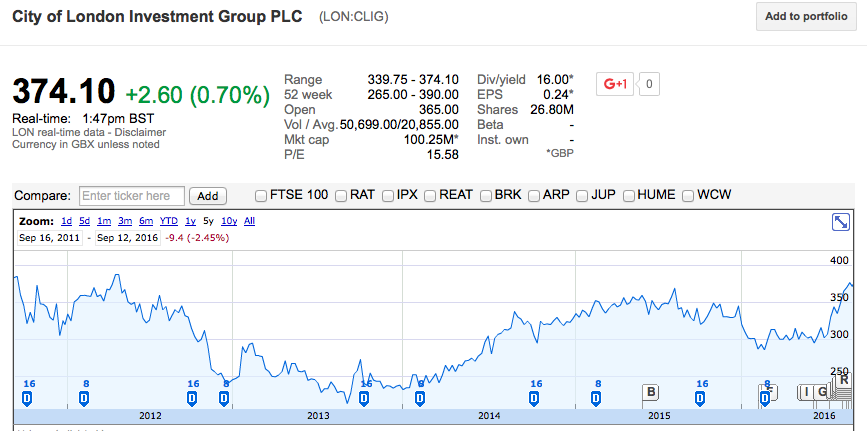
1. Bold remarks about share-price comparison.
I thought it was bold of chief executive Barry Olliff to say that progress (at least this year) should be measured by the share price:
The share-price chart Mr Olliff likes is this one:
However, the five-year share-price chart I used in the Blog post above (and repeated below) is not so great:
I do think Mr Olliff ought to measure CLIG’s progress by funds under management, ROE, dividends, etc, rather than the share price. The share price will look after itself over time if the business performs well.
2. Transparent share-sale disclosure
I can’t fault Mr Olliff for his transparent share-sale disclosure:
I think he is unique in stock-market circles for such declarations. Mr Olliff currently owns 2,775k shares and plans to retire in c2019.
3. Director pay
The board did not enjoy enormous pay rises last year:
Mr Olliff’s reported increase was due to him being paid in US dollars. Mr Griffith’s pay rise was due to his extra board responsibilities.
It is also worth noting that Mr Olliff collected 4.2% of pre-bonus profit last year:
(He is entitled to 5%).
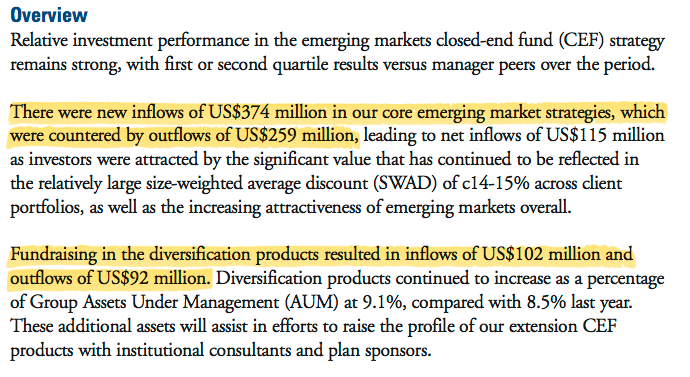
4. Net inflows/outflows of client money
It’s a shame this chart does not detail the exact amounts of new client money inflows/outflows (in yellow):
Still, the yellow bits do look small to me. I must compare CLIG’s ability to recruit new money to that of other fund managers — I get the impression CLIG is a laggard in this respect.
I think that is all for now.
Maynard
Very interesting as ever thanks,
I have been interested in CLIG for a while and I just think it’s such a shame they are pursuing this remuneration package. There seems to be a spate of this sort of thing recently despite rising shareholder dissatisfaction.
I am highly sceptical that these awards even motivate staff. As you’ve said, they already stand to gain by increasing the share price.
While it’s not in the same league as vislink, I think of what’s happened there and shudder!
Hello doug2500,
Yes, it is a shame. The company and staff need to deliver first to justify this extra bonus. The extra payment, if approved, will come into effect from October 2017, so there is some time for things to pick up. Of course, this coming year is likely to be better for CLIG purely due to the weaker GBP. We need to see funds under management improve, too.
Maynard
City of London Investment (CLIG)
Broker notes:
From Zeus Capital and Hardman & Co:
http://citlon.co.uk/shareholders/share_reports/ZeusCapitalReport9_16.pdf
http://citlon.co.uk/shareholders/share_reports/HardmanCligReport9_16.pdf
The notes include some ambitious forecasts.
Zeus reckons funds under management will increase by $801m to $4.8bn during 2017, and by a further $400m during 2018.
Zeus’s guess for net client-money inflows for 2017 is $500m, which is what CLIG is targeting for new money before outflows. The past two years have seen outflows of $457m and $351m, so Zeus assuming a $0m outflow for 2017 seems optimistic to me.
Also, Zeus’s profit sums for 2018 are based on a 30% profit share, despite the 35% profit share coming into force from October 2017.
Hardman appears to be forecasting FuM to grow from $4bn to $4.87bn for 2017 and to $5.53bn for 2018 on page 1 of its report, but on page 6 the FuM numbers are different. The FuM growth %s on page 6 suggest the page 1 FuM numbers are the actual projections.
Hardman hasn’t disclosed the finer points of its FuM forecasting, but going for $4.9bn does mean CLIG will i) have to meet its $500m target for new client money ii) have nothing in the way of client outflows, and iii) have to hang to the $4.4bn FuM it currently enjoys.
For some perspective with the perils of FuM forecasting, I have a Hardman note dated January 2015 which predicted FuM of $5.48bn for 2016. The figure the latest results confirmed was actually $4.0bn.
Maynard
City of London Investment (CLIG)
Monthly FUM Update
http://www.citlon.com/shareholders/announcements.php
CLIG has announced on its website that Funds Under Management at the end of September have inched higher to about $4.3bn:
Using the latest FUM/FX earnings table shown in the Blog post above, and adjusting for a 35% bonus pool, current earnings could be running at £8.57m — equivalent to 31.9p per share — with £1 buying $1.24.
Maynard
(EDIT: PS: CLIG confirms $4.3bn FUM here: http://ww7.global3digital.com/citlon/regulatorynews_item.jsp?ric=CLIG.L.TK&ref=114876)
City of London Investment (CLIG)
AGM attendance:
I attended CLIG’s AGM on Monday 17th October at the group’s office in central London. No proof of shareholder ownership was needed to take a seat at the meeting.
It was difficult to tell exactly, but I think there were perhaps four or five other private investors in attendance alongside a small bevy of advisers etc. All the directors were in attendance.
During the formal part of the meeting, the discussion — led by me — centred on Resolution 19 and the creation of the Employee Incentive Plan (EIP) that expands the staff bonus pool from 30% to 35% of pre-bonus profit.
Here is my best recollection of what was said, generally paraphrased:
* The EIP was devised for “succession planning” purposes — chief exec and 10% shareholder Barry Olliff retires in 2019 and clients would like to see staff own a greater part of the business once Mr Olliff has left.
* I asked why one third of the extra EIP shares could be sold after one year when Mr Olliff said in the annual report of wanting staff to be ‘owners’ and not ‘renters’.
A long and protracted reply followed, but the gist was that the workings of the scheme was guided heavily by the differing taxation regulations of staff in the UK and US.
The chief exec said he had made clear to staff what the point of the scheme was, and if staff were selling all their extra shares after just one year, the board could amend the plan. The remuneration chairman claimed if the shares had to be held for ten years instead of one, “people would still leave“.
The tax implications appeared to prevent much in the way of looking at alternative bonus plans. I suggested paying out a bonus pool of, say, 40% if client money hit £5bn or the share price hit 500p, but the answer still came back to keeping everything fair tax-wise for US/UK staff.
I got the impression taxation of staff was the primary factor to determine how the scheme worked, rather than what was best for the wider business and shareholders.
* Will CLIG recover the extra cost of the EIP by increasing fees to clients (who appear to want the EIP in the first place)? A few chuckles from the board — basically no chance.
* Do staff actually deserve the extra EIP? The chart on page 15 of the 2016 annual report shows client funds and income both stagnating for the last five years.
The chief exec claimed CLIG’s performance had been relatively good over the years, and better than that of some of its peers (e.g. Aberdeen Asset). Emerging markets had been tough during that period, too.
I can’t recall from my notes or memory any outstanding response to my assertion that CLIG’s assets under management (AUM) have essentially tracked its emerging-markets benchmark index over time — and why therefore should staff be rewarded for an extras 5% of the bonus pool through the EIP?
One non-exec did chip in by saying the EIP was necessary to “maintain” current client AUM, which I felt was a bit sad as most other companies pay more to staff for: i) expansion purposes, or; ii) a reward after doing well.
* The chief exec suggested one third of staff could be expected to participate in the EIP — by sacrificing part of their bonus in exchange for twice the amount via EIP shares. I suggested that take-up rate seemed low given the upside from the EIP was obvious and significant. He mentioned a young workforce with commitments such as mortgages etc.
* EIP ‘dividend equivalents’ — the board acknowledged the extra shares held by the EIP will attract ‘dividend equivalents’ paid out of the ordinary dividend. This is an extra little cost to shareholders — shares in the current employee scheme do not attract dividends.
I think I was the only hand to vote against Resolution 19 — it was passed :-(
That concluded the end of the formal business, which was followed by some general questions about the company from other shareholders.
Nothing too insightful was revealed. Apparently the group’s three ‘business development’ staff are ‘introducers’ of clients to CLIG — the selling is done by the fund management team.
I did ask why CLIG’s claimed investment out-performance had not led to greater client AUM, and the answer mentioned ‘niche sector’ and ‘difficult markets’. It also mentioned winning mandates was often based on clients being unhappy with their current fund manager — so CLIG needs others to fail first to benefit.
CLIG has capacity to increase its emerging-market AUM from $3.6bn to $4.2bn, and the capacity to increase other AUM to match the size of its emerging-market AUM.
Overall, this was a bit of a disappointing meeting.
It seems to me the extra staff EIP is an example of clients having a lead on CLIG, whereby they can ask CLIG to incur extra costs to keep them onboard — but not stump up a penny themselves. It is us poor shareholders that foot the bill.
The chief exec made the point that he is a significant shareholder, but then again he is also an employee, is selling his shares and will retire during the next three years.
In the post-meeting chit-chat, I asked the chief exec whether CLIG was being run for the benefit of the staff or the benefit of shareholders — I was told you need to pay the staff for shareholders to benefit.
Maynard
City of London Investment (CLIG)
Letter from Chief Executive Barry Olliff:
I have received a letter from chief executive Barry Olliff following my AGM attendance. Here it is:
Credit to Mr Olliff for writing the letter, unearthing my address somehow and Fedex-ing it across from the States.
Maynard
Hello Maynard
Great update for CLIG.
Does the lack of positive arguments from management incline you towards selling? My long holding in this sector is Aberdeen (ADN). If you have the time/interest I would really appreciate a comparison of the two from your perspective.
Kind regards
John
Hello John
Thanks for the Comment. I am not inclined to sell, but am a bit deflated with the company as essentially this is extra money being funded by shareholders simply to maintain the current state of affairs. I guess that is part and parcel with this particular sector — the staff appear to extract more of the profit with a so-so business performance (e.g. Record as well).
I must admit I am not inclined to look at Aberdeen or any other fund manager right now — I did quickly look at Aberdeen’s AUM performance over recent years as a comparison to CLIG before the AGM, and I noticed the performance was not very good. I think Mr Olliff cited Aberdeen as an example of how badly some managers have fared with emerging markets during recent times.
Maynard
City of London Investment (CLIG)
Monthly FUM Update
http://www.citlon.com/shareholders/announcements.php
CLIG has announced on its website that Funds Under Management at the end of October have slipped to about $4.2bn:
Using the latest FUM/FX earnings table shown in the Blog post above, and adjusting for a 35% bonus pool, current earnings could be running at £8.15m — equivalent to 30.3p per share — with £1 buying $1.25.
Maynard
City of London Investment (CLIG)
Monthly FUM Update
http://www.citlon.com/shareholders/announcements.php
CLIG has announced on its website that Funds Under Management at the end of November have slipped to about $4.0bn:
Using the latest FUM/FX earnings table shown in the Blog post above, and adjusting for a 35% bonus pool, current earnings could be running at £7.41m — equivalent to 27.6p per share — with £1 buying $1.26.
Maynard
City of London Investment (CLIG)
Monthly FUM Update
http://www.citlon.com/shareholders/announcements.php
CLIG has announced on its website that Funds Under Management at the end of December have increased slightly to about $4.05bn:
Using the latest FUM/FX earnings table shown in the Blog post above, and adjusting for a 35% bonus pool, current earnings could be running at £7.91m — equivalent to 29.4p per share — with £1 buying $1.22.
Maynard