23 March 2020
By Maynard Paton
Results summary for City of London Investment (CLIG):
- Funds under management rallied to a record level in GBP terms, lifting revenue by 11%, profit by 22% and the dividend by 11%.
- However, the market crash that followed these results has superseded a lot of the statement’s commentary and accounting.
- Profit may now be running almost 40% lower than at the start of the year and may just about cover the 28p per share full-year dividend.
- The accounts continue to sport high margins, decent cash flow and net cash — all of which ought to see the business through the present downturn.
- Although the shares have been rated modestly on a P/E basis for years, the possible yield now tops 9%. I continue to hold.
Contents
- Event links and share data
- Why I own CLIG
- Results summary
- Revenue, profit and dividend
- Funds under management
- Fees
- Dividend-cover template and FuM/exchange-rate table
- Management
- Financials
- Valuation
Event links and share data
Event: Interim results and presentation for the six months to 31 December 2019 published 17 February 2020.
Price: 300p
Shares in issue: 26,560,707
Market capitalisation: £80m
Why I own CLIG
- Emerging-market fund manager that employs a lower-risk strategy of buying investment trusts at a discount.
- Accounts showcase high margins, net cash and the ability to distribute the majority of earnings as dividends.
- Just-about-covered yield of 9% offers upside potential should the wider market rebound and/or elusive new clients ever bolster funds under management.

Further reading: My CLIG Buy report| All my CLIG posts | CLIG website
Results summary
Revenue, profit and dividend
- The market crash that followed these results has superseded most of the statement’s commentary and overshadowed a lot of the accounting.
- After all, CLIG is a fund manager — and the level of the company’s earnings and dividends are inherently linked to the ups and downs of its funds under management (FuM).
- Lower FuM — through market declines and client withdrawals — could have a significant adverse effect on near-term profits (see Valuation below).
- Still, monthly website updates followed by a bumper Q2 statement issued during January meant these figures contained no surprises.
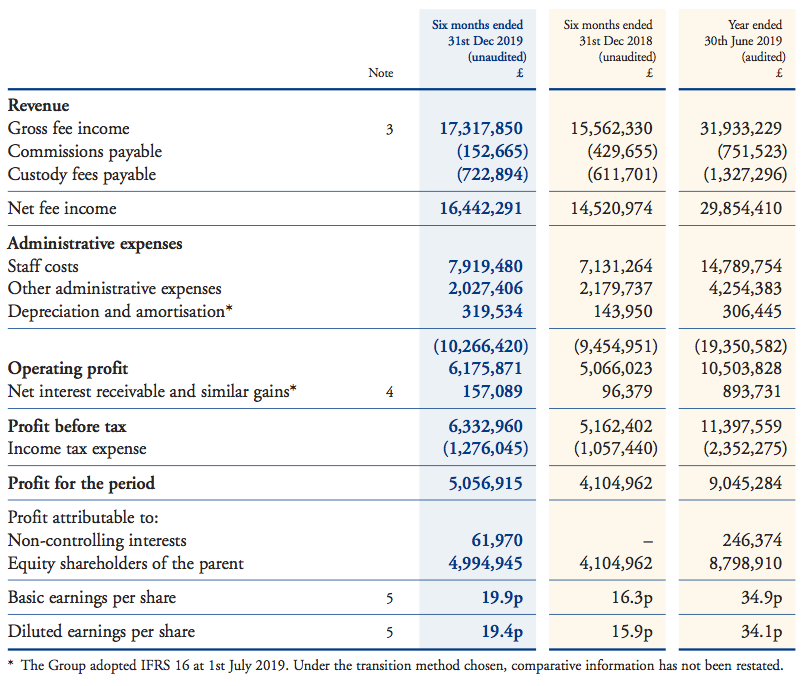
- Revenue gained 11% to £17.3m while operating profit surged 22% to £6.2m.
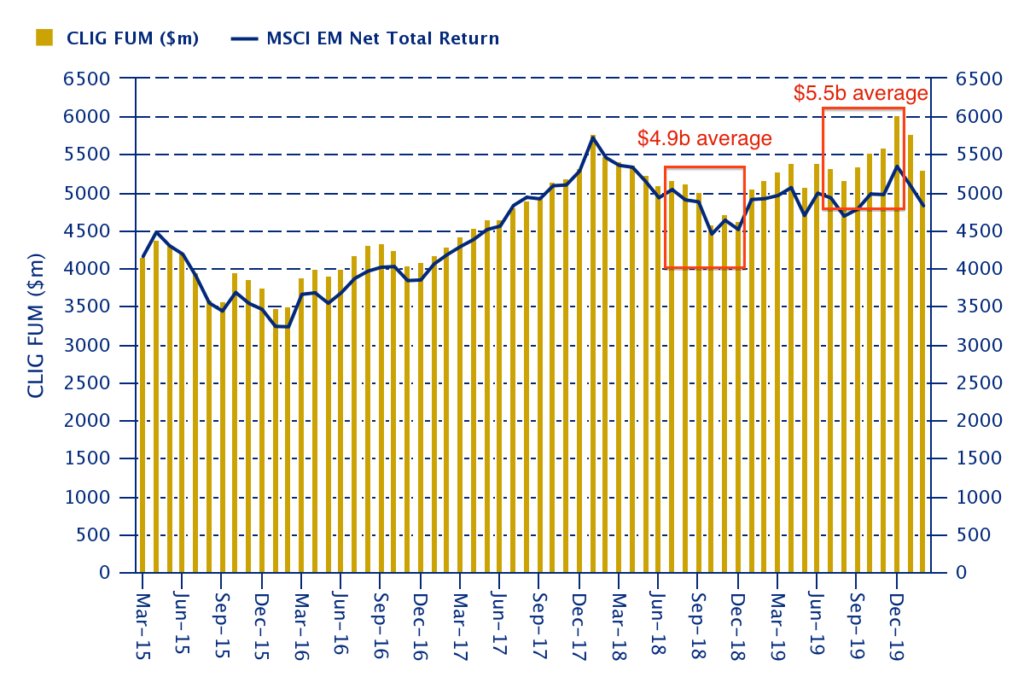
- FuM rallied 12% during the six months to finish the half-year at $6.0b — a level surpassed only once back in March 2011.
- New client money represented $182m, or 29%, of the total $625m FuM advance.
- FuM on a monthly average basis was $5.5b — up 13% on the $4.9b average from the comparable period:
- Although progress appeared impressive, the overall performance broadly matched that of H1 2018:
| H1 2018 | H2 2018 | H1 2019 | H2 2019 | H1 2020 | |
| Funds under management ($m) | 5,329 | 5,107 | 4,623 | 5,389 | 6,014 |
| Revenue (£k) | 17,076 | 16,854 | 15,562 | 16,371 | 17,318 |
| Operating profit (£k) | 6,487 | 6,041 | 5,066 | 5,438 | 6,176 |
| Finance income (£k) | 82 | 183 | 96 | 798 | 157 |
| Other items (£k) | - | - | - | - | - |
| Pre-tax profit (£k) | 6,569 | 6,223 | 5,162 | 6,236 | 6,333 |
| Earnings per share (p) | 20.2 | 19.3 | 16.3 | 18.6 | 19.9 |
| Dividend per share (p) | 9.0 | 18.0 | 9.0 | 18.0 | 10.0 |
| Special dividend per share (p) | - | - | 13.5 | - | - |
- CLIG also benefited from a stronger USD.
- CLIG’s revenue is collected almost entirely in USD but approximately 40% of costs are expensed in GBP.
- GBP traded at 1.30 USD during the comparable H1 2019, and at 1.26 USD during this H1 2020. (Note: GBP now buys 1.18 USD — which should be even more beneficial for CLIG).
- The results highlight was an 11%, or 1p per share, lift to the interim dividend to 10p per share. (Note: Unlike many other dividends declared during recent weeks, CLIG’s payout has since been paid).
- Somewhat ominously, CLIG said (my bold):
“The results summarised in this statement paint a favourable picture of CLIG’s performance over the six-month period and, as suggested elsewhere in this report, there are solid grounds for optimism as we enter a new decade. It is against this background that your Board is pleased to announce a 1p per share increase in the interim dividend… which rewards our shareholders while providing sufficient reserves either to weather unforeseen setbacks or take advantage of opportunities that may arise to further expand the business.”
- The accounts show CLIG has left itself with “sufficient reserves… to weather unforeseen setbacks” of £15m (see Financials below).
Funds under management
- FuM ended the half at their highest-ever level in GBP terms:
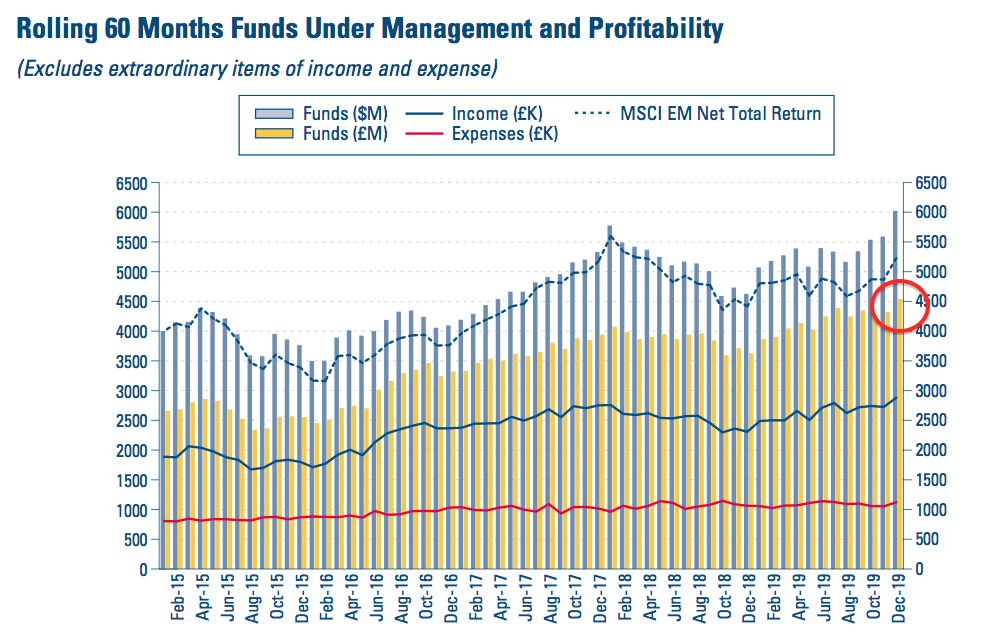
- In USD, CLIG’s FuM record was set during early 2011 when total client money surpassed $6b.
- CLIG’s FuM can be divided into two main categories:
- Emerging Markets (EM), and;
- non-EM, which covers ‘frontier’ markets, developed markets and other themes.
- Both categories apply CLIG’s long-standing investment approach of buying investment trusts at a discount.
- Non-EM FuM has become a much larger part of overall FuM during recent years:
| FuM | 2016 | 2017 | 2018 | 2019 | H1 2020 |
| EM ($m) | 3,659 | 4,202 | 4,207 | 4,221 | 4,429 |
| Non-EM ($m) | 346 | 461 | 900 | 1,168 | 1,109 |
| Total ($m) | 4,005 | 4,663 | 5,107 | 5,389 | 6,014 |
| EM (%) | 91.4 | 90.1 | 82.4 | 78.4 | 73.6 |
| Non-EM (%) | 8.6 | 9.9 | 17.6 | 21.7 | 26.4 |
- Non-EM funds have consistently attracted new client money, unlike the EM funds, which have suffered net withdrawals since 2017:
| Client flows | 2016 | 2017 | 2018 | 2019 | H1 2020 |
| EM ($m) | 150 | (295) | (215) | (184) | (118) |
| Non-EM ($m) | (12) | 23 | 400 | 280 | 300 |
| Total ($m) | 138 | (272) | 185 | 96 | 182 |
- During the last twelve months, client money generally trickled out of EM funds and trickled in to non-EM funds:
| Client flows | Q3 2019 | Q4 2019 | Q1 2020 | Q2 2020 |
| EM ($m) | 45 | (72) | (12) | (106) |
| Non-EM ($m) | 108 | 57 | 152 | 148 |
| Total ($m) | 153 | (15) | 140 | 42 |
- A continuing irony of the growing exposure to non-EM FuM is that EM keeps delivering its fair share of investment returns:
| Market movements | Q3 2019 | Q4 2019 | Q1 2020 | Q2 2020 | Total |
| EM ($m) | 403 | 113 | (151) | 477 | 842 |
| Non-EM ($m) | 89 | 23 | (40) | 157 | 229 |
| Total ($m) | 492 | 136 | (191) | 634 | 1,071 |
- CLIG said the recent EM strategy gains were due to “discount narrowing and good NAV performance of the underlying holdings”.
- CLIG said the recent non-EM strategy gains were due to “positive discount effects, good country allocation, and strong NAV performance”.
- I calculate total FuM enjoyed an 8.2% gain excluding new client money during the half. The gain for 2019 was 3.6% and the gain for 2018 was 5.6%.
- The chart below from CLIG’s 2019 annual report (point 5) shows market movements (brown boxes) outweighing the movements from client contributions and withdrawals (yellow boxes):
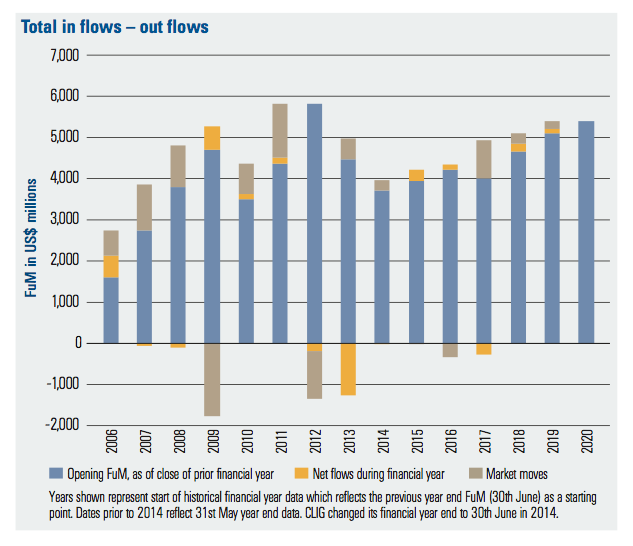
- Additional FuM through market movements and new client money are typically (and frustratingly) small compared to the overall level of FuM.
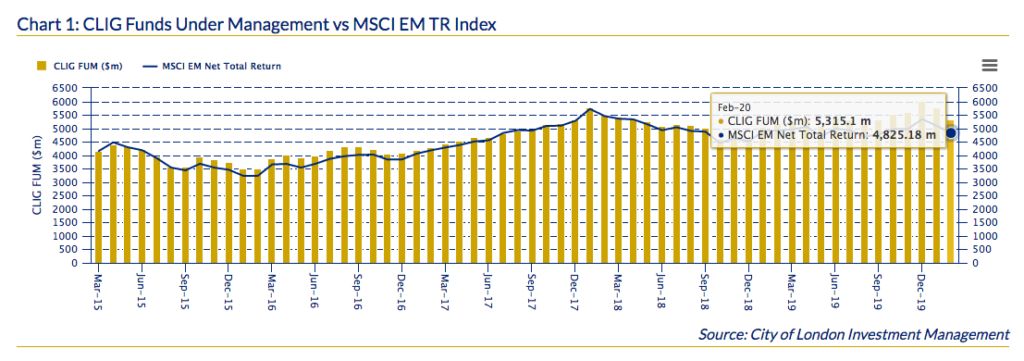
- The chart below underlines the lacklustre relative performance:

- Over the last five years, CLIG’s FuM (yellow bars) have barely beaten the group’s MSCI EM benchmark (blue line):
- That said, new client money during the last twelve months was $320m — the highest twelve-month amount since CLIG started disclosing the numbers two years ago.
- New client money of $320m represents a useful 6.9% of total the £4.6b FuM seen twelve months ago.
- I would be happy if CLIG could attract an extra 6.9% of new FuM from clients every year.
Fees
- CLIG said (my bold):
“As noted previously our revenue margins on the newer developed strategies are somewhat lower than traditional EM but it is pleasing to note that the overall blended margin fell only slightly in the period to 75 basis points, a level which continues to offer healthy returns.”
- 75 basis points (i.e. 0.75%) may offer “healthy returns” but the 85 basis points charged to clients during 2015 were even healthier.
- October’s Q1 update had said fee rates were 76 basis points.
- The fee-rate collapse since 2015 has been due to CLIG charging lower fees on its non-EM funds.
- CLIG has never disclosed the exact fee rates charged on its EM and non-EM funds.
- However, my basic algebra suggests EM fees are levied at 90 basis points and non-EM fees are levied at 30 basis points to arrive somewhere close to the overall fee rates CLIG has declared:
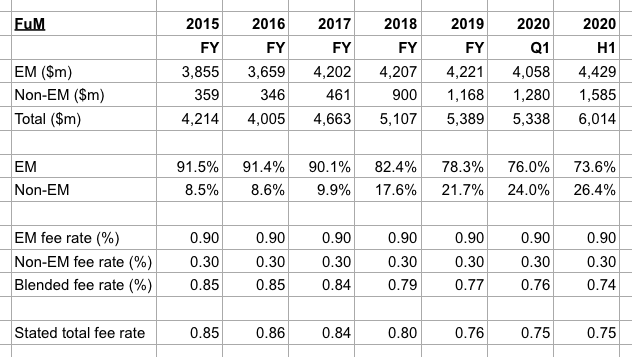
- If my fee-rate algebra is accurate, the advance of non-EM FuM is not surprising given the associated fees are two-thirds lower.
- I still wonder if non-EM FuM has been bolstered partly by EM clients switching to non-EM. The total number of clients has increased from 161 to only 169 during the last five years.
- CLIG said its main investing strategies had outperformed of late:
“The EM strategy has outperformed against its relative indices for the most recent two calendar years and remains either first or second quartile against peers for 1, 5, 10, and 15 years, and since inception. Both the Developed and Opportunistic Value strategies are in the first quartile against peers for 1, 3, and 5 years and since inception, which has been achieved while investing the inflows from new client mandates.”
- CLIG’s presentation charts — with representative funds denoted by the red circles — underlined the progress:
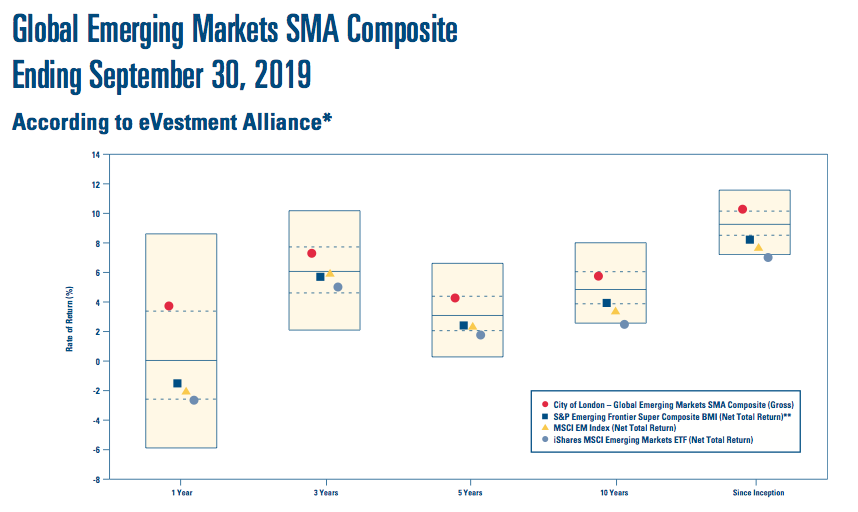
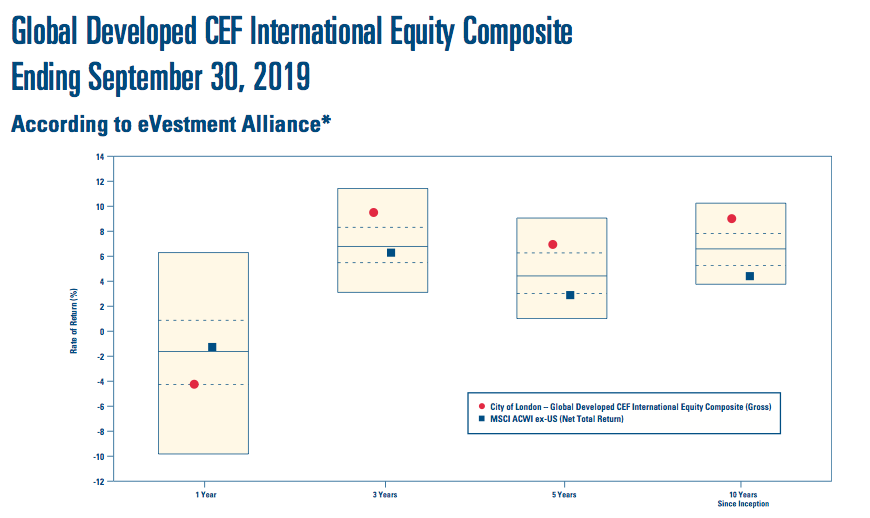
- Given the appealing relative performance of the EM funds, I do not understand why that division has experienced net client-money withdrawals since July 2016.
- CLIG’s commentary adds to the confusion (my bold):
“Building a successful asset management business requires many and varied skills and attributes, which can take many years to nurture but arguably, the three most important are performance, performance and performance on behalf of our clients.”
- If performance is so critical to clients, why — again — has the EM division failed to attract new money?
- CLIG’s commentary sadly did not suggest the (re-appointed) business-development director was looking for new EM clients (my bold):
“At the same time, I warmly welcome Carlos Yuste to the Board as the director responsible for business development. Carlos has spent an aggregate 17 years in the “CLIG family” and is highly respected for his knowledge of the US institutional investor universe and, given our ambitions to further expand our penetration of this client base with our newer products, we are fortunate to have his experience to guide us.”
Enjoy my blog posts through an occasional email newsletter. Click here for details.
Dividend-cover template and FuM/exchange-rate table
- An updated dividend-cover template accompanied these half-year results:
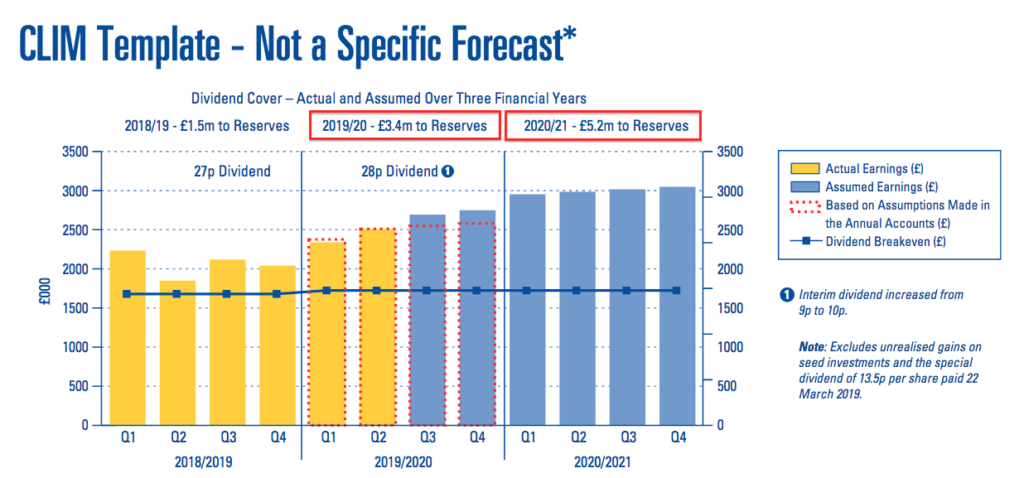
- Market movements and fluctuating FuM have at times made the template look very optimistic.
- Significant market falls since these results were published emphasise just how stale the template can become.
- The template does nonetheless reveal what CLIG once believed could happen during the coming twelve months.
- The template expects earnings of £3.4m to be retained during the current year.
- Back in July the expectation was £3.3m (shown by the red dotted lines).
- £3.4m is equivalent to approximately 13p per share which, when added to the lifted 28p per share full-year dividend, indicated current-year earnings might have been 41p per share.
- The template has disclosed for the first time its projection for the year to June 2021.
- The 2021 retained-earnings projection of £5.2m alongside a 28p per share dividend indicates possible earnings of 48p per share.
- With FuM presumably reduced significantly since these results were published, I estimate earnings for 2021 may actually be running closer to 26p per share (see Valuation below).
- The “key assumptions” used to construct the template expect the non-EM funds to attract a further $250m during 2021. That assumption was surpassed during 2018, 2019 and during this H1 2020:
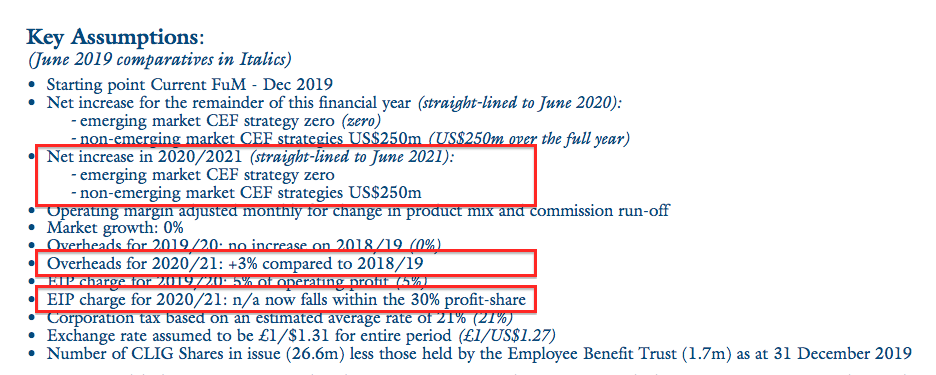
- The key assumptions still expect EM funds to attract no extra money. That assumption has been too optimistic during the last three-and-a-half years.
- The assumptions predict overheads will advance 3% during 2021.
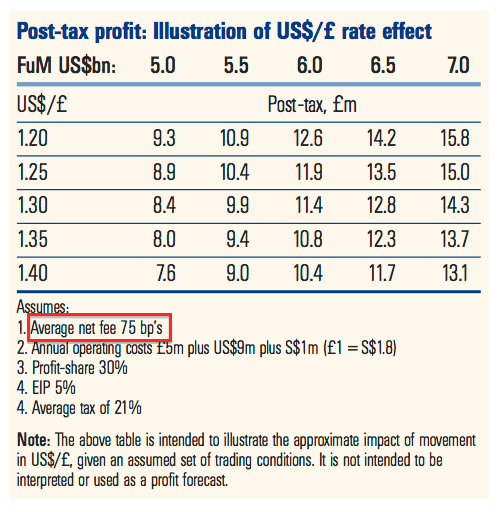
- CLIG’s latest FuM/exchange-rate table confirmed the 75 basis-point fee and no other changes from the full-year stage:
Management
- These results lauded the achievements of CLIG founder and former chief executive Barry Olliff:
“31st December 2019 was a watershed moment in the history of your Company as our founder, Barry Olliff, retired from his executive role on his 75th birthday. In a career that spanned more than 50 years and witnessed massive changes in the structure and operation of equity markets globally, Barry has been a pioneer in the specialist area of closed-end funds (CEFs). Having identified the significant value attractions of CEFs in the Emerging Markets (EM) some 30 years ago, CLIG developed a leading position as an asset manager in the sector…”
- Mr Olliff will serve as a non-executive until October and will then “remain an adviser to the Group” until December 2021.
- CLIG said (my bold):
“Finally, I would like to assure all stakeholders that the “Olliff DNA”, in terms of an adherence to prudence, transparency and our fiduciary responsibilities will continue to be writ large in everything we do.”
- The accompanying H1 2020 presentation was not as transparent as previous powerpoints.
- The latest presentation ran to 31 pages, versus 50 for the AGM presentation, 52 for the full-year 2019 results presentation and 54 for the H1 2019 presentation.
- Key slides omitted this time included the summary balance-sheet and cash flow statements, detailed fund performance statistics and client tenure information.
- CLIG said:
“As previously stated, shareholders are reminded of Barry’s intention to sell up to 500,000 shares at each of 450p, 475p and 500p subject to relevant restrictions. As per listing rules, any share sales will be announced to the market after execution.”
- Mr Olliff sold 169,387 CLIG shares at 452p last month. He retains almost 1.9 million shares (7% of the share count), which are likely to be untouched for some time given where the share price is now and his commitment to sell only at prices of 450p or more.
- With founder/ex-chief exec Mr Olliff no longer in charge, I have become reluctant to add to my CLIG investment. I simply prefer owner-orientated executives — rather than professional ‘salarymen’ — to lead my shareholdings.
Financials
- CLIG’s balance sheet remains cash-rich and debt-free.
- Half-year cash was £12.5m, equivalent to 47p per share.
- Other financial assets — which the 2019 annual report disclosed (point 15) to be “listed investments” — stood at £7.8m, or 29p per share.
- I believe these listed investments are held by CLIG’s fledgling REIT fund, which is consolidates into the full accounts because the fund is majority owned.
- The portion of the REIT fund owned by external clients is represented by non-controlling interests of £3.2m, or 12p per share.
- This company document indicates regulatory capital was £1.9m, or 7p per share, at September 2019.
- Net ‘surplus’ cash and investments therefore come to 47p (cash) plus 29p (other financial assets) less 12p (non-controlling interests) less 7p (regulatory capital) = 58p per share.
- An ultra-cautious view would be to subtract the 10p per share H1 dividend to give 48p per share.
- Major cash flow movements during this H1 were £4.5m spent on last year’s final dividend and £2.0m spent on buying shares for the Employee Benefit Trust (EBT).
- The EBT acquired 483k shares at a 423p average .
- The EBT expense was offset by raising £324k after selling 336k shares to staff to satisfy their exercised options.
- Between 2010 and 2019, the EBT has spent £6.7m buying shares and received £3.9m from selling shares.
- Arguably the effective cash cost of CLIG’s options (and Employee Incentive Plan (EIP)) over time has been (£6.7m less £3.9m) / 10 years = £280k a year.
- CLIG confirmed the (awful) EIP has only another six months to run:
“[N]o fewer than 75% of the Group’s current workforce has participated in the [EIP] scheme for an aggregate of more than one million share awards or approximately 4% of the Company’s issued equity and we are confident that this trend will continue beyond June 2020, when the additional 5% allocation of operating profits to fund participation will expire.”
- The total accounting cost of the EIP since its inception during 2017 has been £1.8m.
- The 2019 annual report (point 19) said the EIP had “been designed to use existing shares in issue”. I am hopeful the majority of EBT shares required for the EIP have now been purchased.

- CLIG’s income statement and profit margin was distorted a little by the implementation of IFRS 16.
- IFRS 16 alters the way operating leases are charged against earnings. Such costs are now accounted for by a mix of depreciation and finance costs.
- CLIG paid £52k as “interest on lease liabilities” during this H1, which, if included as an operating expense gives an operating margin of 35% during this H1 versus 33% for the comparable six months.
- One notable cost reduction was “commissions payable”, which dropped £277k from H1 last year to now represent less than 1% of revenue. Such commissions have been in ‘run off’ since 2010 and ought to cease after October.
- Staff costs advanced 11% in line with revenue during this H1.
- Only time will tell how much CLIG’s staff will be paid following the recent market crash and likely reduction to revenue.
- Staff enjoy a collective 30% ‘profit share’. If the recent market crash has indeed hurt revenue, total employee pay will be lower.
- Mind you, basic wages could be increased to compensate for the lower profit share.
- CLIG’s books remain free of pension obligations.
Valuation
- My valuation sums employ CLIG’s latest FuM/exchange-rate table (see Dividend-cover template and FuM/exchange-rate table above).
- CLIG reported FuM of $5.3b for the end of February 2020:
- FuM at $5.3b and GBP:USD at a recent 1.18 may lead to earnings of approximately £10.6m or 39.8p per share.
- However, FuM is likely to have dropped significantly following the recent market crash.
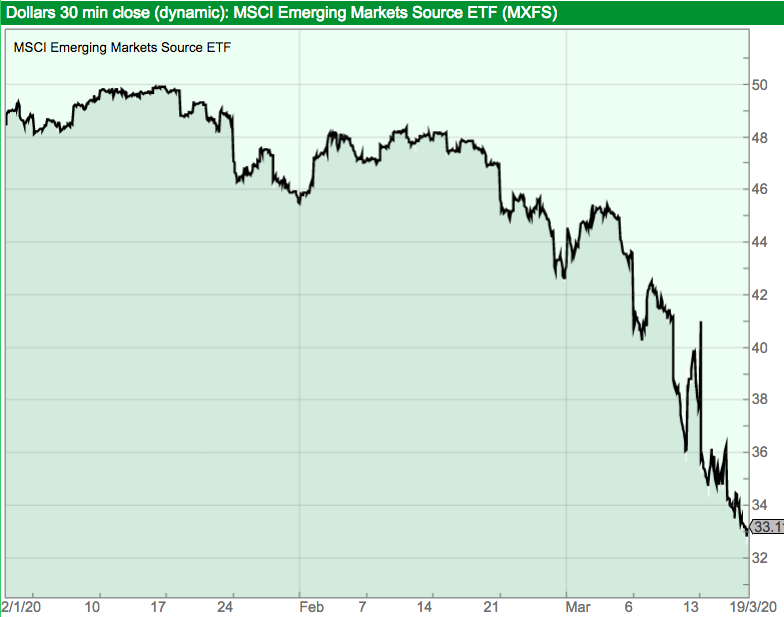
- According to SharePad, the MSCI Emerging Markets Source ETF — which I think is similar to the MSCI Emerging Market benchmark regularly referred to by CLIG — has dropped 31% since the start of 2020 and has fallen 24% so far during March:
- CLIG’s FuM may now be approximately $4.1b if FuM have mirrored the fall suffered by that MSCI ETF.
- FuM at $4.1b and GBP:USD at 1.18 may lead to earnings of approximately £6.6m or 24.9p per share — almost 40% below the earlier 39.8p per share projection.
- Adjust the 300p share price for the 58p per share of net cash and investments, and the possible P/E could be 242p / 24.9p = 9.7.
- Ignoring the cash and investments gives a potential P/E of 12.0.
- Note that the FuM/exchange-rate table applies an EIP charge of 5%, and the EIP ought to cease after June.
- Applying an EIP charge of 0% instead of 5% revises my earnings estimate to £7.1m/26.8p per share, the cash-adjusted P/E to 9.0 and the standard P/E to 11.2.
- How does the present valuation compares to the market crash of 2008/9?
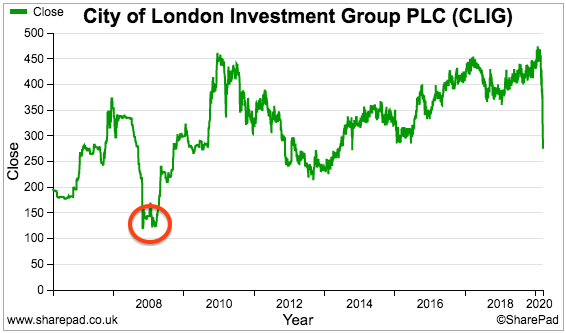
- CLIG’s share price dropped to a low of 123p during March 2009:
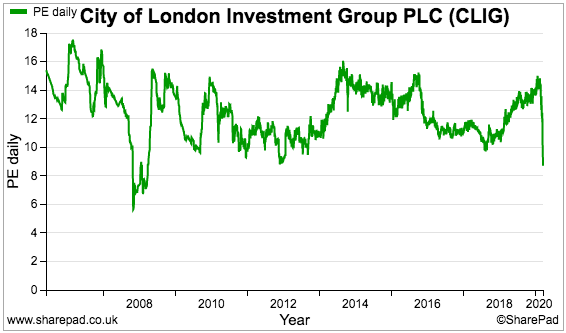
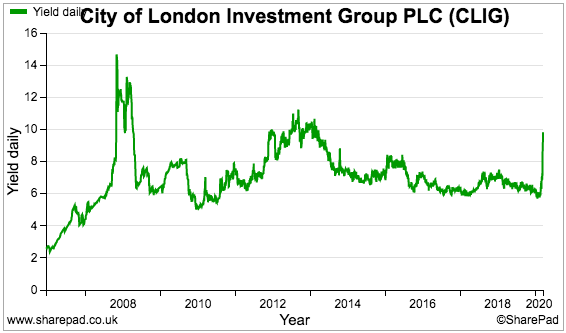
- SharePad shows the following P/E and yield charts:
- Note that both charts are based on trailing figures. Investors never actually received the 15% peak yield because the 2008 payout was cut by 23% for 2009.
- What were the forecast figures at the time? We can make a guess.
- First-half results issued during January 2009 had revealed average FuM of £1.88b, revenue of £10.4m, staff costs of £3.4m, other costs of £3.7m and an operating profit of £3.3m.
- CLIG reported FuM of £1.54b just before the March 2009 share-price low.
- Assuming staff costs dropped in line with revenue and other costs stayed the same, I calculate FuM of £1.54b could have translated into annualised revenue of £17.1m, annualised operating profit of £4.5m and annualised earnings (with tax at a then 33%) of £3.0m.
- The table below compares the 2009 and present market cap and enterprise value (market cap less net cash and investments) to FuM and my estimated earnings:
| March 2009 | March 2020 | |
| Share price (p) | 123 | 300 |
| Market cap (£m) | 29.4 | 74.6 |
| Cash and investments (£m) | 5.1 | 15.3 |
| Enterprise value (£m) | 24.3 | 59.3 |
| Funds under management (£b) | 1.54 | 3.47 |
| Estimated earnings (£m) | 3.0 | 7.1 |
| Market cap/FuM (%) | 1.91 | 2.15 |
| Market cap/Estimated earnings (x) | 9.8 | 10.5 |
| EV/FuM (%) | 1.58 | 1.71 |
| EV/Estimated earnings (x) | 8.1 | 8.3 |
- The P/E similarity does not necessarily mean the 300p shares are cheap. These shares have traded at c10x cash-adjusted earnings for years.
- Mind you, the dividend could be signalling obvious value.
- CLIG likes to distribute the majority of its earnings as dividends. Dividend cover during the last ten years has never topped 1.5 times, and was even 0.9x during 2014.
- My 26.8p per share earnings guess does not cover the trailing 28p per share dividend.
- However, history suggests CLIG will maintain the trailing 28p per share payout, which would support a substantial 9.3% income at 300p.
- Aside from any market recovery, superior share-price progress will only be witnessed if/when CLIG attracts significant levels of new client FuM.
- Until then, I suspect the valuation will remain around 10x earnings and the share price will simply bob up and down to match the levels of FuM.
- Nonetheless, the dividend ought to provide reasonable returns even if FuM were to stagnate for some time.
- Also bear in mind the balance sheet has regularly carried a sizeable cash position, which in reality may be needed to reassure clients and might therefore not be ‘surplus to requirements’ for valuation purposes.
- Finally, the FuM/exchange-rate table above implies CLIG will operate at a loss should FuM decline below $2.1b with GBP buying 1.18 USD.
Maynard Paton
PS: You can receive my blog posts through an occasional email newsletter. Click here for details.
Disclosure: Maynard owns shares in City of London Investments.

Hello,
A very insightful reading. I hope to learn from this analysis and apply them to my investments.
Thank you.
Kind regards,
Jay
Hello Jay,
Thanks for the comment and good luck with your investments!
Maynard
Hi Maynard, I hope you are well.
CLIG announced a trading update this week showing FUM down from around $6bn to $4.4bn. Helpfully they outlined that net income accrues at a similar level to normal – 75 basis points.
Share price is down about 1/3 since pre-Covid levels and FUM down “only” 27%. I see this as a buying opportunity personally and am watching the price quite closely over this week.
Will be interested to read your update when you have a chance to post.
Regards
James
Hi James
Thanks for the message. Have posted some bried thoughts in the comment below. Assuming the dividend is held, the 320p shares now yield almost 9%. Not bad. But as I noted in the blog post above:
* Aside from any market recovery, superior share-price progress will only be witnessed if/when CLIG attracts significant levels of new client FuM.
* Until then, I suspect the valuation will remain around 10x earnings and the share price will simply bob up and down to match the levels of FuM.
Maynard
City of London Investment (CLIG)
Q3 Funds under Management
This statement was a little better than I had expected. My blog post above guessed at funds under management (FuM) of $4.1bn — FuM at the end of March was actually $4.4bn.
Here is the full text:
———————————————————————————————————-
City of London (LSE: CLIG), a leading specialist asset management group offering a range of institutional products investing in closed-end funds, announces that as at 31 March 2020, FuM were US$4.4 billion (£3.6 billion). This compares with US$6 billion (£4.5 billion) as at 31 December 2019. A breakdown by strategy follows:
All strategies underperformed over the period due primarily to closed-end fund discount widening and, to a lesser extent, NAV underperformance. This was particularly acute during March in the immediate aftermath of the economic dislocation caused by COVID-19, which prompted selling pressure across all asset classes.
During the period under review, the Opportunistic Value and Developed strategies recorded combined net inflows of $25 million. The Frontier strategy saw net inflows of $8 million while the EM strategies saw net outflows of $68 million.
With regard to business development, the Group continues to maintain an active pipeline across all of its major CEF offerings with an increased interest in the diversification CEF strategies.
Operations
Due to the COVID-19 pandemic, our business continuity plan was enabled with all staff working remotely via audio and secure video communication and full network connectivity to all critical systems with security protocols in place to protect client data.
The Group’s income remains accrued at a weighted average rate of approximately 75 basis points of FuM, net of third party commissions and has not changed as a consequence of the COVID-19 outbreak.
Dividend
In recognition of the challenges posed by the COVID-19 pandemic, the Board continues to monitor closely the Group’s financial position. Shareholders will be aware that your Board has always ensured the Company maintain a strong balance sheet with significant cash reserves and zero debt as we believe this policy provides a vital financial cushion to weather unforeseen events and market volatility such as that presented by COVID-19. Since it is impossible to know the duration of the current dislocation to economies and stock markets, it would be imprudent at this stage to make any statement regarding the final dividend in respect of the year to 30 June 2020. However, your Board is cognisant of the importance of dividends to our shareholders and will review the position after the year-end.
———————————————————————————————————-
Impressively, non-EM funds managed to attract a net $33m of new client money during the three months. These funds have on aggregate attracted net new money every quarter for at least two years now. No surprise money continues to trickle out of CLIG’s EM funds, as it has done over the last three years.
Exclude the new money, and I calculate CLIG’s funds fell 26% during the quarter — perhaps a tad more than the blended performance of the strategy indices.
I am pleased fee rates remain at 75 basis points. The remarks about the dividend seem sensible in the circumstances — best not to commit to anything until nearer the time. A lot could happen between now and July’s full-year update.
My valuation sums based on the latest FuM/exchange-rate table in the blog post above point to earnings of £7.1m (or 26.7p per share) with FuM of $4.4bn, an EIP of 5% and GBP:USD at 1.24.
With an EIP of 0%, earnings come to £7.6m (or 28.7p per share). Assuming FuM is sustained from here, then I reckon the 28p per share dividend could be maintained as CLIG (once again) dips a little into its cash position to hold the payout.
Maynard
City of London Investment (CLIG)
Funds under management update
FUM during April rebounded a useful $425m, or 10%, to $4,825m:
Aside from March 2020, FUM is at its lowest since December 2018.
Using the exchange-rate/FUM table shown in the blog post above, with the EIP at zero, I arrive at earnings of £9.06m or 34.1p per share with client money at $4,825m and £1 buying $1.24. An EIP of 5% gives earnings of 31.7p per share. Both earnings estimates cover the 28p per share trailing dividend.
Maynard
City of London Investment (CLIG)
Funds under management update
FUM during May rebounded a further $175m, or 4%, to $5,000m:
Aside from March/April 2020, FUM remains at its lowest since December 2018.
Using the exchange-rate/FUM table shown in the blog post above, with the EIP at zero, I arrive at earnings of £9.44m or 35.5p per share with client money at $5,000m and £1 buying $1.26. An EIP of 5% gives earnings of 33.0p per share. Both earnings estimates cover the 28p per share trailing dividend.
Maynard
City of London Investment (CLIG)
Proposed All Share Merger of CLIG with Karpus Management announced 09 June 2020
The full merger prospectus has been published. Some points of interest below. I will look at valuation in a further comment.
1) Merger background and strategy
Acquisitions are often fraught with risk for shareholders, but KM has been known to CLIG for some time and the merger has been under discussion for two years:
The merger therefore does not seem to be a knee-jerk decision. Both firms invest in a similar fashion, too. Note that both firms are passing executive control to the “next generation of management” as well.
This ‘executive transfer’ poses the greatest downside to CLIG and the merger — the track records of CLIG and KM were built by founders who are retiring. How differently will the new leadership act?
The strategic rationale for the deal appears to centre on improved stability of funds under management (FuM) and therefore revenue and profit:
2) Organic diversification is a slow process
CLIG says “organic diversification is a slow process”:
Well, yes, but non-Emerging Market funds have grown from $359m to $1,585m between 2015 and H1 2020. So ‘organic diversification’ has grown. The main issue holding CLIG back has been Emerging Market funds climbing from $3.6b to only $4.4b during the same 5.5 years — or c4% a year.
CLIG’s EM funds have a much longer track record — supposedly with outperformance — yet the associated FuM growth has been pedestrian and (most likely) driven more by wider market movements.
More comments on “slower growth” here:
Oh dear — management has also used the word “transformative”, which is often a warning sign for acquisitions.
3) Shareholdings post merger
Mr Karpus of KM will become CLIG’s largest shareholder after the merger:
Note Mr Karpus will have to retain $10m of CLIG shares over five years. At the 325p merger price, Mr Karpus will have a £51m CLIG shareholding, so he is free to dispose of more than 80% of his holding after the one-year lock-in.
CLIG founder Barry Olliff will see his stake reduced to less than 4%.
4) Relationship agreement
CLIG’s relationship agreement with Mr Karpus:
Mr Karpus is retiring and the CLIG merger is the first step to him selling out. I would like to think he will not do anything untoward as CLIG’s major shareholder in order to maximise his retirement pot.
5) KM funds under management
Some useful information here.
KM’s FuM is up 83% over 10 years:
In comparison, CLIG’s FuM is up 23% (from $4.4b to $5.4b) during the same time. Perhaps KM does not have the “organic diversification is a slow process” issue that CLIG does.
Mind you, KM’s net inflows into FuM is not great. A net $97m has trickled out of FuM between 2014 and 2019:
Market movements have therefore bolstered KM’s FuM growth history.
Interesting that KM uses third parties to collect FuM:
CLIG dropped its main third-party referrer 10 years ago.
KM’s clients seem to be mostly high net worth individuals, in contrast to CLIG’s institutional customer base:
The numbers suggest 113 (2273*5%) clients have FuM of $1.4b ($3.2b*44%) — or c$12m each. The other 2,160 clients have KM portfolios worth less than $5m:
Client loyalty seems fine — KM has looked after 75% of FuM for more than five years.
Ah ha — the average client has a $3.9m portfolio:
This asset-class analysis does not seem to add up to 100%:
59%+20%+5%+3%+1%+1% = 89%.
Fees are 80 basis points (CLIG’s are 75 basis points):
KM claims to have “fairly stable” rates — CLIG’s overall rate has been chipped lower for some years now.
Similar to CLIG, KM looks for closed-end funds trading at a discount and is not afraid of activism:
KM also dabbles in “auction rate preferred securities”:
I am surprised and a tad alarmed that portfolio turnover is 40%-50% a year for “risk averse” clients (see point 6 below).
6) KM clients
KM clients are “risk averse” and are served by “enhanced indexing”:
Goes without saying that the “risk averse” clients still desire “top quartile” performance:
7) KM risk competitors
A snippet on how KM competes:
8) KM revenue and profit
KM has reported an operating loss for the last three years:
The loss is due to the aforementioned Mr Karpus earning approximately $15m a year:
Mr Karpus is stepping down to become a $100k a year consultant.
Total staff costs were $23m for 2019:
Staff costs excluding Mr Karpus’ $15m leaves a profit of $15m for 2019. Revenue of $25m that year implies an operating margin of c60% excluding Mr Karpus.
I am not sure this 60% margin will be sustainable. CLIG for comparison has c30% margins. No doubt all sorts of costs will begin to creep into KM’s cost base as Mr Karpus leaves and standard managers take charge.
9) KM employee numbers
One good reason for the impressive 60% margin is fewer, lower-paid staff members:
KM’s 36 employees looked after FuM of $94m each on average during 2019 versus $74m for CLIG.
KM’s revenue per employee was £575k (at £1:$1.24) for 2019 versus £437k for CLIG.
KM’s pay per employee (excluding Mr Karpus) was c£167k (at £1:$1.24) for 2019 versus £203k for CLIG.
10) CLIG profit template
No surprise CLIG has withdrawn its dividend template:
This is the latest template in question:
I wonder if Covid-19 will be used to as an excuse to drop other informative tables from the results presentations. I also wonder whether the dividend template will be reinstated. Such information was always helpful to shareholders, but that disclosure reflected how former boss Barry Olliff managed the business.
11) CLIG CEO based in the States
At least CLIG’s current boss lives in the States and ought to be on hand to manage KM if need be:
12) Chairman emeritus
Mr Karpus may well become a boardroom fixture:
13) KM pension scheme
KM has sensibly closed its defined benefit pension scheme:
14) General meeting questions
An inbox is available for shareholder questions:
Maynard
City of London Investment (CLIG)
Valuation thoughts on Proposed All Share Merger of CLIG with Karpus Management announced 09 June 2020
A few basic sums on the CLIG/KM deal.
Merger involves issuing 24.1 million extra shares to KM, taking the enlarged share count to 50.7 million (including shares held in the EBT).
Prospectus said KM had FuM of $3.4b at May 2020 and at June 2019, when operating profit that year was $15.3m adjusted for the pay to the (now-retiring) founder. Apply 21% tax (standard US rate and rate used by CLIG within its presentation) to $15.3m, and KM earnings are $12.1m or £9.7m with £1:$1.24.
CLIG earnings could be running at £9.4m as per this earlier comment assuming the additional cost of the Employee Incentive Plan (EIP) reduces to zero later this year as planned.
KM and CLIG earnings therefore come to £19.2m or 37.8p per share using the enlarged share count. Prospectus mentions a 1.2x dividend cover target, so payouts could be 31.5p per share:
The 37.8p EPS projection is not that much higher than the 35.5p cited in that earlier comment. Furthermore, the 31.5p DPS projection is not much higher than CLIG’s trailing 28p per share payout.
Something the prospectus does not mention (as far as I can tell) is the staff bonus scheme. CLIG employees currently share 30% of pre-bonus profit as a bonus.
Questions: Will the 30% profit share extend to KM? Or will KM continue to operate as a standalone business and existing CLIG employees take their 30% profit share only from the CLIG operation? Not sure either way.
If the 30% profit share is extended to KM, then KM’s earnings will be c30% lower. KM’s profit-share payments to date have been minor:
A broker note from Hardman & Co Research suggests KM employees will receive EIP shares:
“Within Karpus, other than the retiral of George Karpus, the existing management team will remain in place. City of London is keen to keep the existing Karpus staff in place. It will take measures to do so, including giving staff the opportunity to participate in the company’s Equity Investment Programme. In this, the company matches employee share purchases and it has had a strong take-up in the existing company.”
From later this year, EIP shares will be funded from the 30% profit share — which appears reserved for existing CLIG employees only. I doubt they will be happy that KM employees will enjoy part of what was a CLIG-only bonus pool.
All told, I suspect the current CLIG profit-sharing arrangements will be modified to accommodate KM staff. I am therefore sure my 37.8p EPS projection above — based on KM’s existing 60% operating margin — will be cut lower as and when the new arrangements emerge.
By the way, Hardman is predicting FuM of $10.2b for 2022 — the first full year of the enlarged CLIG/KM group:
$10.2b seems optimistic to me. Combined CLIG/KM FuM was $8.4b at May 2020 and has to grow at 10% a year for two years to reach Hardman’s $10.2b guess. For perspective, combined CLIG/KM FuM has advanced at a 4% CAGR between 2010 and 2019.
A final interesting development — CLIG founder Barry Olliff has spent £61k buying CLIG shares at 370p.
February’s half-year results said:
“As previously stated, shareholders are reminded of Barry’s intention to sell up to 500,000 shares at each of 450p, 475p and 500p subject to relevant restrictions. As per listing rules, any share sales will be announced to the market after execution.”
Odd that Mr Olliff is buying shares when he is a committed seller. I can only presume he thinks the price now has a better chance to reach the 450p minimum for him to sell. Mind you Mr Olliff increased his holding by less than 1%, so the latest purchase was not exactly a conviction investment.
Maynard
Thank you very much for your detailed analysis. It has saved me time and makes a lot of sense. I have my concerns about blending two very different cultures with both founders retiring, so, as an existing shareholder I will be watching closely. I was also intrigued by Barry Oliff’s small purchase.
Hello James, glad you found my notes useful.
Maynard
City of London Investment (CLIG)
Pre-Close Q4 2020 Trading Update
The statement revealed a few encouraging FuM developments. The dividend ought to be at least maintained as well. Here is the full text.
——————————————————————————————————————————
City of London (LSE: CLIG), a leading specialist asset management group focused on closed‐end funds and REITs across emerging and developed markets, provides a pre‐close trading update for its financial year ended 30 June 2020. The numbers that follow are unaudited.
Funds under management were US$5.5 billion (£4.4 billion) at 30 June 2019 (2019: US$5.4 billion or £4.2 billion), representing a 2% increase in US$ terms for the year. A breakdown by strategy follows:
The Emerging Market (EM) and Developed Strategies (DM) outperformed over the year, the Opportunistic Value (OV) and Frontier strategies underperformed. Both the EM and DM strategies benefitted from good country allocation. The Frontier strategy suffered from weak NAV performance, particularly impactful among Argentine holdings while the OV strategy suffered from negative allocation effects. In addition, as discounts widened significantly across CEF sectors, most notably in Q1 2020, all the strategies suffered to some extent from this factor over the 12 month period.
During the year under review, the OV and DM strategies recorded combined net inflows of $597 million. The Frontier strategy saw net inflows of $16 million while the EM strategy saw net outflows of $275 million.
Operations
Due to the COVID‐19 pandemic, our business continuity plan was enabled with all staff working remotely via audio and secure video communication and full network connectivity to all critical systems with security protocols in place to protect client data.
The proposed merger with Karpus Management Inc. (KMI), which was announced on 9th June 2020, was approved overwhelmingly by CLIG shareholders yesterday with 99% voting in favor. Completion of the merger, which is expected on or around 1stt October 2020, will provide shareholders with growth potential from a more diversified revenue base and has the potential to be earnings enhancing in the first full year post‐merger.
Further details of the transaction are available in the combined circular and prospectus, which was published on 12 June 2020 in relation to the share consideration to be issued to stockholders in KMI on completion of the merger. The prospectus remains live until admission of those consideration shares on completion, currently expected to occur on 1 October 2020. Whilst the prospectus remains live, the Company is prevented under the Prospectus Regulation from providing an estimate of its profits for the financial year to 30 June 2020, in the same way as it has done in previous years, without the approval and publication of a supplementary prospectus. However, subject to audit, the Board intends to at least maintain the final dividend at the same level as last year, in line with the stated dividend policy. The Board is not aware of any material additional information that Shareholders should be aware of at this time.
——————————————————————————————————————————
FuM rebounded a further 10% to $5,503m during June to finish the year 2% higher.
Notably non-Emerging Market (EM) funds now represent 30% of total FuM — a new high.
Developed Markets (DM) witnessed its FuM expand by $470m to $1,244m — of which $284m was new client money and $186m was from market movements. The $284m ensured total new client money for the quarter was $191m — the largest quarterly inflow since CLIG began disclosing the figures three years ago. That inflow seems promising.
On the downside, EM funds saw $89m withdrawn by clients — the ninth quarterly outflow for EM funds during the last ten quarters.
For the full year, I calculate new client money was $338m and represented 6.3% of the year-start FuM of $5,389m. The same calculation 12 months ago was $96m/$5,107m = 1.9%. So an improvement to garnering new client money has occurred. I believe capturing new client money is essential for greater earnings growth and a share-price re-rating.
I should add that total FuM is not yet back at pre-Covid levels. FuM at the end of December 2019 topped $6b.
Difficult to judge CLIG’s valuation too accurately with the Karpus deal in the works. But applying the FuM/FX table in the blog post above, I arrive at earnings of £11.2m or 42.2p per share with CLIG FuM at $5,503m, GBP:USD at 1.25 and the EIP cost at zero. An EIP of 5% gives earnings of £10.4m or 39.1p per share. Either way, the trailing 28p per share ought to be covered healthily should FuM be maintained at current levels.
CLIG’s remarks of “the Board intends to at least maintain the final dividend at the same level as last year, in line with the stated dividend policy.” confirms my payout conclusion.
Maynard
City of London Investment (CLIG)
Funds under management update
FuM during July rebounded a further $280m, or 5%, to $5,791m:
FuM is now at its highest level since December 2019.
Still difficult to judge CLIG’s valuation too accurately with the Karpus deal in the works. But applying the FuM/FX table in the blog post above, I arrive at earnings of £11.4m or 43.1p per share with CLIG FuM at $5,791m, GBP:USD at 1.31 and the EIP cost at zero. An EIP of 5% gives earnings of £10.4m or 40.0p per share. Either way, the trailing 28p per share ought to be covered healthily should FuM be maintained at current levels.
Maynard