01 August 2018
By Maynard Paton
Update on City of London Investment (CLIG).
Event: Trading update and shareholder presentation/summary results for the year ending 30 June 2018 published 17 July 2018.
Summary: Bumper first-half figures and subsequent monthly updates had already ensured the fund manager’s summary annual results would be positive. However, the second half did witness funds under management decline and the group’s own projections for the coming year have now been reduced. In addition, client fees have been cut once again while the main emerging-market strategy continues to underperform. I still hope that, one day, this cash-rich, high-margin business can attract meaningful new mandates to spark a share-price re-rating. Until then, a 6.8% income remains available. I continue to hold.
Price: 400p
Shares in issue: 26,861,707
Market capitalisation: £107m
Click here to read all my CLIG posts
Results summary:
My thoughts:
* Further credit to management for another set of prompt summary results
Once again CLIG took just twelve working days to construct and publish these summary annual accounts. I wish all quoted companies could be so timely when presenting their yearly financials.
Note that CLIG’s RNS on the day did not reveal all of the numbers. The group’s website carried a City presentation, which included some detailed figures, various charts plus lots of other stats.
* Earnings came in at the mid-point my of monthly guesses
CLIG’s best-ever interim figures and subsequent website updates had already suggested these annual results would show positive progress.
In the event, the presentation confirmed funds under management (FUM) at the end of June had advanced $446m, or 10%, to $5,107m since the preceding year-end. However, FUM did slide 4% from the $5,329m reached at the December half-year.
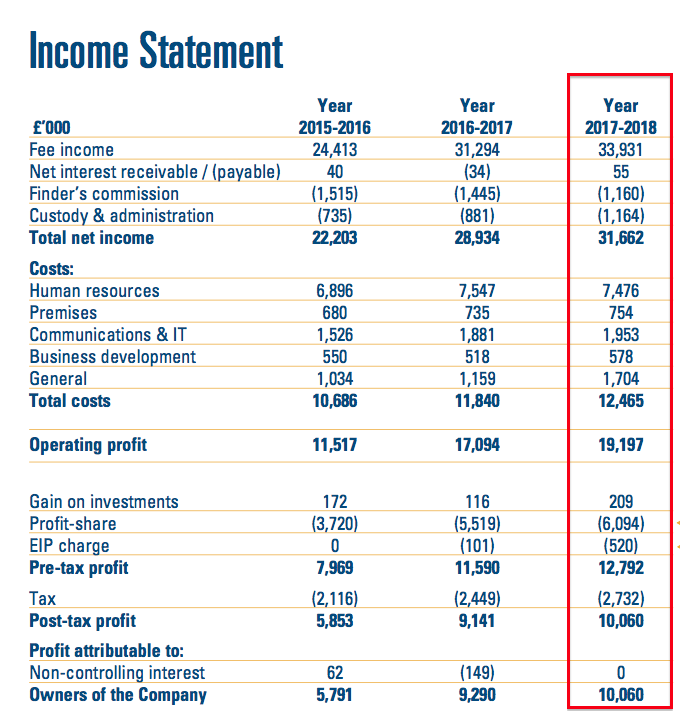
Full-year revenue climbed 8% and in turn lifted operating profit by 9%. Note that the performance was hindered slightly by adverse foreign-exchange movements. CLIG’s revenue is almost entirely denominated in USD while close to 40% of costs are denominated in GBP. I reckon the average GBP:USD rate during the year was 1.35 versus 1.27 for 2017.
My own monthly calculations following the interim numbers had indicated annual earnings could have been running at between 37.1p per share and 42.3p per share. The actual earnings reported came in around the mid-point of my guesses at 39.5p per share:
| Year to 30 June | 2014* | 2015 | 2016 | 2017 | 2018 |
| Funds under management ($m) | 3,944 | 4,211 | 4,005 | 4,661 | 5,107 |
| Revenue (£k) | 24,215 | 25,356 | 24,413 | 31,294 | 33,931 |
| Operating profit (£k) | 6,998 | 8,727 | 7,757 | 11,508 | 12,528 |
| Finance income (£k) | 244 | 205 | 212 | 82 | 264 |
| Other items (£k) | - | - | - | - | - |
| Pre-tax profit (£k) | 7,242 | 8,932 | 7,969 | 11,590 | 12,792 |
| Earnings per share (p) | 20.7 | 26.4 | 23.6 | 36.9 | 39.5 |
| Dividend per share (p) | 24.0 | 24.0 | 24.0 | 25.0 | 27.0 |
(*13 months)
CLIG’s 2018 performance was the company’s best since 2011, when revenue was £37m and operating profit was £13m.
The icing on the cake was the annual payout being lifted tuppence to 27p per share. The dividend has now been raised two years on the trot following six years of a static 24p per share payout.
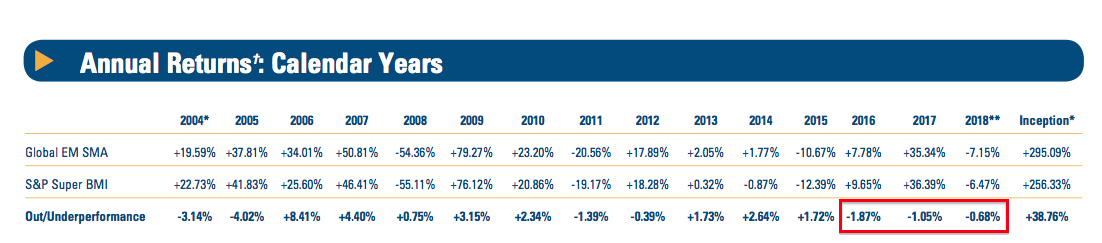
* Heading for a third straight year of underperformance
CLIG’s investment strategies offered mixed investment returns and differing client-money movements during the year:
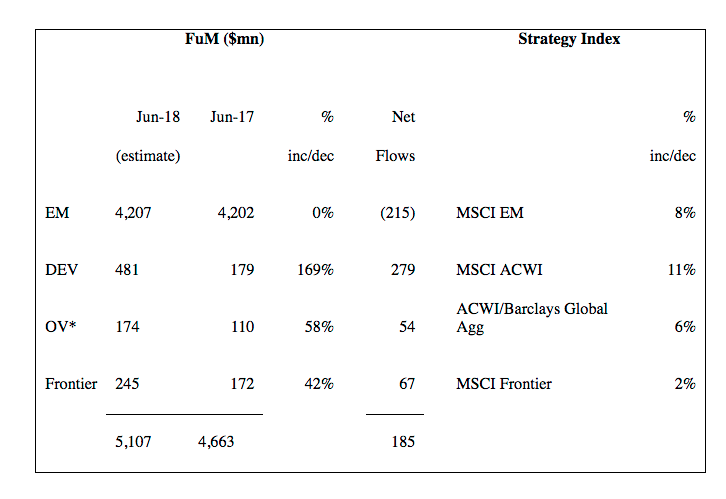
The main emerging-market division — which now accounts for 82% of FUM — recorded a 5% positive return that was all but wiped out by client withdrawals of $215m. The associated benchmark gained 8%.
I mentioned within January’s write-up that CLIG’s representative Emerging Market fund had lagged various benchmarks during the last two years.
The red circles within the slide below confirmed that remains the case:
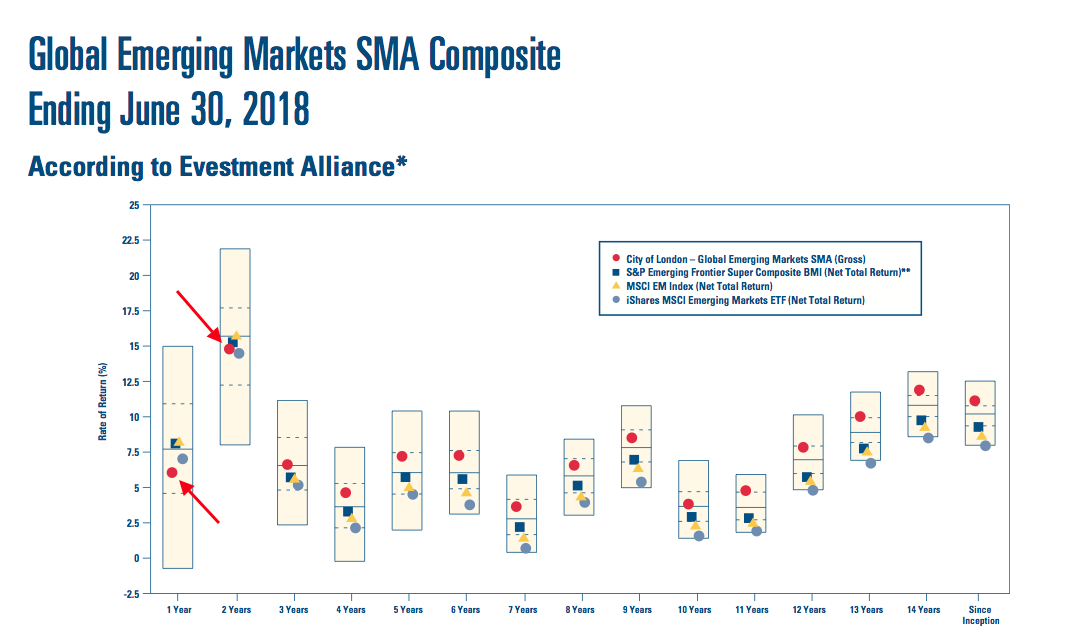
Another slide showed the same representative fund heading for its third straight year of underperformance:
Better progress was reported within CLIG’s developed-market, frontier-market and opportunistic-value products. These divisions combined to almost double their total FUM to $900m following an extra $400m of incoming client money.
These smaller divisions collectively reported an 8% or so investment return, which looks to have matched their associated benchmarks.
I have my fingers crossed that CLIG’s smaller products can continue to attract new money… while clients of the emerging-market division might soon stop heading for the exits!
Mind you, I do wonder if all the client inflows and outflows are simply due to existing customers shifting their money from one division to another.
You see, the shareholder presentation showed CLIG serving 156 clients at the end of June, while the count this time last year was 155 and the count the year before that was 153.
All in all, I get the impression CLIG’s current FUM progress remains dictated mostly by wider market movements, with all the client comings and goings counterbalancing each other.
* The red dotted lines show the earlier, larger, profit projection
The aforementioned 4% reduction to FUM during the second half appears to have knocked CLIG’s own projections within its dividend-cover template:
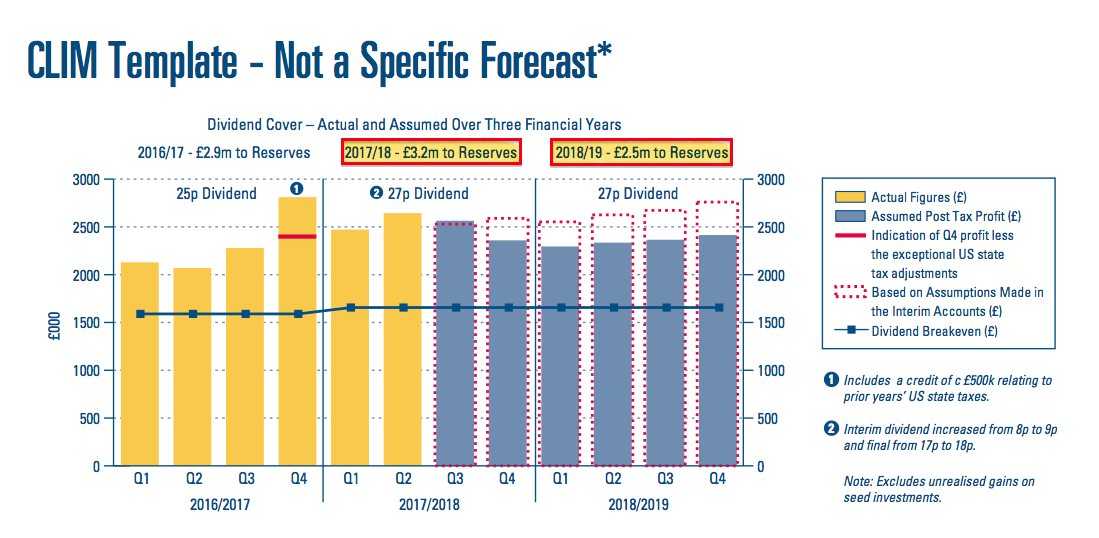
Don’t get me wrong, I still applaud CLIG for regularly publishing this template to highlight what could happen.
But the ups and downs of client additions/withdrawals — alongside wider market movements — have shown this bar chart to be somewhat optimistic at times.
You can see that for yourself in the picture above, with the red dotted lines indicating the previous quarterly profit projections.
For the record, at the start of the year the template looked like this:
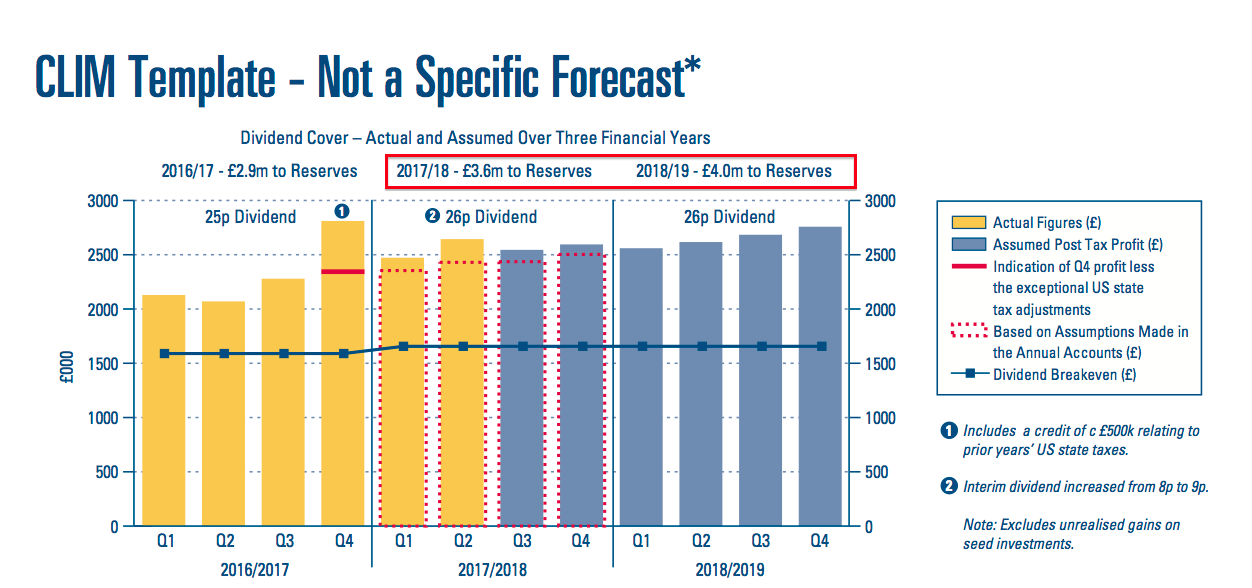
Essentially CLIG now reckons it could retain earnings of £2.5m during the current 2019 financial year — versus £4.0m expected back in January.
I reckon £2.5m transferred to reserves after paying a 27p per share dividend means earnings could be approximately 36p per share.
Closer inspection of the template’s “key assumptions” shows the firm now expecting FUM to increase by $250m during the coming year:
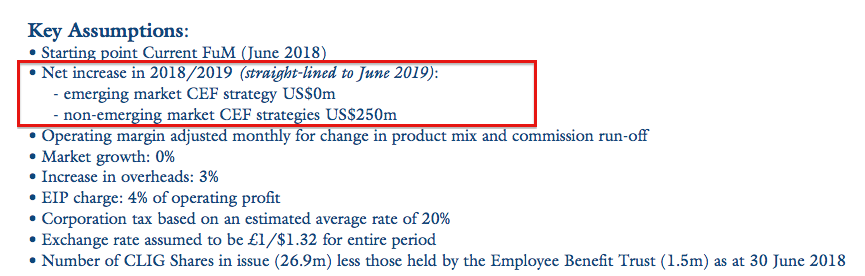
Back in January the projection was $350m.
* Illustrative FUM/exchange-rate table discloses another 2 basis-point reduction to client fees
I was disappointed to see CLIG yet again owning up to lower net fees within its helpful FUM/exchange-rate table:
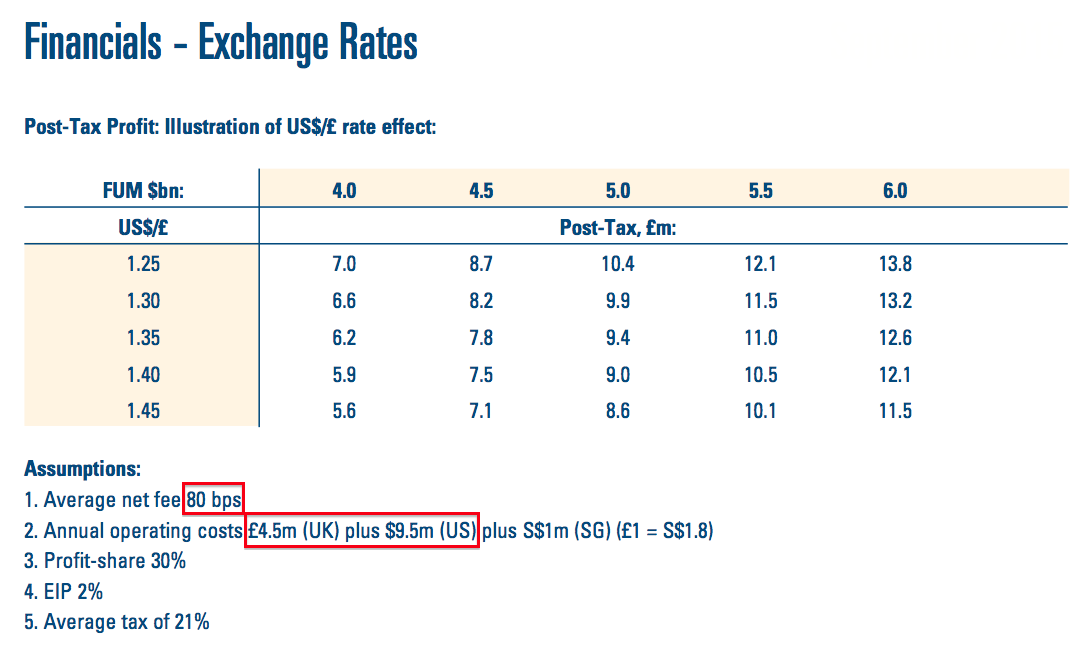
January’s table had indicated CLIG would earn net fees at 82 basis points on client money. Last July’s table had indicated the rate was 84 basis points, while the rate was 86 basis points the year before.
I wonder if the next presentation will show fees another two basis points lower at 78.
Meanwhile, operating costs have shifted from £5m plus $8.5m to £4.5m plus $9.5m. At the current GBP:USD rate of 1.31, the change implies operating costs will rise 2%.
I see the indicated charge for the Employee Incentive Plan (EIP) remains at 2%. The cost of this terrible scheme during 2018 was actually £520k, or 2.7% of pre-bonus operating profit.
I dare say the EIP’s cost could reach the 5% cap during the plan’s remaining two years. The earlier “key assumptions” for that dividend-cover template are projecting 4%.
I also note the indicated tax rate is 21%, which matches the 21% applied to the 2018 income statement but compares to 20% cited in those earlier “key assumptions”.
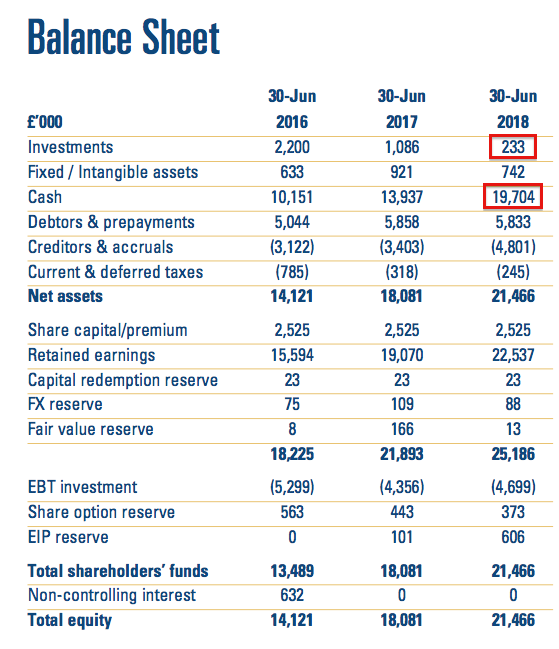
* Balance sheet and cash flow
The summary accounts did not show anything untoward.
The balance sheet displayed cash of £19.7m and net investments of £0.2m versus £13.9m and £1.1m twelve months prior:
Meanwhile, the cash flow statement showed the bank balance bolstered by a useful £1.6m contribution from staff options and the sale of certain seed investments:
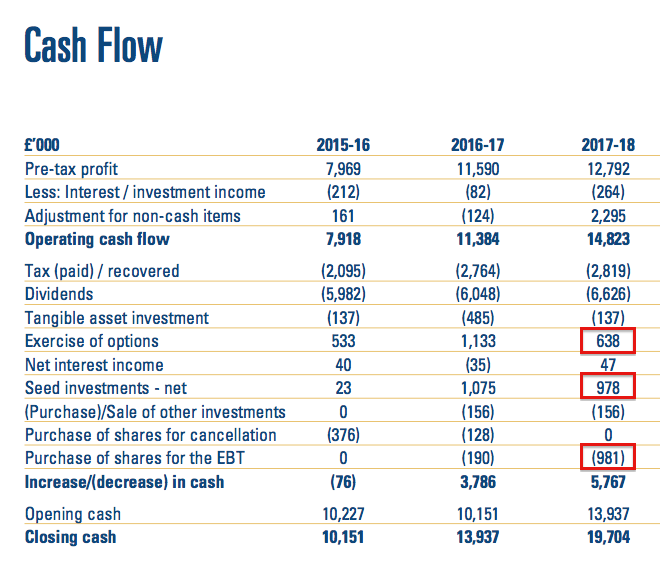
Note, too, that almost £1m was spent on shares for the employee share scheme. I should add that, during the last five years, the cost of buying shares for the employee scheme has been offset by the cash received from the same scheme’s option exercises.
———————–
Update 17 September 2018:
Following the publication of the full 2018 results (see this Comment below), I can confirm cash generation during last year — and the few years before that — has been very positive:
| Year to 30 June | 2014* | 2015 | 2016 | 2017 | 2018 |
| Operating profit (£k) | 6,998 | 8,727 | 7,756 | 11,509 | 12,528 |
| Depreciation and amortisation (£k) | 185 | 171 | 168 | 231 | 295 |
| Net capital expenditure (£k) | (38) | (108) | (137) | (485) | (137) |
| Working-capital movement (£k) | (1,933) | 442 | (22) | (533) | 1,423 |
| Net cash and investments (£k) | 11,031 | 11,707 | 11,719 | 15,022 | 19,937 |
(*13 months)
Since 2014, aggregate cash spent on capital expenditure (of only £906k) has been covered by the depreciation and amortisation charged against earnings.
Meanwhile, just £623k has been absorbed into working-capital requirements during a five-year period when total operating profit came to £48m.
———————–
My early sums indicate the 2018 operating margin was a healthy 37% (the highest since 2008), with the return on average equity coming in at a robust 51%:
| Year to 30 June | 2014* | 2015 | 2016 | 2017 | 2018 |
| Operating margin (%) | 28.9 | 34.4 | 31.8 | 36.8 | 36.9 |
| Return on average equity (%) | 36.1 | 47.7 | 42.7 | 58.9 | 50.9 |
I will look at the accounts in more detail when the full annual report is issued during September.
Valuation
I am using CLIG’s latest exchange-rate/FUM table (see above) for my valuation sums.
FUM at $5,107m and GBP:USD at 1.31 lead to earnings of approximately £10.1m or 37.8p per share based on an EIP charge of 2% and tax at 21%.
Assume the EIP is the maximum 5%, though, and earnings come to £9.7m or 36.1p per share.
Adjusting the £107m market cap for the cash and investments of £19.9m and regulatory capital of £1.5m, my enterprise value (EV) calculation for CLIG is approximately £89m or 331p per share.
Dividing that EV by my earnings guesses gives possible P/Es of 8.8 and 9.2 — depending on which EIP assumption is used. Either way, the multiple range hardly looks expensive in the current market.
That said, do remember:
i) these shares have rarely traded at an extended rating;
ii) little progress has been made attracting additional FUM and clients for some years;
iii) client fee rates have been chipped lower over time, while costs have been rising;
iv) the balance sheet has regularly carried a sizeable cash position, which in reality may be needed to reassure clients and therefore might not be ‘surplus to requirements’ for valuation purposes, and;
v) founder/chief exec Barry Olliff retires at the end of 2019 and is currently reducing his near-8% shareholding (he last sold during March at 450p).
In my view, a notable re-rating will be hard to achieve until the group starts to win fresh clients that bring in significant FUM.
Still, I am happy for now to collect the greater, 27p per share, dividend and enjoy the 6.8% income — and trust one day there could be some meaningful client/FUM improvements.
Maynard Paton
PS: You can now receive my Blog posts through an occasional e-mail newsletter. Click here for details.
Disclosure: Maynard owns shares in City of London Investment.

City of London Investment (CLIG)
Funds under Management update
FUM during July advanced by $63m to $5,170m:
https://citlon.com/investor-relations/funds-under-management.php
The monthly advance was the first reported since January.
Using the exchange-rate/FUM table shown in the Blog post above, but applying a 35% staff profit-share/EIP, I arrive at earnings of £10.29m or 38.3p per share with client money at $5,170m and £1 buying $1.27.
Maynard
City of London Investment (CLIG)
Funds under Management update
FUM during August decreased by $31m to $5,140m:
https://citlon.com/investor-relations/funds-under-management.php
Using the exchange-rate/FUM table shown in the Blog post above, but applying a 35% staff profit-share/EIP, I arrive at earnings of £9.80m or 36.5p per share with client money at $5,140m and £1 buying $1.30.
Maynard
City of London Investment (CLIG))
Publication of 2018 Final Results and Annual Report
CLIG published its final results and annual report for 2018 on 17th September. As far as I could tell, there was no difference between the numbers published within July’s summary statement (as reviewed in the Blog post above) and the subsequent full final results.
I have amended the Blog post above to include a new cash flow table.
Here are some points of interest from the annual report:
1) Management commentary
The summary statement reviewed within the Blog post above contained little in the way of a management narrative, so the chairman’s statement and chief exec’s statement were entirely fresh.
To be frank, the narrative once again appeared a little too self-congratulatory — the chairman does like to refer to CLIG’s ‘outperformance’ since the 2006 flotation.
Perhaps the most noteworthy parts of the management narrative were:
a) Chief exec Barry Olliff perhaps becoming a consultant after retiring at the end of 2019:
b) Talk of a special dividend or buyback:
I wonder if Mr Olliff’s upcoming retirement has prompted this talk. I also wonder if CLIG will buy back Mr Olliff’s shares. I hope not — Mr Olliff should sell them in the market, and not use money effectively owned by continuing shareholders to fund his retirement. A special dividend would be a much fairer distribution of CLIG’s excess cash.
That CLIG could deliberate over handing back excess cash usefully confirms that some of the group’s cash is indeed surplus. The group’s hoarding has not always suggested all of the cash was surplus.
Annual reports do not often show this type of chart:
Anyway, Mr Olliff’s statement confirmed he would sell more shares should the price reach 450p, 475p and 500p:
2) Lower fees
My Blog post above noted CLIG’s lower fee rates from clients, and CLIG has noted the decline with this chart:
The decrease is due to lower fee rates on the ‘diversified’ funds outside of the main Emerging Market strategy:
I hope this part of the business can indeed “grow significantly“. ‘Diversified’ funds under management represented 18% at the year end and “at the time of writing” of the annual report were “a little over 20%“.
3) Clients
This is CLIG’s most embarrassing chart:
The yellow blocks represent new client money being added and withdrawn each year. As far as I can tell, on aggregate since the flotation, CLIG has experienced a minimal net inflow of client money.
CLIG admitted a net $215m was withdrawn from its core Emerging Market funds, and a net $400m added to its other funds, during 2018:
This next chart shows the money invested by the largest 10 clients:
These 10 clients represent 48% of total funds under management, versus 50%, 47% and 44% for 2017, 2016 and 2015 respectively.
Newcomers on the list are clients 8 and 10, who bring $258m and replace two clients who had an aggregate $268m on last year’s list.
This next chart confirms a (welcome) improvement to the number of total clients. It appears fresh clients (represented by the dark-blue shading) have replaced many 5-to-10-year clients (light-blue shading):
4) A former director returns
An interesting snippet:
Mr Yuste resigned as Business Development Director at the end of 2015 after a 10-year stint on the board. No explanation was given for his return. He does not serve on the board now.
5) Director pay
There was nothing too surprising with CLIG’s director pay.
This table shows what the board earned:
The main execs received minimal or no increases:
Mr Olliff has apparently not enjoyed a pay rise for at least ten years:
But he remains entitled to 5% of pre-tax profits (and decides to collect ‘only’ 4.2%):
And he can enjoy 6 weeks off with pay alongside his 30-day holiday entitlement:
Not everyone is happy with CLIG’s director pay:
Votes against were 18%, 18% and 16% for 2017, 2016 and 2015 respectively.
I have included this next snippet because every director attended every full board, audit and remuneration meeting:
This attendance record is the best since the group began disclosing such information during 2011. Nice to see the directors are now attending meetings for their pay — although one director did miss a nominations gig last year.
6) Employees
I am pleased CLIG could manage the 10% FUM advance during 2018 by hiring only one extra employee:
Average FUM per employee is $70.0m, which is the highest since 2011 ($85m). Gross fee income per employee is £465k, the highest since 2011 (£537k).
One the downside, the cost per employee has jumped to £193k — the highest ever (previous rates were c£150k and the previous peak was £182k). I see employee costs as a proportion of revenue was 42% during 2018, in line with the 42% of 2017, 41% of 2015 and 43% of 2016.
Sad to see that just three staff members remain devoted to business development/marketing — which is no doubt why new client money has been hard to locate.
This chart shows the group’s portfolio managers are loyal employees:
The numbers below provide an update to the cost of the egregious EIP:
The estimated £532k awards charge for 2017 has been upgraded to £581k and the 2018 awards charge has been guessed at £839k.
7) Working capital
Once again I can’t fault CLIG’s cash production and working-capital profile.
I have inserted a new cash-flow table in the Blog post above to highlight the cash generation.
It is also worth looking at CLIG’s trade receivable and trade payable accounting notes:
Trade receivables of £34k and trade payables of £19k are ludicrously small. It just goes to show not a lot is tied up in ‘invoiced’ working capital.
(You will see CLIG does have sizeable accrued income (in the receivables note) and accruals (in the payables note). These figures represent revenue and expenses that relate to the 2018 year but have not yet been invoiced to the customer (revenue) or invoiced to CLIG (expenses). I am not too worried about these amounts and the associated invoice timing given CLIG’s overall cash production)
Maynard
City of London Investment (CLIG)
Trading Update: Q1 Funds Under Management
This update was published on 8 October.
During the three months to 30 September, funds under management (FUM) fell by $99m to $5,008m. A net extra $8m came from new client money and a negative $107m was due to the performance of the funds.
I felt this line to be a bit worrying:
“The Group’s income currently accrues at a weighted average rate of approximately 77 basis points of FuM, net of third party commissions.”
The group had been accruing management fees at approximately 80 basis points of FUM.
I understand CLIG’s non-emerging market (EM) funds have lower fees than the main EM division, and non-EM funds now represent 19.8% of FUM versus 17.6% at the end of December 2017. So that movement explains the direction of travel of the management-fee rate — which I admit is not great when total FUM has been sliding:
Anyway, here is the Q1 FUM table and the full text:
——————————————————————————————————————-
IM Performance
IM performance was slightly behind benchmark over the quarter. Specifically, in the Emerging Market and Frontier strategies underlying NAV performance was weak (that is, the underlying closed-end fund managers underperformed their relevant benchmark indices). In the Developed strategy relative returns were impacted by widening discounts.
Flows were neutral over the quarter. The EM, Frontier and Opportunistic value strategies saw rebalancing outflows which were offset by continued strong flows into the Developed strategy and the funding of a new Municipal bond mandate.
Operations
The Group’s income currently accrues at a weighted average rate of approximately 77 basis points of FuM, net of third party commissions. “Fixed” costs are c. £1.1 million per month, and accordingly the current run-rate for operating profit, before profit-share of 30% and an estimated EIP charge of 4%, is approximately £1.4 million per month based upon current FuM and a US$/£ exchange rate of US$1.3 to £1 as at 30th September 2018.
The Group estimates that the post-tax profit for the first three months of the year will be approximately £2.2 million (2017: £2.5 million).
Dividends
The final dividend of 18 pence per share, subject to approval at the AGM on 22nd October 2018, will be paid on 30th October 2018, bringing the total dividend for the financial year 2017-18 to 27 pence (2016-17: 25 pence).
——————————————————————————————————————-
Using the exchange-rate/FUM table shown in the Blog post above, but applying a 77 basis point fee rate (instead of 80) and a 35% staff profit-share/EIP (instead of 32%), I arrive at earnings of £8.71m or 32.4p per share with client money at $5,007m and £1 buying $1.32.
Using the old 80 basis-point level for fee income, my sums would have arrived at earnings of £9.29m — some 6.7% greater.
Maynard
City of London Investment (CLIG)
Funds under Management update
FUM during October decreased by $417m to $4,592m:
https://citlon.com/investor-relations/funds-under-management.php
Using the exchange-rate/FUM table shown in the Blog post above, but applying a 77 basis point fee rate (instead of 80) and a 35% staff profit-share/EIP (instead of 32%), I arrive at earnings of £7.62m or 28.4p per share with client money at $4,592m and £1 buying $1.30.
Maynard
City of London Investment (CLIG)
Funds under Management update
FUM during November increased by $136m to $4,733m:
https://citlon.com/investor-relations/funds-under-management.php
Using the exchange-rate/FUM table shown in the Blog post above, but applying a 77 basis point fee rate (instead of 80) and a 35% staff profit-share/EIP (instead of 32%), I arrive at earnings of £8.42m or 31.4p per share with client money at $4,733m and £1 buying $1.27.
Maynard
City of London Investment (CLIG)
Funds under management update
FUM during December decreased by $108m to $4,625m:
https://citlon.com/investor-relations/funds-under-management.php
Using the exchange-rate/FUM table shown in the Blog post above, but applying a 77 basis point fee rate (instead of 80) and a 35% staff profit-share/EIP (instead of 32%), I arrive at earnings of £7.80m or 29.2p per share with client money at $4,625m and £1 buying $1.29.
Maynard