10 May 2019
By Maynard Paton
Results verdict on Getech (GTC):
- Total revenue gained 11% to set the highest level since 2015. The dominant and more attractive Products division impressed with a 24% revenue improvement.
- Progress was achieved in particular by a last-gasp $3.2m sale that contributed approximately 30% to the top line.
- Profit was hampered by the loss-making Services division, although significant cost savings have since been made.
- The direction of the oil price may largely dictate whether GTC’s oil-exploration software sells well (or not) during 2019.
- The £11m market cap requires greater earnings to underpin obvious upside potential. I continue to hold.
Contents
Event link and share data
Why I own GTC
Results summary
Revenue and profit
H1 vs H2
Financials
Valuation
Event link and share data
Event: Final results for the twelve months to 31 December 2018 published 07 May 2019
Price: 28p
Shares in issue: 37,563,615
Market capitalisation: £10.5m
Why I own GTC
- Develops “market-leading” geoscience/oil-exploration software that enjoys multi-year contracts, a blue-chip client base and a recent track record of strong growth.
- Chief executive recruited during 2016 has implemented a greater commercial focus and his high-flying CV underpins the prospect of significant turnaround potential.
- An £11m market cap could offer notable upside if a rising oil price prompts greater sales and leads to much improved earnings from a mostly fixed cost-base.
Further reading: My GTC Buy report | All my GTC posts | GTC website
Results summary

Revenue and profit
- A trading statement issued during March had already revealed the gist of these final results.
- Revenue was indeed £8.0m, Ebitda was indeed £1.2m and cash in the bank was indeed £1.4m.
- Operating profit before restructuring costs came in at £447k.
- The results were published one week after the scheduled date cited within the March update. Restating the group’s inventories as intangible items probably did not accelerate the bookkeeping prep.
- GTC used this RNS to publish the proper comparative figures — for the twelve months to December 2017 — for the first time. Last year GTC changed its year-end from July to December and released only 17-month figures.
- Revenue gained 11% during 2018 to set the highest level since 2015. Profit remains well below the heyday levels of £2m:
| Year to 31 December | 2014* | 2015* | 2016* | 2017 | 2018 |
| Revenue (£k) | 6,593 | 8,638 | 7,031 | 7,215 | 8,019 |
| Operating profit (£k) | 969 | 1,987 | (126) | 145 | 447 |
| Finance costs (£k) | 32 | 5 | (22) | (30) | (25) |
| Other items (£k) | - | - | 819 | (574) | (197) |
| Pre-tax profit (£k) | 1,001 | 1,992 | 671 | (459) | 225 |
| Earnings per share (p) | 5.21 | 5.77 | 3.25 | 0.15 | 1.35 |
| Dividend per share (p) | 2.20 | 2.20 | - | - | - |
(*year to 31 July)
- Revenue is generated mostly from customers within the oil and gas industry. GTC’s statements regularly recap oil-price movements and suggest higher oil prices should deliver better progress.
- The chart below shows the oil price:
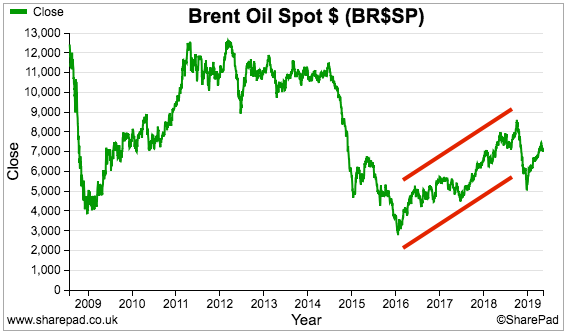
- The revenue increases enjoyed during 2017 and 2018 coincided with strong years for the oil price.
- A $3.2m multi-product sale agreed during December contributed more than £2.5m — or approximately 30% — to the 2018 top line.
- The Products division impressed with a 24% revenue improvement that followed a 19% improvement the year before:
| Year to 31 December | 2014* | 2015* | 2016* | 2017 | 2018 |
| Revenue | |||||
| Products (£k) | 5,364 | 4,727 | 4,320 | 5,155 | 6,434 |
| Services (£k) | 1,166 | 3,903 | 2,628 | 2,060 | 1,585 |
| Gross profit | |||||
| Products (£k) | 2,752 | 3,153 | 2,822 | 3,591 | 4,013 |
| Services (£k) | 614 | 2,209 | 658 | 68 | (225) |
(*year to 31 July)
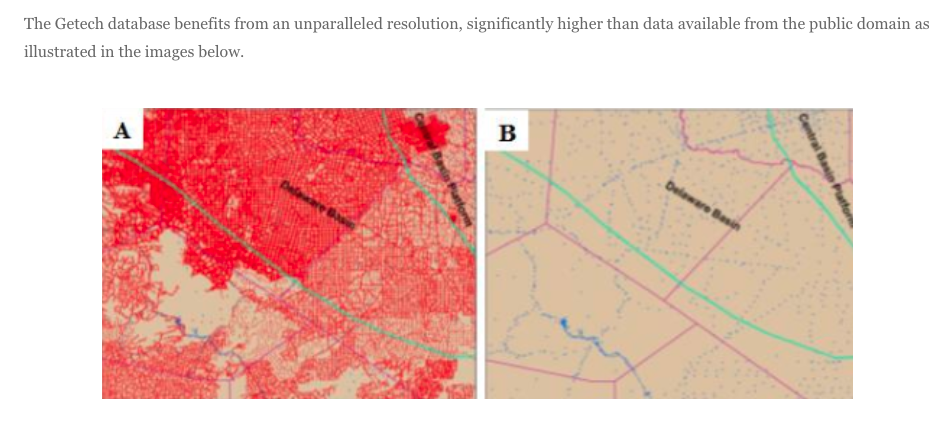
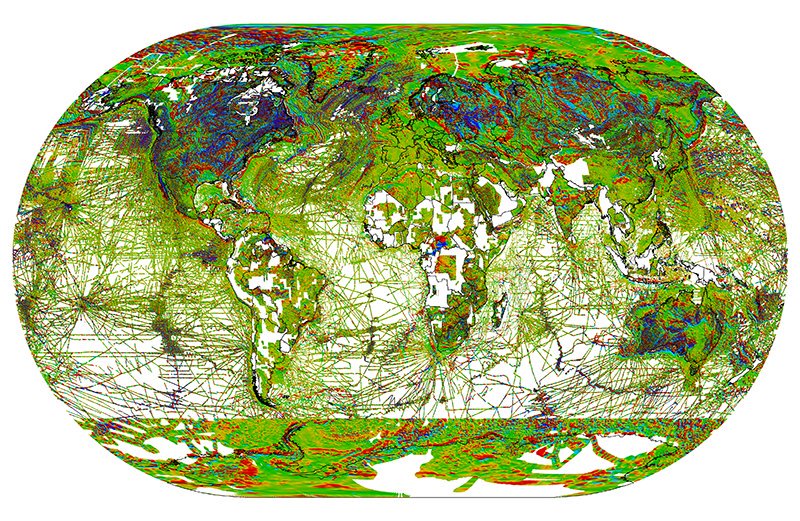
- The Products division encompasses GTC’s proprietary data and software sales and has grown to represent 80% of group revenue and more than 100% of group profit.
- GTC claims its data offers “unparalleled resolution” and “constitutes a vital component of any oil-exploration campaign“:
- Management remarks about the Products division contained some encouraging terms (my bold):
“Our Gravity and Magnetic Solutions team performed solidly in 2018, underscoring our market-leading position in this domain.”
“Data sales remained robust and our team’s unique and leading expertise in potential fields data processing, analysis and interpretation was recognised by a busy programme of Gravity & Magnetic service contracts throughout the year.”
“Our flagship Globe product, developed by our Geoscience Information Products team, goes from strength-to-strength.”
“Our work to re-position Globe was rewarded in 2018 by many of Globe’s super-major customers signing up to multi-year licence agreements.“
- The Services division delivered a poor performance due to the “challenging” market for geoscience consultancy. Divisional revenue dived 23%.
- A consultancy agreement with the government of Sierra Leone is one example of difficult Services progress. The agreement commenced in October 2017, has suffered various delays and has yet to deliver a worthwhile return.
- Services reported a £225k loss before central costs for 2018. Underlying group operating profit could therefore have been (in theory) 50% higher at £672k had the division not existed.
- Restructuring the Services division during Q4 cost an ‘exceptional’ £197k and “signs of improvement” have since been witnessed. Associated savings should amount to a significant £500k a year.
- GTC said it would “target a return to a 25% margin for the Services division in the mid-term”.
Enjoy my blog posts through an occasional email newsletter. Click here for details.
H2 vs H2
- The second half produced a much better profit performance than the first:
| H1 2017 | H2 2017 | FY 2017 | H1 2018 | H2 2018 | FY 2018 | ||
| Revenue (£k) | 3,055 | 4,160 | 7,215 | 2,879 | 5,140 | 8,019 | |
| Operating profit (£k) | (399) | 544 | 145 | (522) | 969 | 447 |
- GTC’s data and product sales can be significant and unpredictable.
- A $0.9m data sale was concluded during early July while the aforementioned $3.2m multi-product sale was concluded during late December.
- Arguably H2 revenue of up to $4.1m — approximately £3.2m, or close to two-thirds of total H2 revenue — was generated by these two agreements.
- Whether GTC can continue to win large contracts on a regular basis is difficult to say. The $3.2m multi-product sale was referred to only as a “high-value sale” within the RNS small-print.
Financials
- Minimal profit and awkward cash flow have left GTC’s accounts in an underwhelming state.
- Margins and returns on equity have slid to very low levels:
| Year to 31 December | 2014* | 2015* | 2016* | 2017 | 2018 |
| Operating margin (%) | 14.7 | 23.0 | (1.8) | 2.0 | 5.6 |
| Return on average equity (%) | 21.4 | 20.1 | 9.7 | n/a | 4.1 |
(*year to 31 July)
- Free cash flow (excluding tax refunds) for the year was a negative £1.8m, all of which was due to adverse working-capital movements and the last-gasp timing of the aforementioned “high-value sale”:
| Year to 31 December | 2014* | 2015* | 2016* | 2017 | 2018 |
| Operating profit (£k) | 969 | 1,987 | (126) | 145 | 447 |
| Depreciation and amortisation (£k) | 240 | 366 | 671 | 813 | 820 |
| Net capital expenditure (£k) | (190) | (1,364) | (856) | (1,240) | (952) |
| Working-capital movement (£k) | (1,574) | 573 | (448) | 472 | (1,919) |
| Net cash (£k) | 3,423 | 3,694 | 1,888 | 1,759 | 468 |
(*year to 31 July)
- Free cash flow (excluding tax refunds) for 2017 was positive at more than £0.7m.
- This time last year GTC claimed: “With c85% of our cost base fixed, each 10% increase in revenue would broadly translate to a £0.6 million increase in free cash flow.”
- This year’s working-capital movements have clearly scuppered that claim. Revenue during 2018 increased by 11% and yet free cash flow decreased.
- The “£0.6m increase” projection was not repeated this year.
- However, GTC did reiterate its c85% fixed cost-base. Margins should in theory increase when revenue advances.
- GTC enjoys a remarkable tax profile:
| Year to 31 December | 2014* | 2015* | 2016* | 2017 | 2018 |
| P&L tax (charge)/credit (£k) | 574 | (179) | 418 | 517 | 283 |
| Cash tax (paid)/refunded (£k) | (180) | 457 | (326) | 437 | 514 |
(*year to 31 July)
- The business has declared tax credits within four of the last five financial years. Cash tax refunds totalling £0.9m have been received.
- GTC claimed: “To help our customers understand and resolve their exploration and operational challenges requires us undertaking pioneering research and development. Against the cost of this work we obtained corporation tax relief…”
- The R&D tax credits have been vital for shoring up the balance sheet.
- Cash at the year end stood at £1.4m. Debt at the year end stood at £0.9m. Net cash therefore stood at £0.5m
- The debt is secured on GTC’s Leeds office, which includes “a grand neo-Jacobean style carved wooden staircase” and “a superb glazed ‘peacock cupola’ dome”, and is in the books at £2.4m.

- The Leeds office remains for sale. “Volatile macroeconomic conditions” were blamed for a lack of suitable offers. A buyer is not expected before July.
- GTC remains “committed” to the office disposal. March’s statement said the company was “not a forced seller”.
- GTC could really do with selling the office. Reducing the asking price may counter the “volatile macroeconomic conditions”.
- GTC refinanced its debt during the year. £634k was repaid and replaced by £950k.
- The old debt incurred 2.04% interest above the base rate. The new debt incurs 2.75% above base. GTC’s lender may believe the risk of non-repayment has increased.
- GTC capitalised product development costs of £0.9m onto the balance sheet. A similar sum is expected for 2019.
- The depreciation and amortisation charged against earnings have not always covered the capitalised expenditure (see earlier table).
- The balance sheet carries no pension complications.
Valuation
- A 28p offer price supports a £10.5m market cap.
- The £2.4m Leeds office is surplus to requirements and suggests the underlying business is valued at closer to £8m.
- Book value at £12.7m — which includes goodwill/other intangibles of £7m — is greater than the market cap.
- Assuming profit is sustained within the Products division, cost savings within the Services subsidiary may help group operating profit approach (or exceed) £0.7m during 2019.
- Ignoring the potential for tax refunds to bolster earnings, GTC’s profit really has to top £1m before the current market cap starts to become blatantly attractive.
- GTC’s outlook for 2019 was subdued: “[T]he lengthening of the sales cycle that emerged in Q4 2018 has persisted into 2019 [and] the Directors believe that customers remain cautious over the early release of their exploration and new business budgets.”
- Customer demand during 2019 could wax or wane simply due to the direction of the oil price.
- An absence of a repeat, $3.2m multi-product sale would hamper progress this year.
- References to “diversified organic growth” and “acquisitional growth” suggest GTC is keen to lessen its dependence on oil and gas customers.
- The present low levels of profit and net cash do not readily flag a strong acquisition war-chest. The existing business ought really to be improved first.
- Maybe one day GTC’s software and data products could re-exhibit the attractive economics of yesteryear — or at least something close to them.
- Between 2012 and 2015 for example, the operating margin averaged 21% and return on equity topped 27%.
- Shareholders can only hope the oil price eventually prompts greater demand for GTC’s software and data.
- GTC also said: “As the markets into which we sell stabilise, we also see potential to reinstate dividend payments.”
- GTC last declared a dividend during 2015.
- Similar to the talk of acquisitions, the present low levels of profit and net cash do not readily indicate a business that should be contemplating dividends just yet.
Maynard Paton
PS: You can receive my blog posts through an occasional email newsletter. Click here for details.
Disclosure: Maynard owns shares in Getech.

Getech (GTC)
Publication of 2018 annual report
Here are points of interest.
1) General
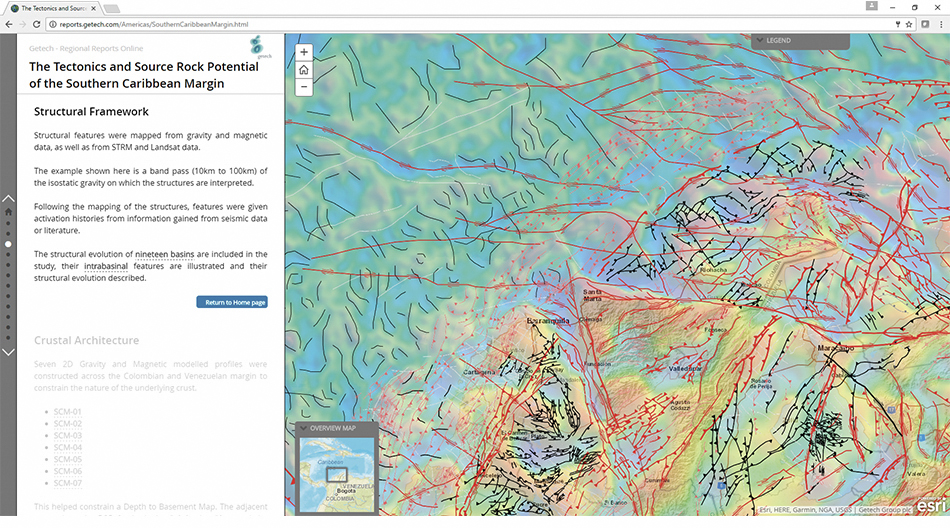
GTC continues to suggest it enjoys a worthwhile competitive position:
The 2018 annual report is the first to helpfully include some case studies about the group’s products:
2) Corporate governance
GTC has followed the new AIM rules by declaring a corporate governance statement:
The statement contained nothing of major interest. Snippets include the business targeting repeat revenue and being open to questions at the AGM:
3) Director pay
The chief exec is on a chunky £250k yearly wage:
Dr Copus was paid £323k for the 17-month preceding period, which equates to £228k over 12 months. So a 10% pay rise appears to have been awarded. I can only keep trusting he is worth the money. His CV is impressive and GTC appears to be in much better shape since his appointment as boss.
4) Auditor
Grant Thornton — auditor of Patisserie Valerie — audits GTC:
Grant Thornton has audited GTC since at least 2006 when GTC floated.
I am not thrilled that the finance director has been revealed to be an ex-Grant Thornton employee:
I suppose everything is above board.
5) Risks
GTC’s ‘liquidity’ risk has a possibly ominous addition:
GTC now refers also to ‘cash flow risk’ and a ‘volatile working capital cycle’, and mitigates such dangers through ‘careful budgeting’.
GTC’s working capital demands (see Trade Receivables below) expanded significantly during 2018, following a substantial $3.2m last-gasp data sale — the payment for which was outstanding at the year end. The risk is of course that this payment never arrives.
‘Oil investment cycle’ now replaces ‘oil price’ as a risk. This risk previously cited the uncertainty of the long-term oil price. Now the risk concerns the broader ‘customers permanently reducing their spending on hydrocarbon exploration’.
Brexit is cited as a new risk:
6) Substantial shareholders
I think for the first time ever, GTC has published a proper list of 3%-plus shareholders within its annual report:
7) New accounting rules
New revenue recognition rules (IFRS 15) could have affected the reporting of GTC’s contract sales, but the effect was not significant:
Nothing to worry about with IFRSs 9 and 16:
8) Segment information
First time I have seen segmental revenue split between ‘at a point in time’ and ‘over time’:
I presume the difference is revenue recognised all in one go is classified as ‘at a point in time’ and other revenue is classified as ‘over time’
9) Largest client
Confirmation of the year’s last-gasp data sale representing £2.5m — or 31% — of revenue:
10) R&D expenses
Less R&D is being expensed against earnings (see Intangibles below):
11) Tax
GTC’s lack of tax payments is due mostly to R&D tax relief
(I need to read this guide)
12) Intangibles
GTC’s R&D is now mostly capitalised on to the balance sheet as ‘development costs’:
£861k was capitalised during 2018 and £503k of previous expenditure was amortised.
The £861k will be amortised during the next 5-10 years:
I must admit 5-10 years is a long time. That said, acquired data is amortised over 10 years and the chief exec has said in the past that these datasets “do not go stale”
The note below is interesting:
GTC reckons its sales (or at least sales stemming from certain intangible items) could grow at 10% a year for the next 5 years. GTC also reveals a ‘successful licensing round’ (presumably Sierra Leone) may happen during 2019. A £234k write-off will occur if these assumptions are not met.
13) Freehold
The Leeds office that is up for sale has a book value of £2.4m:
The accompanying small-print does not suggest an imminent disposal.
14) Employees
GTC has improved its workforce productivity:
The headcount was reduced by 16, and allowed revenue per employee to improve from £81k to £102k — the highest since 2013 (£114k).
Average cost per employee remains at £56k and employee costs as a proportion of revenue saw a welcome decrease from 71% to 59% — the lowest since 2014 (56%).
15) Trade receivables
Given the $3.2m last-gasp data sale, trade receivables of £3.5m — representing a massive 44% of revenue — is perhaps not so surprising:
However, exclude £2.5m (as the data sale) from both the £3.5m trade receivables and £8.0m of revenue, and trade receivables of £1m would represent 18% of £5.5m of revenue — a percentage in line with previous years. I therefore reckon the $3.2m owed for the data sale was entirely outstanding at the year end.
Note, too, the 3x increase in accrued income — revenue recognised in the year but has yet to be invoiced to the client. Accrued revenue always involves extra accounting guesswork, and is one step further away from a bill being paid than a proper ‘trade receivable’.
£606k of trade receivables were past their due date at the year end:
The figures for the preceding three years were £633k, £1,083k and £741k. So nothing obviously unusual here — but the situation emphasises some of GTC’s clients are late payers.
16) Deferred income
GTC enjoys deferred income — essentially upfront payments from clients for services yet to be supplied:
The £701k amount is a useful increase on 2017. However, earlier years showed sums of £1m-plus. I think the change to GTC’s business — whereby clients are no longer offered multi-year contracts — explains the generally lower levels of deferred income.
Maynard
Getech (GTC)
Trading update
Here is the full text interspersed with my comments.
————————————————————————————————————————————
Getech (AIM; GTC) provides geoscience and geospatial products and services to companies and governments who use them to de‐risk exploration programmes and improve their management of natural resources. The Group’s activities focus on a suite of data, knowledge and analytical products, the value of which are enhanced through services that leverage Getech’s products and technical skills.
The Company produces this trading update ahead of the publication of its interim results on or around 30 September 2019.
Operational update
Development of Globe remains on time and to cost ‐ Globe 2019 was released to customers at end‐July. In H1 2019 Getech completed the upgrade of its software products to ArcGIS Pro, added to its data holdings and began feasibility work on the potential to enhance MultiSat.
Gravity & Magnetic and Geospatial Service teams continued to be fully utilised and work to reposition Geoscience Services was rewarded with further governmental engagement and new contracts from customers expanding their investment in exploration.
Getech is exploring a range of organic and acquisitional opportunities to further enhance and extend its product and service offering.
H1 2019 ‐ revenue, sales, costs and cash
Revenue in H1 2019 is expected to total £2.5 million (H1 2018: £2.9 million). In addition, in H1 2019 Getech closed £1.6 million of new forward sales (H1 2018: £1.4 million). A significant portion will unwind to revenue in H2 2019.
* Lower H1 revenue in large part reflects a near‐term reduction in the size of the Geoscience Services team, a step taken in Q4 2018 to address the team’s loss-making position.
* Higher new forward sales of products and services grew Getech’s order book by £1 million (30 June 2019: £3.0 million; 30 June 2018: £2.0 million) and increased the level of annualised recurring revenue by £0.8 million (30 June 2019: £2.3 million; 30 June 2018: £1.5 million).
* The total value and diversity of data sales in H1 2019 rose year‐on‐year.
————————————————————————————————————————————
News of lower revenue is never great but at least the reduction concerned the loss-making Services division. The preceding full-year results had already mentioned divisional restructuring measures.
Closing £1.6m of new forward sales vs £1.4m for H1 2018 sounds promising. GTC also revealed two previously undisclosed numbers — i) order book and ii) annualised recurring revenue. The latter represented a not-insignificant 46% of H1 sales. Greater data sales is also encouraging.
————————————————————————————————————————————
Cost savings that resulted from the restructuring and relocation of Geoscience Services were partly used to expand investment across Getech’s workforce. Inclusive of this, the total cost base in H1 2019 is expected to have reduced by 10% to £3.2 million (H1 2018: £3.5 million).
Getech expects the net impact of the reduction in cost base and revenue to have a neutral impact on the Group’s profitability position when compared to H1 2018.
Capital discipline, and the settlement of receivables, increased cash to £3.0 million at 30 June 2019 (30 June 2018: £1.9 million; 31 Dec 2018: £1.4 million). Cash at 30 June 2018 included tax credits totalling £0.6 million. Receipt of tax credits in 2019 is due in H2 2019.
Overall, the Company continues to trade in line with current market expectations.
————————————————————————————————————————————
The 10% cost base reduction is welcome. Presumably revenue of £2.5m less a cost base of £3.2m led to a £0.7m loss for this half. (I do wish GTC would clarify its profit within these updates.)
GTC reported a £522k operating loss for H1 2018, so maybe there is some leeway in defining “neutral impact”.
No surprise the cash balance increased, given the last-gasp $3.2m data sale bagged at the end of the preceding financial year — and which had not been paid for at the year end.
GTC did not mention its debt — £0.9m at the preceding year end — or its Leeds office — still up for sale with a £2.4m book value.
At least the figures are in line with broker expectations — whatever they are.
————————————————————————————————————————————
Outlook
Getech is growing its baseline of recurring revenue by broadening its customer base and expanding its geographic reach. This has required focused new sales and marketing campaigns for software and Globe, whilst developing a range of opportunities in the markets of data, geospatial, geoscience and gravity and magnetic services. This investment has been rewarded with an expansion of the sales pipeline and new focus regions include Southeast Asia, Japan and UAE.
For Globe and software, Getech is working with a strong list of new customer trials. In data, with the bar set by a record sales performance in H2 2018, the Group is managing a portfolio of high‐value opportunities; key catalysts for which lie in H2 2019. In services, H1 2019 projects have entered H2 2019 with new phases of work and Getech continues to add new customers.
With global macroeconomic uncertainty driving crude price volatility, Getech’s oil and gas customers continue to carefully manage the release of their investment budgets. The Group’s focus therefore is to keep its tangible and growing sales pipeline in step with its customers’ key business requirements.
Jonathan Copus, Getech CEO, commented:
“We have reshaped Getech around a suite of high‐value products and skills. This is changing the mix and timing of our sales and revenues. In H1 2018 and H1 2019 a large proportion of new sales that we closed relate to forward contracts that secure revenue for future periods. Most of this revenue is also recurring in nature. Superimposed on this are steps that we are taking to strengthen our service offering, which in the near‐term prioritise profitability over top‐line growth. As a result, although H1 2019 revenue was lower than in H1 2018, new sales have strengthened Getech’s forward earnings path. By covering an ever‐larger portion of our costs with forward and recurring revenue, this means that event‐driven ‘spot’ sales, such as high‐value data, can be used to maximise profitability.”
————————————————————————————————————————————
Nothing much of concern or of particular insight here — the business continues to reposition itself under the relatively new chief exec.
As far as I can tell, for revenue and earnings to really take off, the oil price has to enter a bull phase to encourage more O&G clients to subscribe to GTC’s software to help them discover more oil.
Maynard