15 September 2015
By Maynard Paton
Quick update on City of London Investment (CLIG).
Event: Final results and annual report published 14 September.
Summary: No surprises here, as everything important was revealed within July’s summary figures. However, CLIG did confirm its funds under management had dropped by 17% during the recent market downturn and my sums are now starting to ask questions about the 24p per share dividend. All told, I do not feel comfortable with the current valuation and have therefore decided to reduce my holding.
Price: 330p
Shares in issue: 26,861,207
Market capitalisation: £88.6m
Click here for my previous CLIG posts
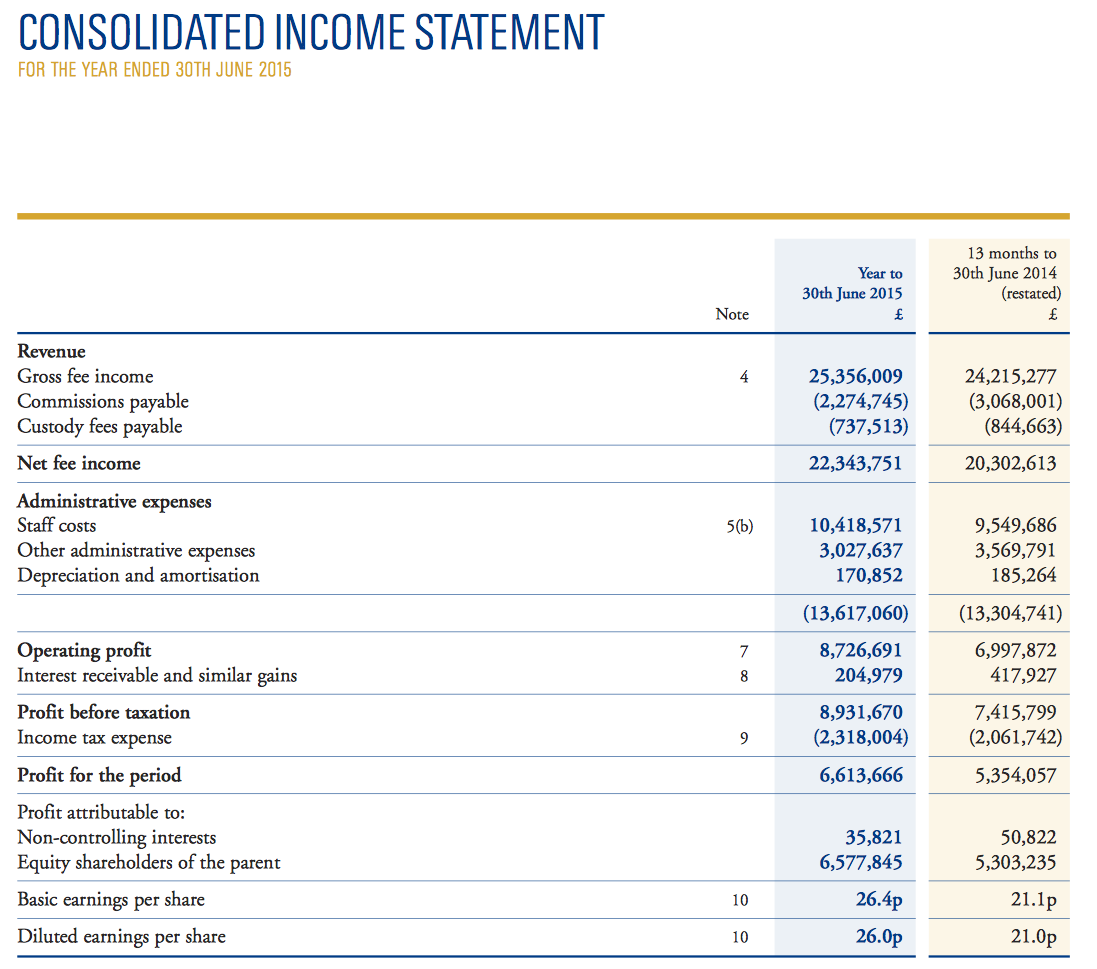
Results:
My thoughts:
* These figures were already flagged back in July
CLIG published a summary of these annual results two months ago, so there were no major surprises.
However, sharp-eyed investors may have noticed that some of the latest numbers differed slightly to those within the earlier summary. Earnings per share for example was reported as 26.1p during July but has since changed to 26.4p.
The adjustments concern the money CLIG has itself invested in some of its own funds. The annual gains (or losses) on these particular ‘in-house’ investments are now added (or subtracted) from overall profits, rather than accounted for purely through the balance sheet.
* £1m spent on buying shares for the employee share trust
I noted at the half-year stage that CLIG had spent £1m buying shares for its employee benefit trust (EBT).
Though no further sums were spent on the EBT during the second half, it is worth keeping an eye on this expenditure. Essentially the cash spent on EBT shares reflects the cost of the share options granted to staff. You see, when those options are exercised, the resultant shares are taken from the EBT to keep dilution to a minimum.
Anyway, during the last five years, some £3.6m has been pumped into the EBT — an average of more than £700k a year. In contrast, the share-based payment charge reported against earnings for 2015 was just £10k.
At least the EBT currently covers 94% of CLIG’s outstanding options, and those options not covered by the EBT represent only 0.4% of the total share count.
* No changes to the important charts and tables in the annual report
The 2015 annual report repeated all the important charts and tables that accompanied July’s statement.
As such, it seems CLIG’s funds are still outperforming, are still expected to garner an extra $500m of client money within the next twelve months, and are still projected to produce earnings of £7.3m for shareholders for 2016…
* Client funds have dropped 17% since the year end
The annual report — but not the accompanying results RNS — revealed that CLIG’s funds under management (FUM) had dropped considerably since the June year-end:
“It should be noted that FuM have fallen from US$4.2 billion at the point of putting together this Template, to US$3.5 billion at the time of writing. Whilst as a firm we are used to this level of volatility this has been all market related and caused by falls in the markets where clients are exposed rather than client redemptions.”
I had already noticed this FUM decline but I am pleased CLIG has claimed it has been “all market related”.
The annual report also disclosed CLIG’s top ten clients represent around 48% of total FUM, with the largest representing 13% and the second-largest at almost 9%. So there is a risk to profits here if just one or two major clients decide to jump ship.
Valuation
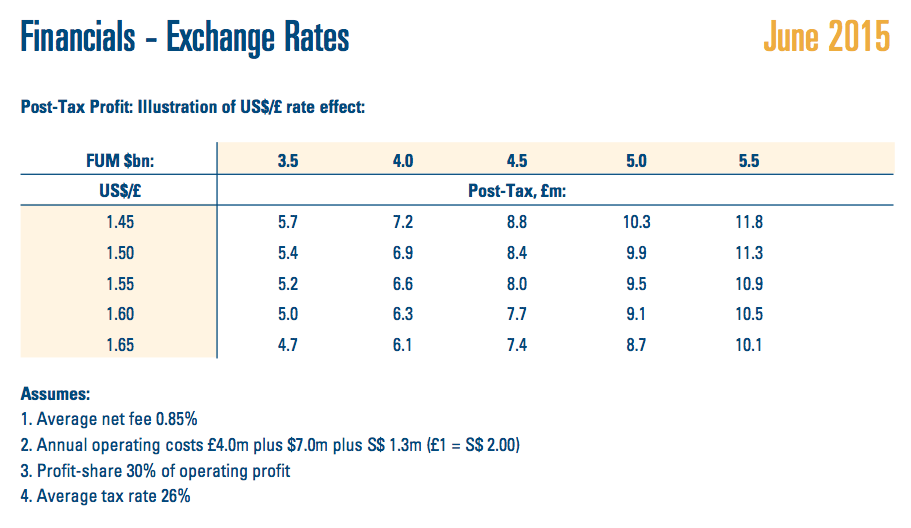
CLIG’s helpful exchange-rate/FUM table…
…indicates earnings could now be running at £5.2m — or 19.3p per share — with £1 buying $1.55 and FUM at $3.5bn.
That projection may well ask some questions of the 24p per share dividend, which has already been thinly covered by earnings — 1.0x, 0.9x and 1.1x — during the last three years.
Right now though, it seems to me the 330p share price may be expecting a prompt FUM recovery. I reckon the shares trade at 14-15 times my 19.3p per share earnings guess, based on an enterprise value of £79m or 292p per share (net cash is about £10m or 38p per share).
* I have decided to sell part of my holding
True, CLIG’s earnings may improve in time if markets pick up and new clients are found. Furthermore, the ending of a legacy marketing agreement could provide extra profits of up to £2m by 2020.
Nonetheless, the last time CLIG’s FUM dropped to $3.5bn (between mid 2013 to early 2014), the share price fell to as low as 215p.
Simply put, I just worry that FUM remaining depressed at about $3.5bn for a prolonged period could spark a repeat share-price downturn — which would thump my portfolio’s returns given CLIG was my second-largest investment at the end of Q2.
Indeed, a 215p share price and my 19p per share earnings guess equate to a P/E of 9-10, which could be seen as quite fair if FUM does remain depressed for some time.
As such, I took the decision earlier this month to sell about 40% of my CLIG shareholding at 335p.
Don’t get me wrong, CLIG retains many attractive features — not least its owner-friendly boss, appealing accounts and comprehensive updates for shareholders.
But I didn’t feel all that comfortable with the immediate downside possibilities — plus I wanted to have some extra on hand to bag potential bargains elsewhere.
* Next update — AGM and trading statement 19th October.
Maynard Paton
Disclosure: Maynard owns shares in City of London Investment.


CLIG:
Other points from the annual report:
1) Top marks to chief exec Barry Olliff for confirming his share-sale pledge:
He wrote:
Let’s hope the share price can reach £4.50 by 2020! He will turn 76 that year.
2) Shareholder disgruntlement at director pay
There were plenty of votes against the 2014 remuneration report and annual report:
It seems as if some investors wanted to make the pay policy more watertight, for example to describe the staff bonus pool as a maximum of 30% of profits. At least the voting was better than 2013, when an advisory vote went 73% against the firm following some rather large payoffs to ex-directors.
Anyway, the pay small-print is quite interesting and I see Mr Olliff is still entitled to 5% of pre-bonus pre-tax profits, while the other execs are entitled to 2.5% (all paid for by the wider 30% staff bonus pool). Mr Olliff is also entitled to 30 days holiday plus public holidays — and up to a six-week sabbatical with pay and benefits!
Here is the single-line director pay figures for 2014:
The annual report says Mr Olliff’s basic salary has not changed for the last ten years. It also claims his bonus represents 4.2% of pre-bonus, pre-tax profits — the same as 2014 and below the 5% entitlement. While I like the simplicity of CLIG’s bonus scheme, it does mean the execs and staff collect an incentive whether profits go up or down each year.
Maynard
Interesting to see CLIG classify decline since year-end as all market related – they underperformed the MSCI EM Index for the June to August period by nearly 100bp after outperforming for most of the last year.
CLIG:
Trading Update — Q1 Funds Under Management:
http://www.investegate.co.uk/city-of-lon-inv-grp–clig-/rns/interim-management-statement/201510080700075957B/
“City of London (LSE: CLIG), a leading emerging markets asset management group, announces that as at 30th September 2015, FuM were US$3.6 billion (£2.4 billion). This compares with US$4.2 billion (£2.7 billion) at the Company’s year-end on 30th June 2015. In US dollar terms, this represents a fall of c14% compared to the MSCI Emerging Markets Index (US dollar based), which fell by c18% over the same period.
Despite the recent market volatility, the Board is encouraged by the diversity in the current pipeline of potential mandates, with c$750 million spread across EM, Frontier, Developed and Tactical Asset Allocation asset classes. As a result the Company is hopeful that at least a net $250 million of additional FuM should be achievable over the next 6-9 months.”
No major surprise FUM is at $3.6bn given it was at $3.5bn when the 2015 annual report was published just a few weeks ago.
CLIG’s helpful exchange-rate/FUM table referred to in the Blog post above indicates FUM of $3.6bn combined with a £1:$1.52 exchange rate would give earnings of £5.63m or 21.0p per share.
I reckon the 330p shares trade at 14 times my 21.0p per share earnings guess, based on an enterprise value of £79m or 292p per share (net cash is about £10m or 38p per share).
Plus, it seems like the 24p per share dividend could be uncovered during the current year as well.
CLIG’s aim of garnering an extra $500m of client FUM during the current year (to June 2016) looks a bit ambitious now. Today the group said it was hopeful of bagging “at least” an extra $250m of extra FUM within the next 6-9 months (i.e. to March-June 2016).
As before, my valuation sums do not factor in any additional FUM that CLIG may forecast.
“Operations
The Group’s income currently accrues at a weighted average rate of approximately 85 basis points, net of third party commissions. “Fixed” costs for the quarter were a little over £0.8 million per month, and accordingly the current run-rate for operating profit, before profit-share at 30%, is approximately £0.8 million per month based upon current FuM and a US$/£ exchange rate of US$1.52 to £1. The Group estimates that the post-tax profit for the first three months of the year will be approximately £1.2 million, after an unrealised loss on seed investments of £0.2 million.
Appropriate steps are being taken to reduce the firm’s overhead.
Having provided shareholders with both a template and assumptions via which they can determine their own estimate of CLIG’s profitability, shareholders can accordingly adjust their estimates based on the recent fall in markets.”
I am glad CLIG is taking steps to reduce its overheads. Post-tax profit of £1.4m for Q1 indicates £5.6m for the full year, which matches the £5.63m figure I calculated above.
Maynard
City of London Investment (CLIG)
AGM Trading Update:
http://www.investegate.co.uk/city-of-lon-inv-grp–clig-/rns/agm-trading-update/201510190700056004C/
“Funds under management (FuM) as at 15th October 2015 were US$3.93 billion (£2.5 billion). This compares with US$3.6 billion (£2.4 billion) at the Company’s quarter-end on 30th September 2015. In US dollar terms, this represents a rise of c9% which is in line with the rise in the MSCI Emerging Markets Index (US dollar based), over the same period.”
Nice to see FUM rebounding with the wider market.
CLIG’s helpful exchange-rate/FUM table referred to in the Blog post above indicates FUM of $3.93bn combined with a £1:$1.55 exchange rate would give earnings of £6.42m or 23.6p per share.
As such, I reckon the 315p shares now trade at almost 12 times my 23.6p per share earnings guess, based on an enterprise value of £75m or 277p per share (net cash is about £10m or 38p per share).
Maynard
City of London Investment (CLIG)
Funds Under Management update:
http://www.citlon.co.uk/shareholders/announcements.php
FUM has decreased with emerging markets in general.
Squinting at the chart, I’m guessing CLIG’s FUM at the end of November 2015 was about $3.85bn. For what it is worth, the group’s MSCI benchmark index (http://markets.ft.com/research/markets/tearsheets/summary?s=MIEF00000PUS:MSI) dropped 3% in November and is almost 17% lower than it was this time last year:
CLIG’s helpful exchange-rate/FUM table referred to in the Blog post above indicates FUM of $3.85bn combined with a £1:$1.50 exchange rate would give earnings of £6.48m or 24.1p per share.
As such, I reckon the 335p shares now trade at around 12 times my 24.1p per share earnings guess, based on an enterprise value of £80m or 297p per share (net cash is about £10m or 38p per share).
Maynard