19 November 2019
By Maynard Paton
Results summary for S & U (SUS):
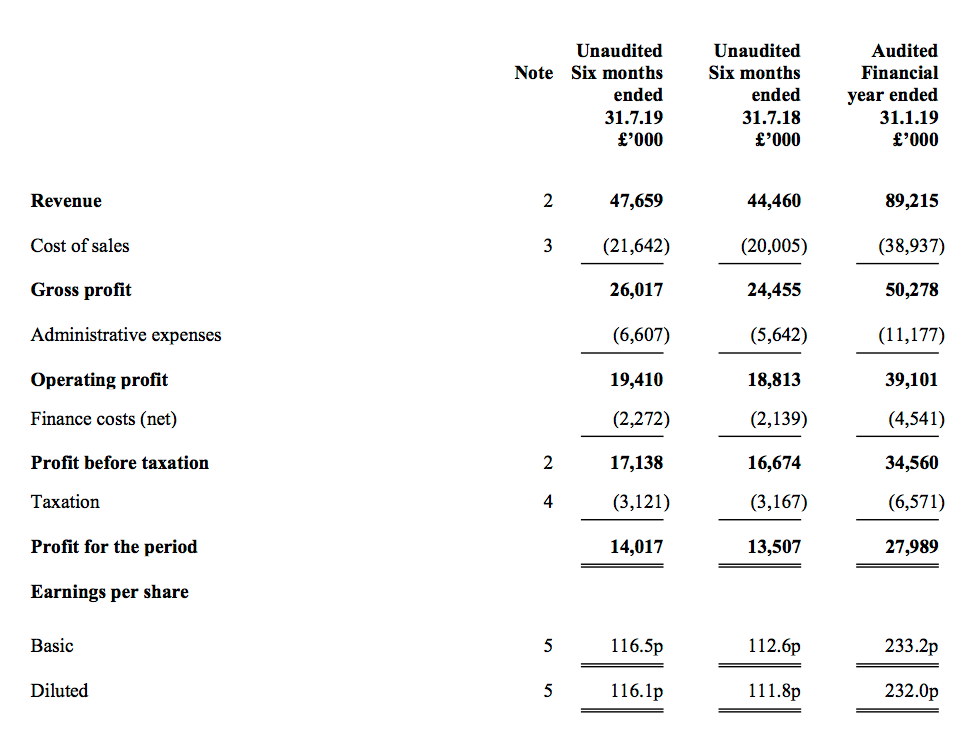
- Record first-half figures that showed revenue up 7%, operating profit up 3% and the dividend up 6%.
- Bad debts within the Advantage car-loan division have started to subside following 18 months of sharp increases.
- Management remains upbeat as loan applications continue to flood in, and has appointed an industry ‘heavyweight’ as the new Advantage MD.
- Progress at Aspen Bridging was “slightly short of expectations” but the division’s long-term potential could be considerable.
- Possible P/E of 11 and yield of 5.8% do not appear expensive if indeed the business can enjoy “a resumption of [its] usual rates of growth”. I continue to hold.
Contents
- Event link and share data
- Why I own SUS
- Results summary
- Revenue, profit and dividend
- Advantage Finance
- New Advantage managing director
- Aspen Bridging
- Financials
- Valuation
Event link and share data
Event: Interim results and presentation for the six months to 31 July 2019 published 24 September 2019
Price: 2,060p
Shares in issue: 12,080,093
Market capitalisation: £249m
Why I own SUS
- Provides ‘non-prime’ credit to car buyers and property developers, where disciplined lending and reliable service have supported an enviable track record.
- Boasts veteran family management with 40-year-plus tenure, 50%-plus/£124m-plus shareholding and a “steady, sustainable” and organic approach to long-term growth.
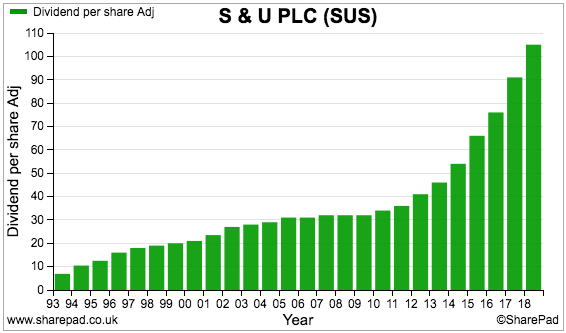
- Illustrious dividend has not been cut since at least 1987 and presently supports a near 6% income.
Further reading: My SUS Buy report |All my SUS posts | SUS website
Results summary
Revenue, profit and dividend
- Trading statements issued during May and August had already hinted these first-half results would show acceptable progress.
- The May update was particularly important because it revealed bad loans had started to recede.
- SUS has suffered from rising loan ‘impairments’ since the second half of 2018 and throughout 2019.
- The statement revealed revenue up 7%, operating profit up 3% and the dividend up 6%:
| H1 2018 | H2 2018 | H1 2019 | H2 2019 | H1 2020 | |||
| Revenue (£k) | 37,556 | 42,225 | 44,460 | 44,755 | 47,659 | ||
| Operating profit (£k) | 15,427 | 17,551 | 18,813 | 20,288 | 19,410 |
- Revenue, profit and the dividend all reached new first-half highs.
- The results extended SUS’s run of impressive growth following the sale of the group’s home-credit business during 2015.
- Advantage Finance, SUS’s car-loan division, reported profit up 2% after customer numbers increased by 7%.
- However, Advantage’s H1 profit was below that reported for H2 2019 — the first time for at least five years that Advantage’s H1 profit did not surpass the preceding H2:
| H1 2018 | H2 2018 | H1 2019 | H2 2019 | H1 2020 | |||
| Motor | |||||||
| Revenue (£k) | 37,470 | 41,412 | 43,270 | 43,102 | 45,586 | ||
| Pre-tax profit (£k) | 14,417 | 15,794 | 16,306 | 17,334 | 16,622 | ||
| Property | |||||||
| Revenue (£k) | 86 | 813 | 1,190 | 1,653 | 2,073 | ||
| Pre-tax profit (£k) | (280) | (18) | 279 | 559 | 502 |
- Aspen Bridging, SUS’s fledgling property-loan division, maintained its profitability although progress was “slightly short of expectations”.
- Management appeared confident that trading could improve.
- Upbeat remarks included:
- “every confidence for a resumption of usual rates of growth, whatever the outcome of the current maelstrom in Westminster”;
- “…provide a solid platform for the resumption of recent levels of growth”, and;
- “the prospects for continued sustainable growth… are still more encouraging than they were a year ago.”

Advantage Finance
- The typical Advantage Finance customer has a patchy-but-improving credit history and borrows £6.4k to buy a five-year-old used car.
- The customer then pays back £11.5k over 51 months — equivalent to a flat c18% interest rate.
- Customers are described by management as ‘non-prime’ — “borrowers that have had a problem in the past but are on an upward trend” (point 3).
- Following underwriting tweaks and “sensible gear changes”, Advantage witnessed a “gradual but discernible improvement in debt quality” during this H1.
- Bad debts within Advantage have actually subsided (albeit slightly):
| H1 2018 | H2 2018 | H1 2019 | H2 2019 | H1 2020 | |||
| Motor | |||||||
| Loan provision (£k) | 8,573 | 10,843 | 11,320 | 11,660 | 11,075 | ||
| Revenue (£k) | 37,470 | 41,412 | 43,270 | 43,102 | 45,586 | ||
| Average customer loans (£k) | 210,168 | 239,011 | 257,335 | 261,113 | 266,291 | ||
| Loan provision/Revenue (%) | 22.9 | 26.2 | 26.2 | 27.1 | 24.3 | ||
| Loan provision/Average customer loans (%) | 8.2 | 9.1 | 8.8 | 8.9 | 8.3 | ||
| Revenue/Average customer loans (%) | 35.7 | 34.7 | 33.6 | 33.0 | 34.2 | ||
| 'Risk-adjusted yield' (%) | 27.5 | 25.6 | 24.8 | 24.1 | 25.9 |
- The division’s £11.1m ‘loan provision’ was below that recorded for both H1 and H2 of 2019.
- Furthermore, the division’s loan provision as a proportion of divisional revenue (24.3%) and as a proportion of average outstanding divisional customer loans (8.3%) was the lowest for 18 months.
- Advantage’s ‘risk-adjusted yield’ advanced to 25.9% — the highest for 18 months.
Note: risk-adjusted yield is a ‘profit margin’ KPI used by SUS and is
calculated as: (revenue - loan provision) / average outstanding customer loans
- However, Advantage has some way to go to revert to the low impairment levels of a few years ago.
- For example, the risk-adjusted yield (red line below) topped 30% during the ‘boom’ years of 2013, 2014 and 2015:
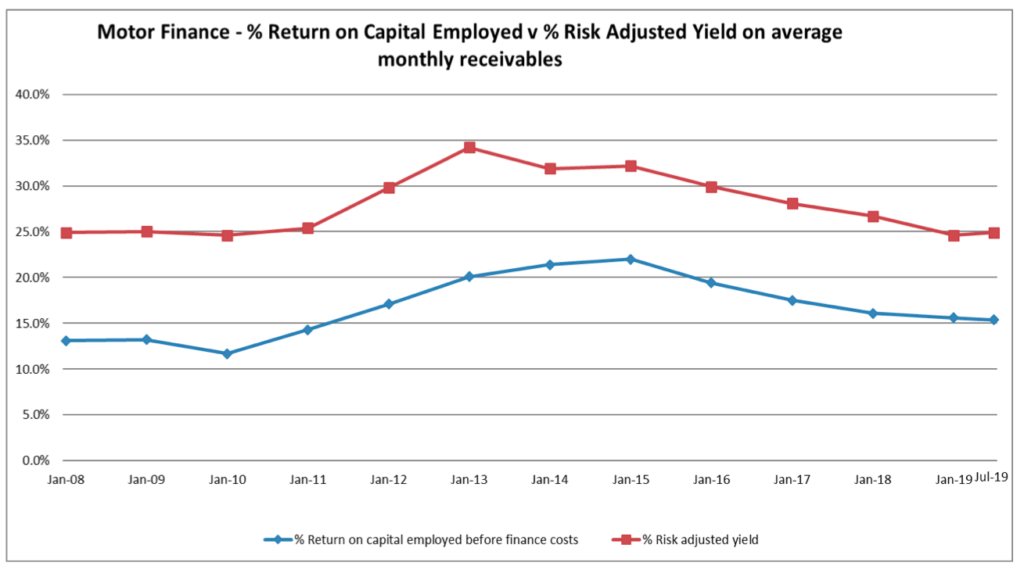
- Perhaps those boom years should be seen as unusually favourable rather than as a period that could be revisited easily.
- The results powerpoint also showed a higher proportion of accounts not in arrears — 81% versus 80% for 2019:
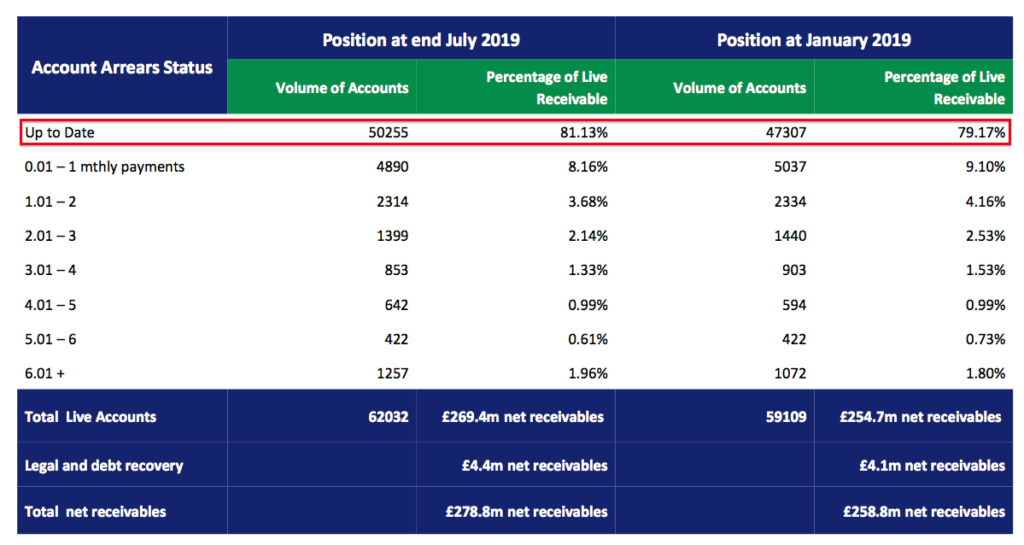
- However, the percentage exceeded 90% a few years ago:
| 2016 | 2017 | 2018 | 2019 | H1 2020 | |
| Motor | |||||
| Up to date accounts | 29,460 | 37,447 | 45,668 | 47,307 | 50,255 |
| Overdue accounts | 3,144 | 5,620 | 8,811 | 11,802 | 11,777 |
| Total accounts | 32,604 | 43,067 | 54,479 | 59,109 | 62,032 |
| Up to date/Total (%) | 90.4 | 87.0 | 83.8 | 80.0 | 81.0 |
| Overdue/Total (%) | 9.6 | 13.0 | 16.2 | 20.0 | 19.0 |
- More hope of bad debts remaining lower comes from the proportion of car-loan accounts making their first payment.
- The first-payment ratio (blue line, left axis) has improved from 95.5% to 97.25% since October 2017:
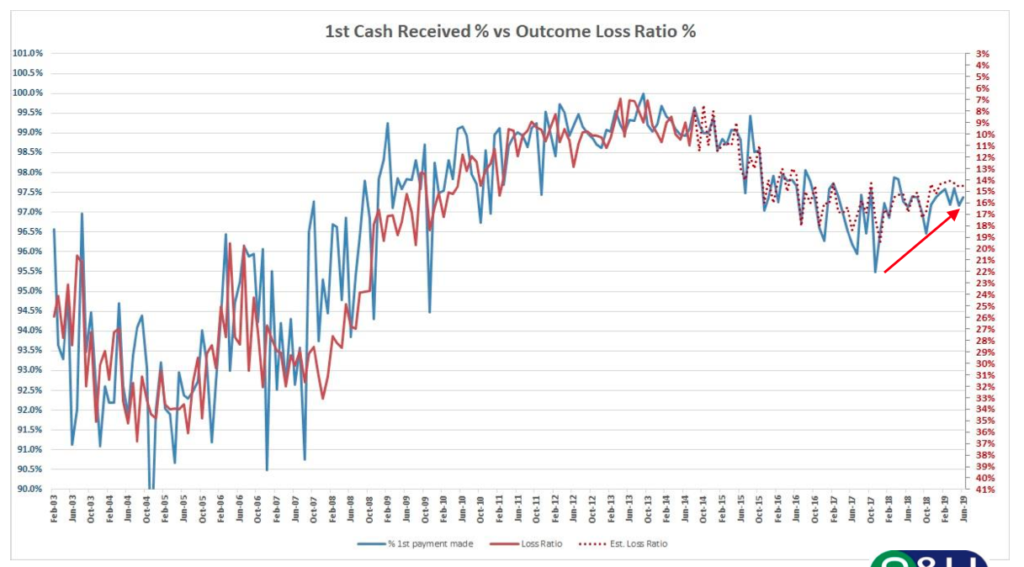
- SUS believes this first-payment improvement should lead to lower future write-offs (dotted red line, right axis).
- The tighter underwriting has meant the proportion of car-loan applicants that receive an approval has been trimmed by a percentage point to 22%:
| 2017 | 2018 | H1 2019 | H2 2019 | H1 2020 | |||
| Motor | |||||||
| Applications | over 750,000 | over 860,00 | over 510,000 | over 490,000 | over 680,000 | ||
| Approvals (%) | c32% | c29% | c23% | c23% | c22% | ||
| Approvals | c240,000 | c250,000 | c117,000 | c113,000 | c150,000 | ||
| Loans issued | 20,042 | 24,518 | 11,822 | 9,231 | 12,065 | ||
| Loans issued/Approvals (%) | 8.4 | 9.8 | 10.1 | 8.2 | 8.1 |
- Applications for car loans continue to flood in. More than 680,000 were received during this H1 — up 33%.
- Note that only 8% of approved applicants go on to collect their new loan.
- Management comments at a presentation in May (point 3) gave three reasons why 92% of approved customers did not collect their loan:
- The customer decided not to buy a car;
- The chosen car was not acceptable to Advantage (e.g. too old, too high a mileage etc), and;
- A cheaper loan was found elsewhere.
- Management reckoned the third reason was the most common — but hinted the cheaper lender was likely to lose money on such deals.
- The 8% take-up suggests Advantage has the best rates for only a small proportion of potential borrowers.
- Despite the tighter underwriting, the 33% increase to applications has meant the rate of new loan agreements has reverted back to c12k every six months:
| H1 2018 | H2 2018 | H1 2019 | H2 2019 | H1 2020 | |||
| Motor | |||||||
| New agreements | 12,542 | 11,976 | 11,822 | 9,231 | 12,065 | ||
| Active customers | 49,000* | 54,479 | 58,008 | 59,109 | 62,032 | ||
| Net customer increase | 5,933 | 5,479 | 3,529 | 1,101 | 2,923 | ||
| Customer loans (£k) | 226,807 | 251,215 | 263,455 | 258,810 | 273,771 | ||
| Change to customer loans (£k) | 33,278 | 24,408 | 12,240 | (4,645) | 14,961 |
(*rounded by SUS)
- SUS does not disclose the number of car-loan customers lost every year due to non-payment or full repayment.
- However, my sums suggest the net increase to car-loan customers had been running at somewhere between 5k and 6k every six months during 2018.
- Then during 2019, the net increase to car-loan customers fell to 3.5k during the first half and then to just 1k during the second (at least according to my sums).
- This H1 saw the net increase rebound to nearly 3k.
- Total outstanding car loans (less impairments) advanced by £15m to £274m during the six months.
- One downside from the improved credit quality is the greater commission paid to the intermediary brokers.
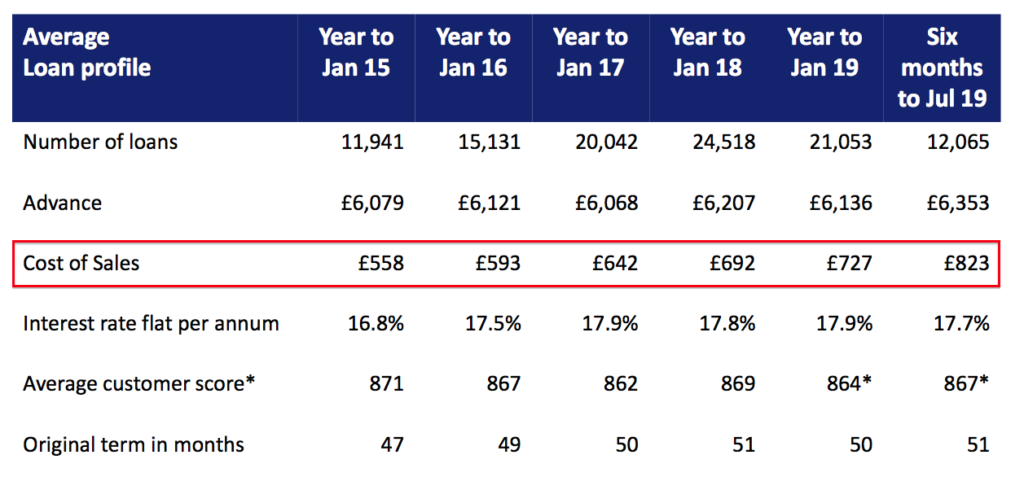
- Advantage’s ‘cost of sales’ has jumped to £823 per loan, from £727 last year and £558 back in 2015.
Enjoy my blog posts through an occasional email newsletter. Click here for details.
New Advantage managing director
- Advantage was established during 1999 and managing director Guy Thompson has overseen the subsidiary’s 20-year history of consistent profit growth.
- The 2018 annual report (point 6) revealed what I thought was “a lucrative ‘shadow share-option’ carrot to defer [Mr Thompson’s] retirement for a few years”.
- Sure enough, Mr Thompson has decided to retire.
- Management announced: “There is, however, a tide in the affairs of man which means that Guy will retire next year. His will be a hard act to follow, but in Graham Wheeler we believe we have found a worthy successor as CEO of Advantage.”
- SUS issued the following bio for Mr Wheeler:
“Graham has dedicated his working life to the UK motor finance industry. He began his career with GMAC and was part of the original team at GE Capital Motor Finance in 1990. Joining Volkswagen Financial Services (“VWFS”) as an Area Manager in 1995, Graham rose to be CEO of VWFS UK, transforming it into Britain’s largest car finance business with a combined asset base of £13bn and over one million customers.”
“Graham later became Jaguar Land Rover’s Director for Global Financial Services and then developed a digital car financing business for Shawbrook Bank. In 2018 he was inducted into the International Asset Finance Network Hall of Fame”
- Mr Wheeler’s record at Volkswagen Financial Services UK appears impressive.
- Between Mr Wheeler’s appointment as a director in 2004 and departure in 2016:
- The proportion of VW cars bought using VW finance climbed from 12% to 47%;
- The number of loans issued climbed from 75k to 328k a year;
- The amount of money loaned climbed from £869m to £6,181m a year, and;
- Annual pre-tax profit climbed from £26m to £172m.
- The Volkswagen Financial Services UK annual reports are available at Companies House.
- Interimpartners.com has published a short interview with Mr Wheeler.
- Mr Wheeler gave this presentation about Volkswagen UK’s lending business a few years ago.
- Mr Wheeler appears to be a ‘heavyweight’ industry appointment — although whether the lending culture at Advantage mirrors that at Volkswagen UK remains to be seen.
- Management said at the May presentation that Advantage “sells to people, not algorithms”. I trust Mr Wheeler can continue the same approach.
- Let’s hope Mr Wheeler does not attempt to introduce personal contract plans (PCPs) — a car-loan product that has been investigated by the financial regulator, but not something ever offered by Advantage.
- Mr Wheeler likes concerts, Rangers FC and his daughter’s books.
Aspen Bridging
- Established almost three years ago, Aspen offers property bridging loans aimed at small/sole trader property developers/investors with awkward financial circumstances.
- According to SUS, the average bridging loan is c£400k with a monthly interest rate of “just over” 1% and a term of between 6 and 14 months. These case studies give a flavour of the borrowers involved.
- According to this interview with Aspen director Jack Coombs, the average loan might actually be £900k.
- According to Aspen’s website, a winter special offer allows customers to borrow at approximately 0.5% a month for the first half of their loan term, before reverting to 1.25% a month.

- Aspen’s revenue and profit grew approximately 75% from the comparable H1 2019 performance:
| H1 2018 | H2 2018 | H1 2019 | H2 2019 | H1 2020 | |||
| Revenue (£k) | 86 | 813 | 1,190 | 1,653 | 2,073 | ||
| Pre-tax profit (£k) | (280) | (18) | 279 | 559 | 502 |
- The growth was driven by total outstanding bridging loans (less impairments) advancing by £9m to £25m during the previous twelve months.
- However, management confessed “competition and a prudent approach to valuation” had led to transaction volumes being “slightly short of expectations”.
- The division had only 64 outstanding loans at the half year, of which nine involved slower-than-expected “borrower exits” (i.e. tardy payers).
- Aspen has issued 137 loans to date and — impressively — only one has concluded at a loss.
- Aspen’s £318k ‘loan provision’ was triple that recorded for H1 2019.
| H1 2018 | H2 2018 | H1 2019 | H2 2019 | H1 2020 | |||
| Property | |||||||
| Loan provision (£k) | 19 | 143 | 98 | 108 | 318 | ||
| Revenue (£k) | 86 | 813 | 1,190 | 1,653 | 2,073 | ||
| Average customer loans (£k) | 899 | 6,320 | 13,584 | 17,290 | 21,472 | ||
| Loan provision/Revenue (%) | 22.1 | 17.6 | 8.2 | 6.5 | 15.3 | ||
| Loan provision/Average customer loans (%) | 4.2 | 4.5 | 1.4 | 1.2 | 3.0 | ||
| Revenue/Average customer loans (%) | 19.1 | 25.7 | 17.5 | 19.1 | 19.3 | ||
| 'Risk-adjusted yield' (%)* | 14.9 | 21.2 | 16.1 | 17.9 | 16.3 |
- The increased provision for possible bad debts represented 15.3% of revenue — versus c7-8% during 2019.
- Greater revenue (i.e. interest) earned from bridging loans appeared to counterbalance the higher loan provision.
- Revenue represented 19.3% of average bridging loans outstanding during the half, versus 17.5% for H1 2019.
- The (apparent) higher rate of interest paid by Aspen’s borrowers meant the division’s ‘risk-adjusted yield’ of 16.3% broadly matched that reported for 2019.
- Earlier this year, management anticipated “controlled revenue growth at Aspen of at least 50% per year over the next two years.”
- But the 50% projection was not repeated this time.
- Management nevertheless remained bullish on Aspen’s near-term future: “The current pipeline augurs a good second half, and a significant contribution by Aspen to Group profits in the next two years.”
- Management has not specified how significant a “significant contribution… to Group profits” could actually be.
- For this H1, Aspen contributed 3% of group profit.
- Assume 10% of group profit, and Aspen would have to contribute £3.8m given pre-tax profit from Advantage currently runs at £34m a year.
- The hope — which may be wildly optimistic — is that Aspen becomes another Advantage, and goes from start-up to a £34m annual profit within 20 years.
Financials
- The 2019 annual report (point 11) shows SUS borrows money from mainstream banks at 4% to then lend out at 30%.
- The wide net interest margin is needed to cover debt impairments and operating costs.
- A 41% operating margin for this H1 compares to 42%, 41% and 44% for H1s 2019, 2018 and 2017 respectively.
- SUS requires a high level of profit to generate a respectable return on the capital that supports the business.
- My year-end 2019 sums indicated SUS enjoyed a return on capital (equity plus debt) of approximately 12% after tax.
- SUS calculates the return on capital employed (ROCE) within Advantage to be 15% before tax (blue line):

- SUS’s net debt stands at £125m, just £4m higher than at this point last year.
- The modest increase to borrowings reflects cash flow during H2 2019, when Advantage’s application criteria were tightened and more loans were repaid than issued. Operating cash flow during H2 2019 was a positive £17m:
| H1 2018 | H2 2018 | H1 2019 | H2 2019 | H1 2020 | |||
| Operating profit (£k) | 15,427 | 17,551 | 18,813 | 20,288 | 19,410 | ||
| Working-capital movement (£k) | (34,725) | (34,156) | (21,056) | 2,015 | (20,717) | ||
| Other cash-flow movements (£k) | (3,373) | (4,142) | (4,649) | (4,881) | (5,234) | ||
| Operating cash flow (£k) | (22,671) | (20,747) | (6,892) | 17,422 | (6,541) |
- In contrast, this H1 witnessed operating cash flow of negative £7m after an extra £21m was absorbed into working capital (to fund new customer loans).
- Interest payments of £2.3m were covered a respectable 8-9x by operating profit during the six months.
- SUS maintains a tiny defined-benefit pension scheme that last carried a surplus.

Valuation
- SUS ended the half with total outstanding customer loans of £298m.
- During the preceding twelve months, SUS earned revenue equivalent to 32.0% of outstanding customer loans.
- Multiply £298m by 32.0% gives possible revenue of £95m for the next twelve months.
- During the preceding twelve months, SUS also recorded:
- A bad-debt impairment provision equivalent to 25.1% of revenue;
- Other cost of sales equivalent to 18.8% of revenue, and;
- Administrative expenses equivalent to 13.1% of revenue.
- Potential revenue of £89m less those percentage charges would leave a potential £41m operating profit.
- Applying the 18% tax used in these results to a potential £41m operating profit delivers possible earnings of £34m or 278p per share.
- Adding the £125m debt to the current £249m market cap gives an enterprise value (EV) of £374m or £31 per share
- Dividing the £31 EV per share by my 278p EPS guess leads to a multiple of 11.1x.
- The 120p per share trailing dividend supports an appealing 5.8% income.
- I doubled my SUS holding during April at £19 when my sums showed a P/E of less than 11 and a yield greater than 6%.
Maynard Paton
PS: You can receive my blog posts through an occasional email newsletter. Click here for details.
Disclosure: Maynard owns shares in S & U.

I notice you haven’t mentioned the FCA investigation into car finance commissions. Is this a business risk here?
Hello John
Thanks for the question.
The 2019 annual results statement said (my bold):
“Although coming after the year end, of great interest, was March’s report from the Financial Conduct Authority (“FCA) on the motor finance industry. As we made plain post publication, the report contained no surprises and a great deal of comfort for firms like Advantage. The report focused on three areas. On commissions, it recognised that the flat fee basis used by Advantage minimised risk for customers. Second, its recommended separation of credit scoring and customer affordability assessment is a practice long used at Advantage. Third, it emphasised the value of transparent and plain communication with customers prior to transactions, and of ensuring that brokers and introducers did the same.
As I anticipated last year, Advantage’s excellent record on customer relations, its continued investment in compliance and under-writing – (the latter has seen an updated scorecard and automated affordability calculations) – and long experience allow us to give the FCA report a genuine welcome.”
The FCA investigation does not therefore appear to be a business risk.
Maynard
S & U (SUS)
Trading statement
Here is the full text from the December statement:
——————————————————————————————————————————-
S&U plc, the specialist motor finance and bridging lender, announces its trading update for the period from the 1 August to 9 December 2019. Trading remains in line with our expectations, despite generally weaker consumer sentiment and a slowing economy. S&U continues to maintain its historical resilience and confidence in future performance.
Motor Finance
The used car finance market in which Advantage Finance (“Advantage”), S&U’s motor finance subsidiary, operates is proving robust. The Finance and Leasing Association reports the volume of used car finance agreements in the 12 months to September 2019 was up 2% year on year.
New business at Advantage has benefitted from planned additional investment in cost of sales since the start of this financial year. Advantage new deal advances are up 11% at over £127m to date this year. Advantage now has a record 63,500 customers (31 July 19: 62,000), and over £280m of net receivables (31 July 19: £273.8m).
In addition to the rise in new business, there has been a gradual increase in book quality. Rolling 12-month risk adjusted yield is now around 25.2% of average monthly receivables (July 19: 24.9%). This recent improvement in risk adjusted yield in the period was slightly lower than anticipated due to some additional impairment charges from legacy quality issues and lower used car auction values for our recovered vehicles this year. Overall year to date monthly collections are up 7% on last year on 5% higher receivables.
Advantage’s success has always been underpinned by our investment in analytics and information technology. In addition to the continuous refinement of our underwriting, which has helped improve new loan quality, this period has seen closer integration of CRM systems with our broker partners as well as significant enhancements to Advantage’s website.
Finally, we are delighted to welcome Graham Wheeler as our new Chief Executive at Advantage. He takes over from the distinguished founding Managing Director, Guy Thompson, who as part of his planned transition to retirement, will be happily available for advice and encouragement in the months ahead.
We therefore remain confident that, despite the somewhat downbeat prognosis for British consumer spending, Advantage will be able to continue the profitable growth which has been its hallmark for over 20 years.
Property bridging finance
Aspen Bridging, our property lending business, is not immune from the prevailing uncertainty and low level of activity it produces in the residential property market. Some borrower exits are still slower than anticipated, due mainly to these subdued property market conditions. Nevertheless, sensible profitable growth continues as the loan book of net receivables now reaches £28 million, against £18m a year ago.
Funding
S&U’s conservative treasury policy and medium-term bank facilities of £160m leave significant headroom above current borrowing of £132m for anticipated growth.
Commenting on the Group’s performance and outlook, Anthony Coombs, S&U Chairman, said:
“Political vacillation in the UK and slowing economic growth have inevitably been reflected in the motor and property markets in which S&U operates. The country now faces an almost existential choice at the General Election. Whatever the outcome of the current political situation, we expect S&U to continue to exhibit its customary resilience, stability and sensible ambition to the benefit of our shareholders.”
——————————————————————————————————————————-
Seems reasonably positive to me, with the risk-adjusted yield improving a fraction (the higher the risk-adjusted yield, the greater the return after loan impairments). The statement also hinted that auction car values can influence SUS’s returns. Mentioned, too, was IT — which management has said gives SUS a decent advantage through various in-house algorithms. I will await the next results to fine-tune my valuation sums.
Maynard