18 January 2019
By Maynard Paton
Results verdict on City of London Investment (CLIG):
- Monthly updates had already braced shareholders for lower funds under management — which in turn reduced first-half profit by 21%.
- Tough markets have again prompted the fund manager to cut its projections, as fee rates are trimmed and costs creep higher.
- As before, significant new clients are required to bolster earnings and support a decisive share-price re-rating.
- I am hopeful the replacement chief executive might one day re-energise the group’s marketing.
- The accounts remain cash-rich and high-margin, and the shares yield 7.5%. I continue to hold.
Contents
- Event, share data and links
- Results summary
- Revenue and profit
- Funds under management
- FUM performance against benchmarks
- New clients and additional FUM
- Dividend-cover template
- Revised company projections
- Management fees
- Margin, balance sheet and cash flow
- Valuation
Event, share data and links
Event: Trading update and shareholder presentation/summary results for the six months ending 31 December 2018 published 16 January 2019
Share price: 360p
Shares in issue: 25,142,517
Market capitalisation: £96m
Further reading: My CLIG Buy report | All my CLIG posts
Results summary
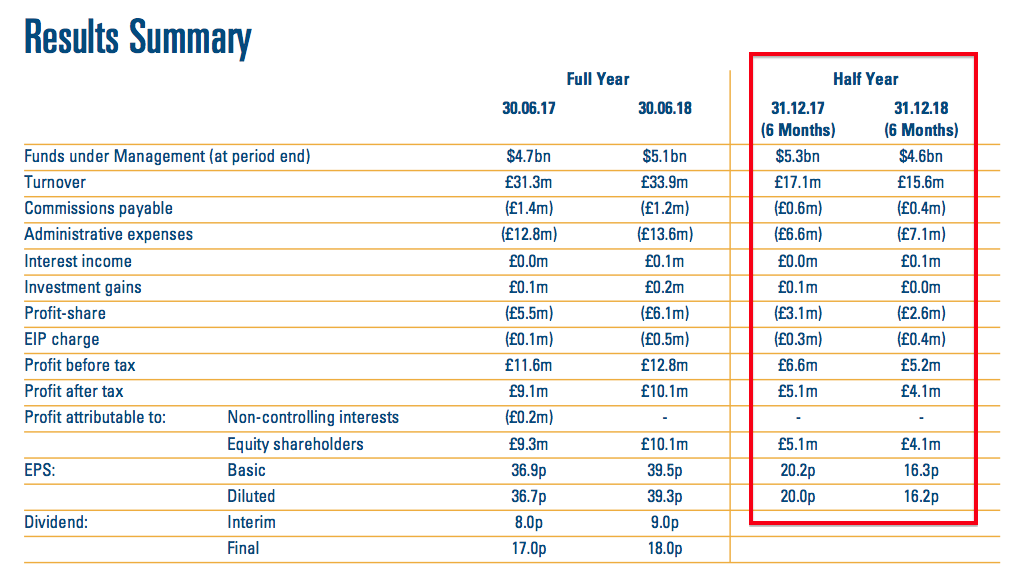
CLIG took just ten working days to construct these summary interim accounts. I wish all quoted companies could be as timely when presenting their financials.
Note that CLIG’s RNS did not reveal all of the numbers. The group’s website published a City presentation, which included some detailed figures as well as various charts and other stats.
Revenue and profit
CLIG’s first-quarter statement and subsequent website updates for October, November and December had already signalled these figures would not be fantastic.
In the event, the presentation confirmed funds under management (FUM) at the end of December had declined $482m, or 9%, to $4,625m since the June year-end. The FUM drop was split $99m during Q1 and $383m during Q2.
Half-year revenue fell 9% and in turn thumped pre-tax profit by 21%. Administrative expenses (which are mostly employee costs) increased by £0.4m and amplified the profit shortfall.
Earnings came in at 16.3p per share, which annualised would give 32.6p per share. My valuation sums (see later) indicate earnings could now be running at approximately 29p per share.
Funds under management
The RNS revealed the following FUM movements:
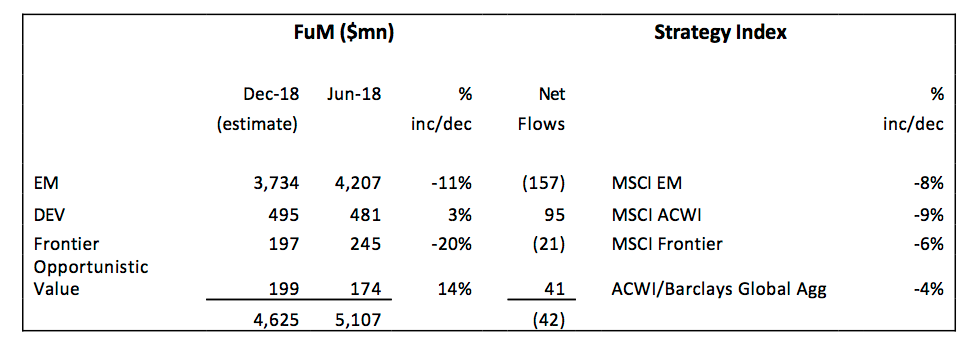
Of the aforementioned $482m FUM decline, a net $42m was due to client withdrawals.
I have created three tables to show CLIG’s FUM movements in greater detail.
The first table summarises the total quarterly movements for each of CLIG’s four investing themes:
| Movement total | Start value | Mar 2018 | Jun 2018 | Sep 2018 | Dec 2018 | End value |
| EM ($m) | 4,660 | (26) | (427) | (191) | (282) | 3,734 |
| DEV ($m) | 337 | 96 | 48 | 96 | (82) | 495 |
| OV ($m) | 139 | 11 | 24 | 26 | (1) | 199 |
| Frontier ($m) | 193 | 9 | 43 | (30) | (18) | 197 |
| Non-EM total ($m) | 669 | 116 | 115 | 92 | (101) | 891 |
| Total ($m) | 5,329 | 90 | (312) | (99) | (383) | 4,625 |
(EM=Emerging Markets, DEV=Developed Markets, OV=Opportunistic Value)
The Emerging Market division has consistently lost FUM during the last four quarters.
This next table shows the effect of client contributions and withdrawals to FUM during the same twelve-month period:
| Client flows | Mar 2018 | Jun 2018 | Sep 2018 | Dec 2018 |
| EM ($m) | (38) | (88) | (95) | (62) |
| DEV ($m) | 102 | 48 | 98 | (3) |
| OV ($m) | 13 | 21 | (21) | 62 |
| Frontier ($m) | 0 | 65 | 26 | (47) |
| Non-EM total ($m) | 115 | 134 | 103 | 12 |
| Total ($m) | 77 | 46 | 8 | (50) |
(EM=Emerging Markets, DEV=Developed Markets, OV=Opportunistic Value)
Money continues to trickle out of Emerging Markets, and continues to trickle in to non-Emerging Markets.
This table shows the effect of share-price movements on CLIG’s FUM:
| Market movements | Mar 2018 | Jun 2018 | Sep 2018 | Dec 2018 |
| EM ($m) | 12 | (339) | (96) | (220) |
| DEV ($m) | (6) | 0 | (2) | (79) |
| OV ($m) | (2) | 3 | 47 | (63) |
| Frontier ($m) | 9 | (22) | (56) | 29 |
| Non-EM total ($m) | 1 | (19) | (11) | (113) |
| Total ($m) | 13 | (358) | (107) | (333) |
(EM=Emerging Markets, DEV=Developed Markets, OV=Opportunistic Value)
The last quarter witnessed CLIG’s Emerging Market funds suffer another notable downturn and the non-Emerging Market investments endure by far their worst quarter of the twelve months.
I note CLIG’s 9% FUM dive was at the top end of the group’s 4% to 9% benchmark drops.

FUM performance against benchmarks
CLIG said:
“The EM strategy outperformed due to narrowing discounts and good country allocation over the period.”
My tables suggest the Emerging Market funds fell an underlying 6% versus a reported benchmark decline of 8%.
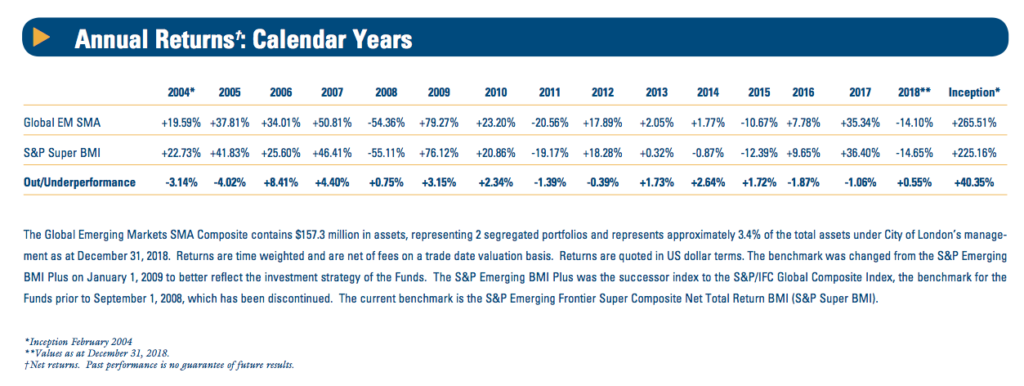
You may recall I mentioned within my August write-up that CLIG’s representative Emerging Market fund was on course for lagging its benchmark for three consecutive (calendar) years.
Well, I am pleased to say a third year of underperformance was avoided with a reported +0.55% outperformance for 2018:
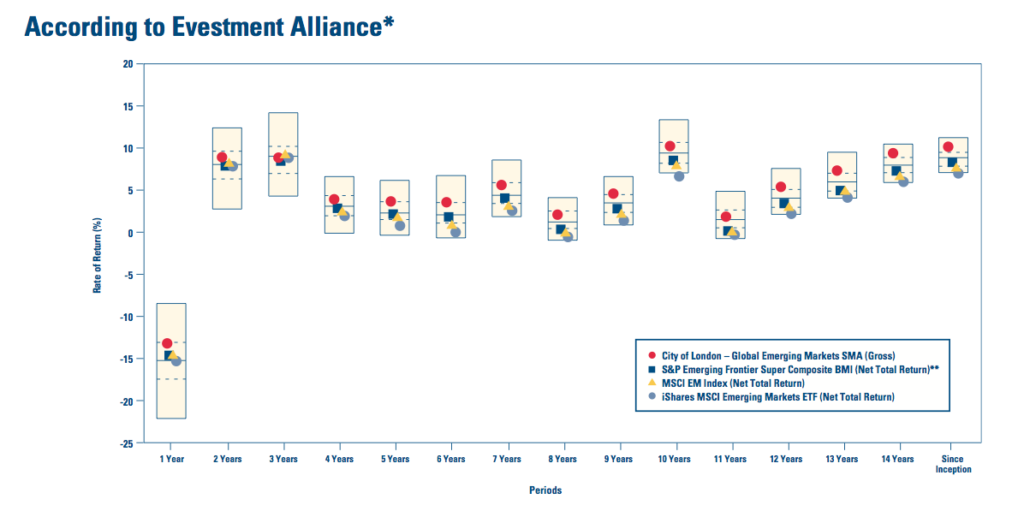
The red circles within the slide below confirm CLIG’s representative Emerging Market fund sustaining a consistent second-quartile performance during the last eleven years:
Just so you know, CLIG gave this explanation for the non-Emerging Market funds trailing their respective benchmarks:
“Generally, a combination of NAV performance and discount widening, relating to year-end tax-loss selling in the US, affected relative performance.”
Enjoy my blog posts through an occasional email newsletter. Click here for details.
New clients and additional FUM
The chart below was probably the most encouraging from the presentation:
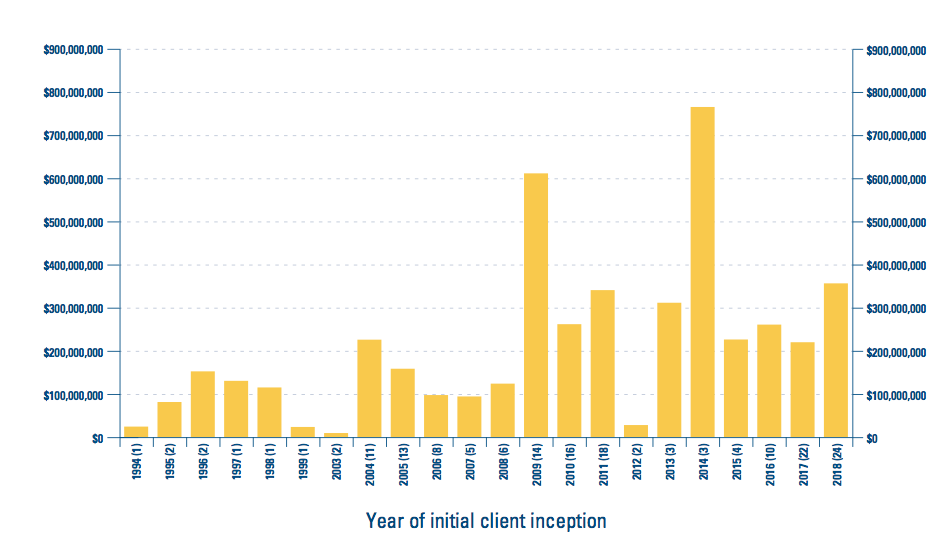
I counted 169 clients now onboard versus 158 at this time last year.
During 2015, 2016 and 2017, client numbers bobbed consistently around the 155 mark, so I am pleased some progress was made attracting new customers during 2018.
True, the 24 new clients who joined during 2018 hold an average FUM of just $15m each (versus, say, the c$250m average from the three clients gained during 2014).
However, I would like to think more FUM could be added from these new customers if CLIG’s funds do well. In fact, CLIG claimed a further $125m of FUM would be funded during the current quarter.
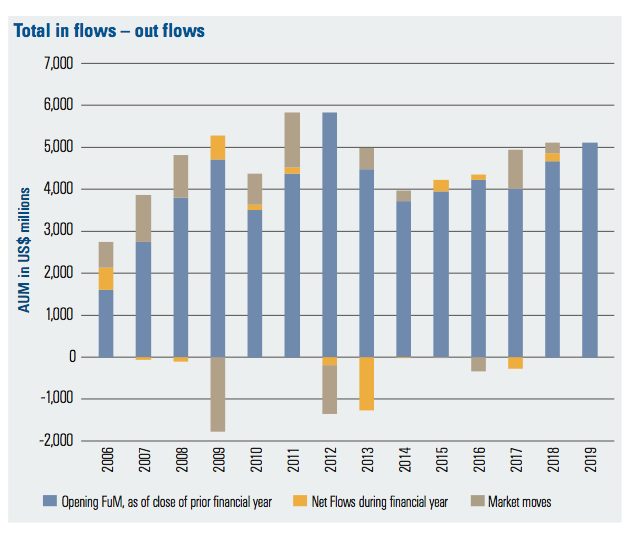
Mind you, I still feel CLIG’s wider FUM progress is dictated mostly by general market movements.
The chart below from CLIG’s 2018 annual report shows market movements (the brown boxes) outweighing the movements from client contributions and withdrawals (the very small yellow boxes).
Dividend-cover template
The aforementioned 9% FUM drop during this first half has knocked CLIG’s own projections within its dividend-cover template:
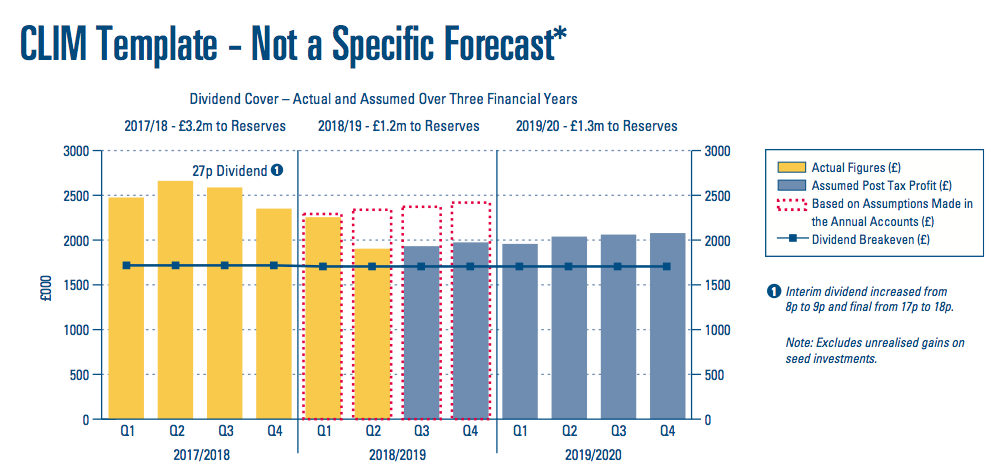
I still applaud CLIG for regularly publishing this template to highlight what could happen.
But the ups and downs of client FUM additions and withdrawals — alongside the wider market movements — have shown the numbers to be rather optimistic at times.
You can see the optimism for yourself in the template chart above, with the red dotted lines indicating the previous quarterly profit projections.
For the record, a year ago the template looked like this:
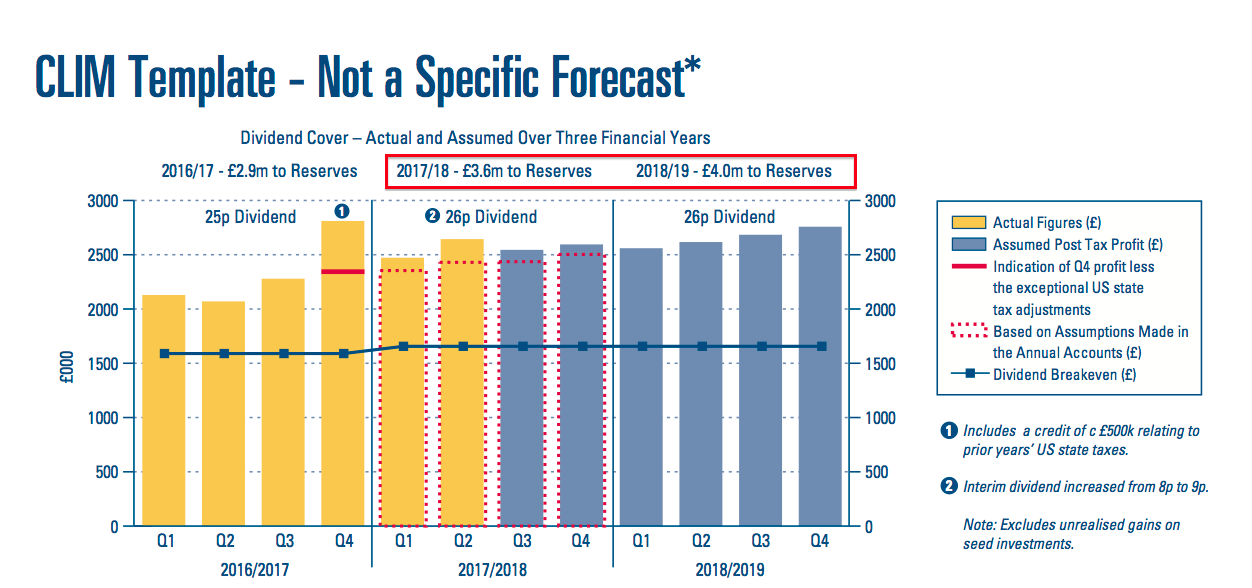
The projection then for 2018/19 was for quarterly earnings of at least £2.5m.
The latest template anticipates quarterly earnings at the £2.0m mark.
Anyway, CLIG now believes earnings of £1.2m could be retained during the current 2019 financial year.
I calculate £1.2m transferred to reserves after repeating last year’s 27p per share dividend means earnings could be approximately 32p per share.
Revised company projections
Closer inspection of the dividend-cover template’s “key assumptions” reveals various changes since the June year-end:
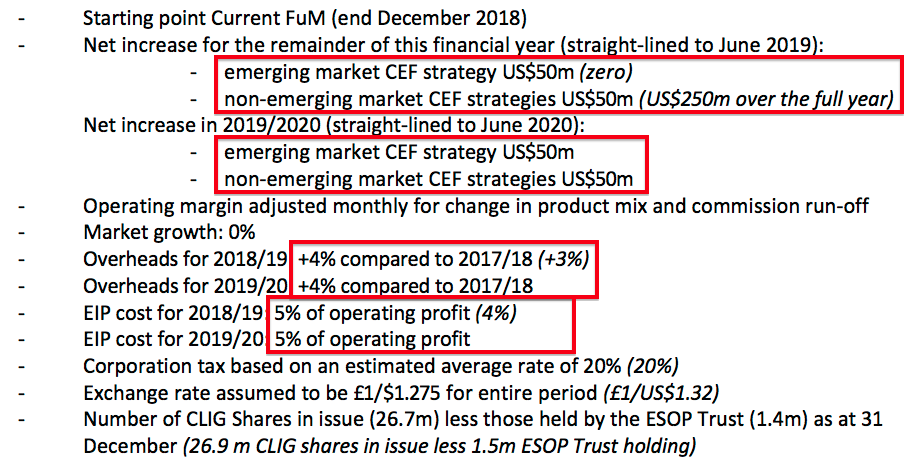
CLIG now reckons the forthcoming second half can witness FUM grow by a net $100m. (Given the RNS claimed a further $125m of FUM would be provided by clients during the current quarter, this $100m target seems achievable.)
CLIG’s first projection for 2019/2020 is a further $100m target increase.
I see overheads for the current 2018/19 year are now set to advance 4% rather than 3% on the year before. At least overheads are not expected to increase for 2019/2020.
I also note the (awful) Employee Incentive Plan (EIP) is now projected to pinch 5% of this year’s operating profit instead of 4%.
I did write in August: “I dare say the EIP’s cost could reach the 5% cap during the plan’s remaining two years.“
I am pleased my valuation sums have always assumed the EIP would skim the maximum 5%.
Management fees
Back in August I also wondered:
“January’s table had indicated CLIG would earn net fees at 82 basis points on client money. Last July’s table had indicated the rate was 84 basis points, while the rate was 86 basis points the year before.
I wonder if the next presentation will show fees another two basis points lower at 78.”
Management fees have actually fallen by three basis points to 77:
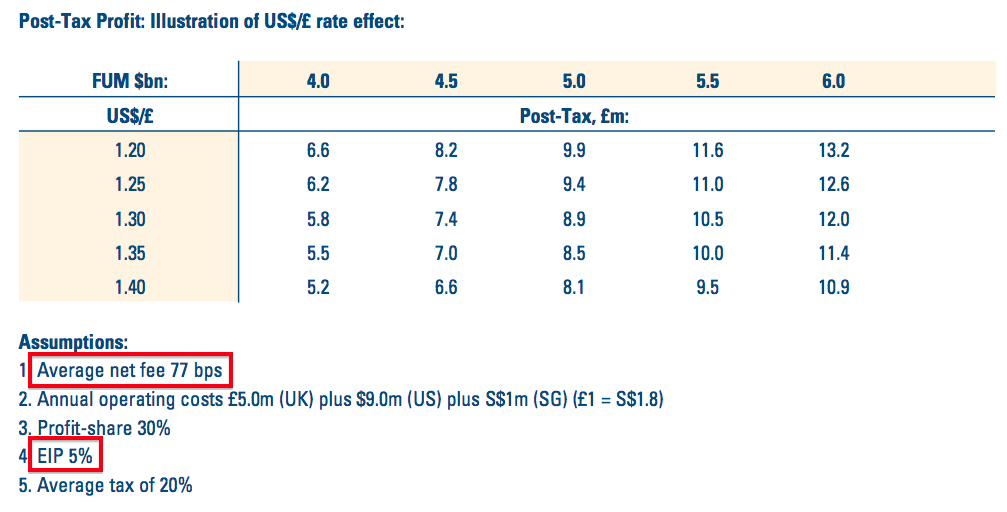
The drop to 77 basis points was revealed initially within the first-quarter update.
I understand the lower fee rates are due to lower charges on the non-Emerging Market products. These funds represented 13% of total FUM this time last year, and now represent 19%.
As I have mentioned, the EIP charge has been lifted to 5%, too.
(Having the assumptions on this FUM/exchange-rate table match the earlier template “key assumptions” is helpful.)
Margin, balance sheet and cash flow
These H1 summary accounts did not show anything untoward.
Despite the lower profit, the operating margin remained high at 33% — albeit not as high as the 37% achieved throughout 2017 and 2018.
Meanwhile, the balance sheet carried cash and investments of £18.9m — if you include a seed investment of £3.9m that became effective just after the half-year-end:

I am sure the seed investment relates to a new REIT fund:

Meanwhile, the cash flow statement would have shown the bank balance being bolstered by a useful £3.5m contribution were it not for the chunky dividend and the £3.9m seed investment:
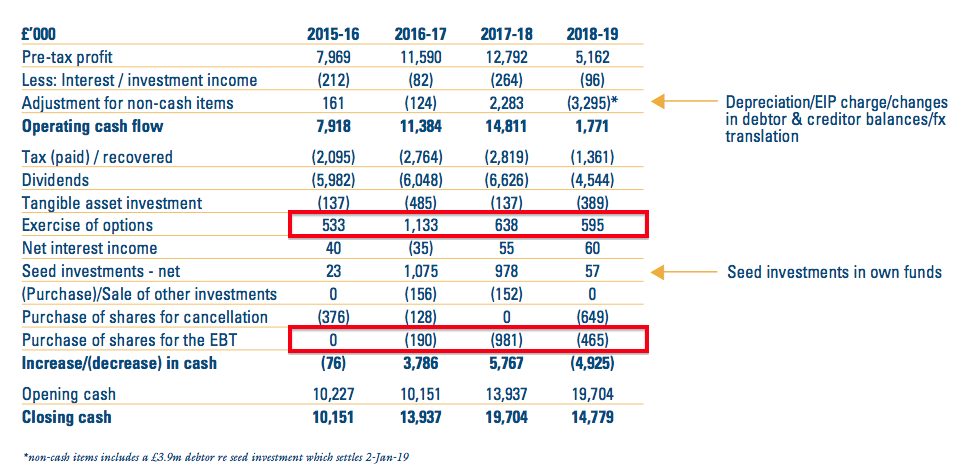
CLIG’s cash flow contains some not-insignificant entries concerning the exercise of options and the purchase of shares for the employee benefit trust (EBT).
I plan to cover these entries (and similar entries from different shares) within a forthcoming How To Evaluate Blog post on share options.
I will look at CLIG’s H1 accounts in more detail when the full interim report is issued next month.
Valuation
My valuation sums use CLIG’s latest FUM/exchange-rate table (see above).
I calculate FUM at $4,625m and GBP:USD at 1.29 may lead to earnings of approximately £7.8m or 29.2p per share.
Adjusting the £96m market cap for the cash and investments of £18.9m and regulatory capital of £1.5m, my enterprise value (EV) calculation comes to approximately £79m or 295p per share.
Dividing that EV by my earnings guess gives a possible P/E of 10.
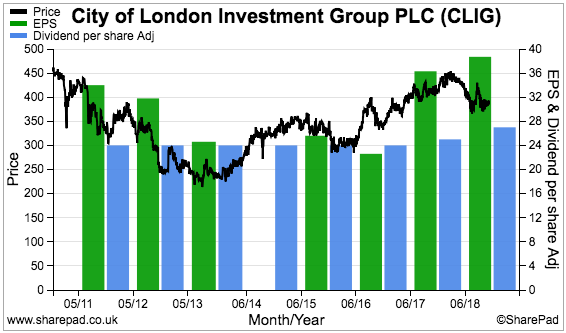
I should add that my 29.2p per share earnings guess does not leave much room to cover the 27p per share dividend. No wonder the yield is 7.5%.
Nevertheless, the chart below shows CLIG holding its dividend (the blue bars) when earnings (the green bars) have dropped substantially in the past:
While the share price does not appear expensive, I must re-iterate:
- The shares have rarely traded at an extended rating in the past;
- Little progress has been made attracting significant FUM from new clients for some years;
- Client fee rates have been chipped lower over time, while employee costs have been rising;
- The balance sheet has regularly carried a sizeable cash position, which may be needed to reassure clients and might therefore not really be ‘surplus to requirements’ for valuation purposes, and;
- Founder/chief executive Barry Olliff retires at the end of this year and is currently reducing his near-8% shareholding (he last sold during March 2018 at 450p).
On the final point, I do wonder whether Mr Olliff’s retirement may spark a new approach to marketing within CLIG.
Perhaps Mr Olliff’s successor — with his Vanguard marketing background — can kick-start a quest to find numerous additional clients with healthy FUM:

CLIG expects Mr Griffith to be appointed chief executive later this year.
While I await some action from Mr Griffith, I am happy to sit back and collect the 27p per share dividend and enjoy the 7.5% income.
Maynard Paton
PS: You can receive my blog posts through an occasional email newsletter. Click here for details.
Disclosure: Maynard owns shares in City of London Investment.

Thanks for your article.
Like you I am holding the shares.
Thanks Eric
Thank you for a comprehensive analysis Maynard. It was very interesting. On your last point though the new CEO has been with CLIG for 18 years so I suspect any Vanguard cultural focus may have worn off by now.
Hello Richard
Good point. I guess I am hoping his earlier marketing background may re-energise CLIG’s marketing efforts in a small way. He is not an investment man, or at least his bio does not suggest he is.
Maynard
City of London Investment (CLIG)
Funds under management update
FUM during January increased by $448m to $5,072m — the highest level since August:
https://citlon.com/investor-relations/funds-under-management.php
Using the exchange-rate/FUM table shown in the Blog post above, I arrive at earnings of £9.08m or 34.0p per share with client money at $5,072m and £1 buying $1.30.
Maynard
City of London Investment (CLIG)
Publication of interim results for the six months ending 31 December 2018
CLIG has followed up the January summary results reviewed in the Blog post above with the full interim report. The statement announced a special dividend and contained a few interesting snippets.
1) Special dividend
CLIG declared a welcome special dividend alongside a maintained first-half payout:
I was not expecting the special dividend. In my Blog post above, I pondered:
“The balance sheet has regularly carried a sizeable cash position, which may be needed to reassure clients and might therefore not really be ‘surplus to requirements’ for valuation purposes…”
I wonder if the special payout ties in with the forthcoming retirement of chief executive Barry Olliff, who still owns 7-8% of the company. Mr Olliff will be dependent on his successors deciding his dividend income from 2020, so he might as well extract what he can while he remains in charge.
2) Chief executive’s potential share sales
Mr Olliff still plans to keep his shares until they reach at least 450p:
3) New KPIs
I can’t ever recall a quoted company presenting a share-price KPI:
Bold stuff. The mid-point is a total share-price return of 10% per annum for five years. That said, the current dividend yield is 27p/400p = 6.75%, so not much is needed to reach the minimum 7.5% per annum goal.
I presume targeting double the total return of that Emerging Market index refers to CLIG’s funds under management and not the share price.
4) New REIT product
CLIG has recently seeded a $5m/£3.9m REIT fund. The portfolio apparently offers “significant” potential to garner client assets, and unlike the main Emerging Market division, should not be constrained by size:
Mr Olliff seems to think there will be no further fund innovations beyond this REIT portfolio:
5) Minor differences to the earlier summary results
These official half-year figures include two small changes from January’s summary figures reviewed in the Blog post above:
i) The £3.9m REIT seed money is now accounted for within cash as “committed cash” rather than as a debtor:
ii) The £595k raised from the exercise of options is now shown as £204k and not £595k within the cash flow statement:
A counter-balancing adjustment has been made with the change in debtors entry within the same statement.
6) Net FUM inflows/outflows
CLIG revealed new funds under management inflow/outflow data:
Nothing too sensational here, with the changes representing 7% (2015), 3% (2016), (7%) (2017), 4% (2018) and 1% (H1 2019) of the prior-year’s year-end FuM level.
7) Valuation
CLIG has not amended the helpful dividend templates and FuM/FX table from January’s summary results, so my valuation sums remain as per the Comment above.
Maynard
City of London Investment (CLIG)
Funds under management update
FUM during March increased by $92m to $5,275m — the highest level since April 2018:
https://citlon.com/investor-relations/funds-under-management.php
Using the exchange-rate/FUM table shown in the Blog post above, I arrive at earnings of £9.64m or 36.1p per share with client money at $5,275m and £1 buying $1.30.
Maynard
City of London Investment (CLIG)
Quarterly funds under management update Q3 published 16 April 2019
A positive funds under management (FUM) update, although the small-print revealed the percentage level of management fees earned from FUM has been trimmed again. Further investigation reveals certain new funds potentially producing much lower fees than more established funds.
Here is the full text:
———————————————————————————————————————
City of London (LSE: CLIG), a leading specialist asset management group offering a range of institutional products investing in closed-end funds, announces that as at 31 March 2019, FuM were US$5.3 billion (£4.1 billion). This compares with US$4.6 billion (£3.6 billion) at the Company’s half-year on 31 December 2018. A breakdown by strategy follows:
The Emerging Market, Developed and Opportunistic Value Strategies outperformed due to narrowing discounts and to a lesser extent, positive NAV performance. The Frontier Strategy underperformed largely due to unfavourable NAV performance.
During the period under review, the Developed and EM strategies recorded net inflows of US$101 million and US$45 million, respectively. Net flows in the Opportunistic Value and Frontier strategies were essentially flat.
With regard to business development, the Group continues to maintain an active pipeline across all of its major CEF offerings, with increased interest continuing to be seen in the non-Emerging Market CEF strategies (i.e. Developed, Opportunistic Value).
Operations
The Group’s income currently accrues at a weighted average rate of approximately 76 basis points of FuM, net of third party commissions. “Fixed” costs are c£1.1 million per month, and accordingly the current run-rate for operating profit, before profit-share of 30% and an estimated EIP charge of 5%, is approximately £1.5 million per month based upon current FuM and a US$/£ exchange rate of US$1.3 to £1 as at 31 March 2019.
Dividends
An interim dividend of 9 pence per share plus a special dividend of 13.5 pence per share was paid on 22 March 2019. The Board will announce the final dividend on Tuesday 16 July 2019 in its pre-close trading update.
———————————————————————————————————————
The FUM numbers were positive.
New client money of $153m during Q3 meant market movements added $492m — equivalent to 10.6% of FUM at the end of Q2. A 10.6% return appears in line with the highlighted benchmarks.
The extra $45m for Emerging Market (EM) funds was the first quarterly inflow of client money to that division for at least a year. A rising market presumably helps attract new contributions.
However, even following this $45m contribution, a net $200m has still left CLIG’s EM funds during the last twelve months.
Non-EM funds added $108m during Q3 to make $357m added during the last twelve months.
I will be happy if non-EM funds can attract a further $357m during the next twelve months — that amount would bolster the $1,088m non-EM funds by 33%.
Non-EM funds now represent 20.7% of total FUM, versus 19.3% for Q2 and 14.5% this time last year.
The rising proportion of non-EM funds to EM during the last twelve months is more to do with EM funds dropping 10% ($454m) than non-EM gaining 38% ($303m).
I am hopeful EM outflows can one day be contained and offset by inflows to non-EM funds.
I am disappointed — but not that surprised — by this line:
“The Group’s income currently accrues at a weighted average rate of approximately 76 basis points of FuM”
The Blog post above noted the rate was 77 basis points. This time last year the rate was 80 basis points. The year before that was 84 basis points.
I understand the lower rate is due to lower fees on the non-EM funds.
My algebra suggests EM funds earn 89 basis points and non-EM funds earn 25 basis points to be able to broadly match the figures stated by CLIG for the overall fee rate.
I am not 100% sure my sums are correct, but I can’t determine an alternative solution. I can’t quite believe the non-EM FUM earns such a low fee rate. Further digging is required on this matter — especially if non-EM FUM is meant support CLIG’s growth ambitions.
Maynard
City of London Investment (CLIG)
Funds under management update
FUM during April increased by $116m to $5,391m — the highest level during the last five years bar the period December 2017 to April 2018:
Using the exchange-rate/FUM table shown in the Blog post above, but applying management fees of 76 basis points as per the comment above, I arrive at earnings of £10.0m or 37.7p per share with client money at $5,391m and £1 buying $1.27.
Maynard
City of London Investment (CLIG)
Funds under management update
FUM during May decreased by $310m to $5,085m — the first month-on-month drop of 2019:
Using the exchange-rate/FUM table shown in the Blog post above, but applying management fees of 76 basis points as per the comment above, I arrive at earnings of £9.1m or 34.4p per share with client money at $5,085m and £1 buying $1.27.
Maynard
City of London Investment (CLIG)
Funds under management update
FUM during June increased by $314m to $5,396m — to bring FUM back to the level seen at the end of April:
Using the exchange-rate/FUM table shown in the Blog post above, but applying management fees of 76 basis points as per the comment above, I arrive at earnings of £10.4m or 39.2p per share with client money at $5,396m and £1 buying $1.24.
Maynard