02 January 2026
By Maynard Paton
Happy 2026! I really hope your shares performed much better than mine last year.
A summary of my portfolio’s 2025:
- Total return of -24.4%*;
- Individual returns ranged from up 51% for S & U to down 62% for System1;
- Two shares were topped-up: Bioventix and S & U;
- One share was sold entirely: Tristel;
- No shares were top-sliced, and;
- No new shares were purchased.
(*Performance calculated using quoted bid prices and includes all dealing costs, withholding taxes, broker-account fees, paid dividends and cash interest)
Since I commenced this blog at the start of 2015 I have published a quarterly portfolio review. This Q4 post recaps my October/November/December activity as well as my 2025 performance. Here are my Q1, Q2 and Q3 2025 reviews.
From 2026 I will no longer blog about my shares or portfolio. I therefore trust you enjoy my final annual-performance recap.
Maynard Paton
Contents
Disclosure: Maynard owns shares in Andrews Sykes, Bioventix, City of London Investment, Mincon, Mountview Estates, S & U, System1, FW Thorpe and M Winkworth. This blog post contains ShareScope affiliate links.
Q4 share trades
None.
Q4 portfolio news
As usual I have kept watch on all of my holdings. The Q4 developments are summarised below:
- Andrews Sykes: Nothing of significance.
- Bioventix: FY 2025 confessing to sudden Chinese competition leading to profit declining by 5% and the final divided cut by 7p per share.
- City of London Investment: Q1 2026 funds under management suffering a mighty $419m outflow plus “considerable progress” searching for a new chief executive.
- Mincon: Q3 2025 trading “as expected” alongside the declaration of an unchanged €0.0105 per share H1 dividend.
- Mountview Estates: H1 2026 revealing a particularly weak 46% property-sales gross margin and a highly unusual absence of property purchases.
- S & U: H1 2026 claiming the “turning of the S & U tanker” with a 5p per share H1 dividend lift, followed by Q3 2026 profit continuing to “beat budget“.
- System1: H1 2026 confirming revenue down 7% and profit down 90%, albeit with “bookings in October and November that have been stronger“.
- FW Thorpe: FY 2025 profit up 2% and the annual dividend up 5%, followed by an AGM statement disclosing FY 2026 progress to date was “in line with last year“.
- M Winkworth: The Q3 2025 dividend lifted 10% to 3.3p per share.
I have written a full review of all the shares I held during 2025 — simply click here for the complete run-down.
Annual review
This post marks my eleventh review of my portfolio’s annual performance.
I have always used these reviews to “check whether my portfolio decisions have become consistently good, bad or indifferent“. Last year unfortunately emphasised that my portfolio decisions have for some time been very indifferent.
2025 performance
The chart below compares my portfolio’s weekly 2025 progress to that of the FTSE 100 total return index:
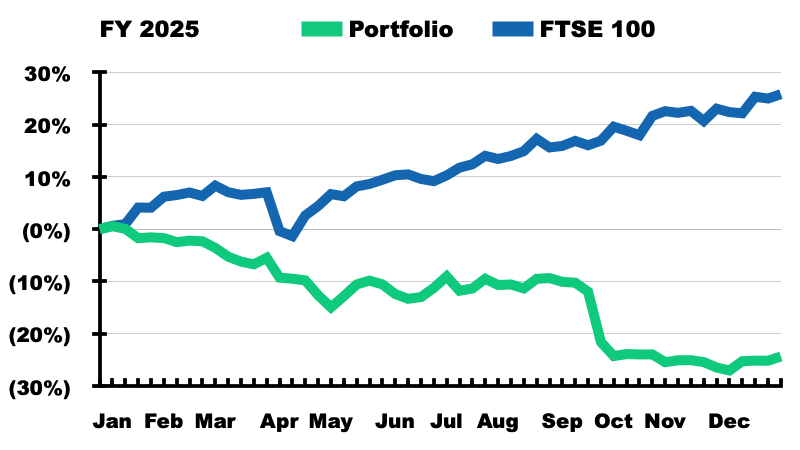
I finished down 24.4% versus a 25.8% gain for the UK benchmark.
Last year’s substantial loss eradicated my 22.4% gain from 2024 and reduced the value of my portfolio to a level first achieved at the beginning of 2021. I started investing during the early 1990s and I am pretty sure 2025 witnessed by far my worst yearly under-performance.
One holding dominated my 2025: System1 began the year representing 38% of my portfolio and its shares slumped 62% during the twelve months. Everything else within my portfolio was largely a sideshow.
2015-2025 performance
The next chart compares my portfolio’s monthly progress to that of the FTSE 100 total return index. The chart commences from when I became a full-time investor at the start of 2015:
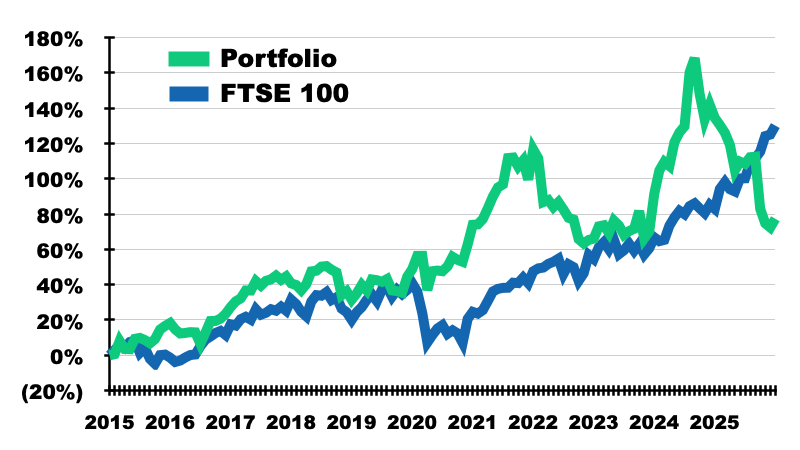
I am behind the FTSE over one, three, five, ten and eleven years:
| To 31 December 2025 | My Portfolio | FTSE 100 TRI |
| 1 year | (24.4%) | 25.8% |
| 3 years | 6.8% (2.2%pa) | 48.9% (14.2%pa) |
| 5 years | 2.0% (0.4%pa) | 84.7% (13.1%pa) |
| 10 years | 49.9% (4.1%pa) | 133.1% (8.8%pa) |
| From 31 December 2014 | 77.3% (5.3%pa) | 130.1% (7.9%pa) |
I am pretty sure my market-trailing performance was due mostly to 2022 and 2025, two years when my portfolio lost more than 20% while the index reported a positive result:
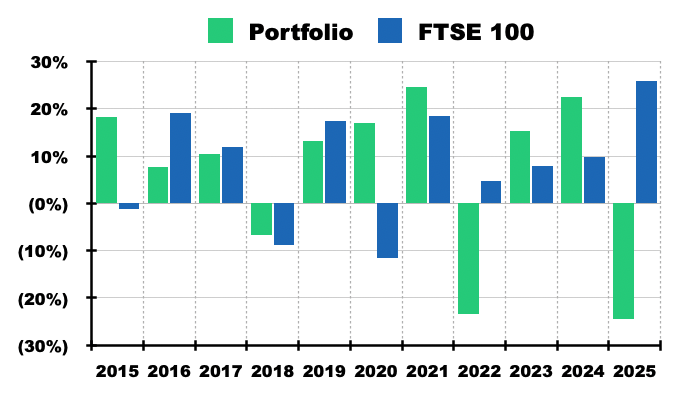
I also lagged the index during 2016, 2017 and 2019.
Investment returns and attribution analysis
Just to confirm, during 2025:
- I topped up two holdings (Bioventix (Q1, Q2) and S & U (Q2, Q3);
- I sold one holding (Tristel (Q1));
- I left seven holdings untouched (Andrews Sykes, City of London Investment, Mincon, Mountview Estates, System1, FW Thorpe and M Winkworth), and;
- No new shares were purchased.
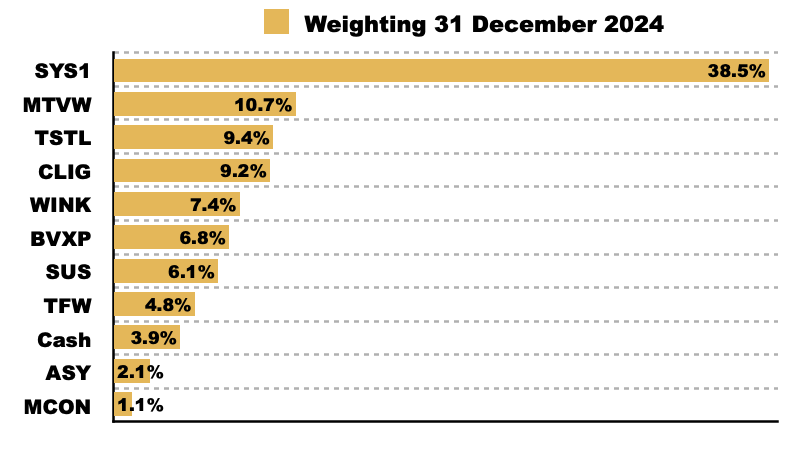
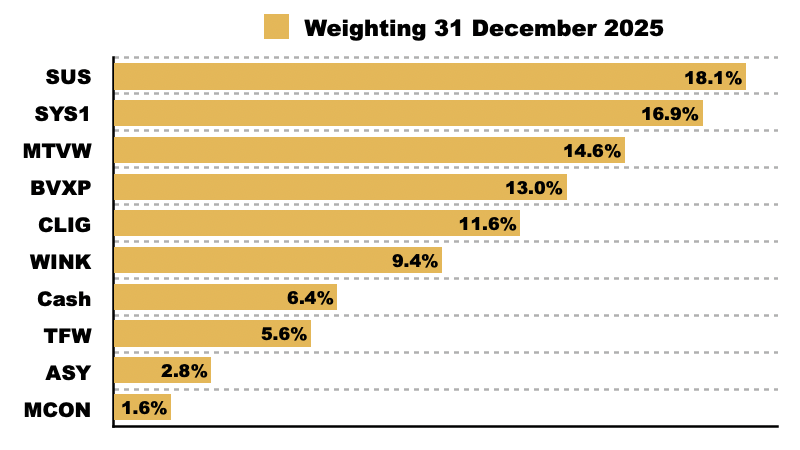
My portfolio started 2025 like this…
…and finished 2025 like this:
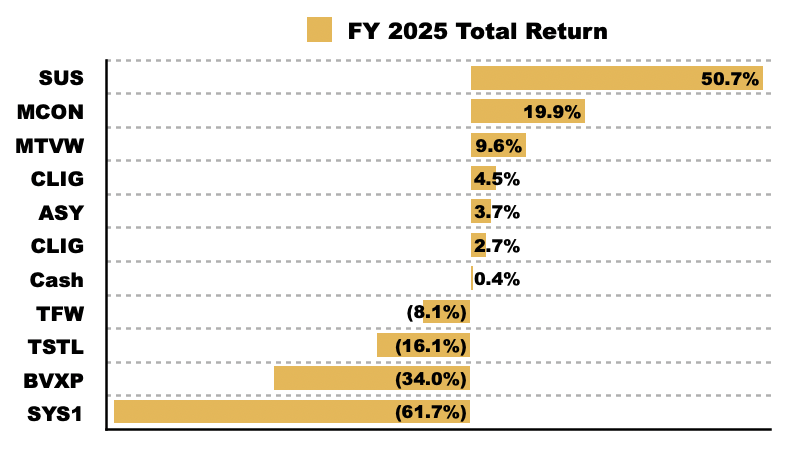
This next chart shows the total return (that is, the capital gain/loss plus dividends received) each holding produced for me during the year:
And this chart shows each holding’s contribution towards my overall 24.4% loss:
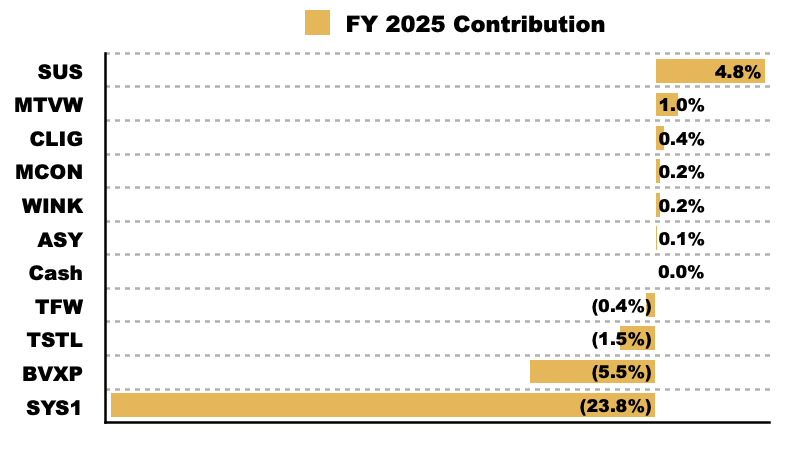
System1 once again had an enormous influence on my performance. My portfolio would have lost less than 1% had I exited this share at the start of 2025 and not reinvested the proceeds.
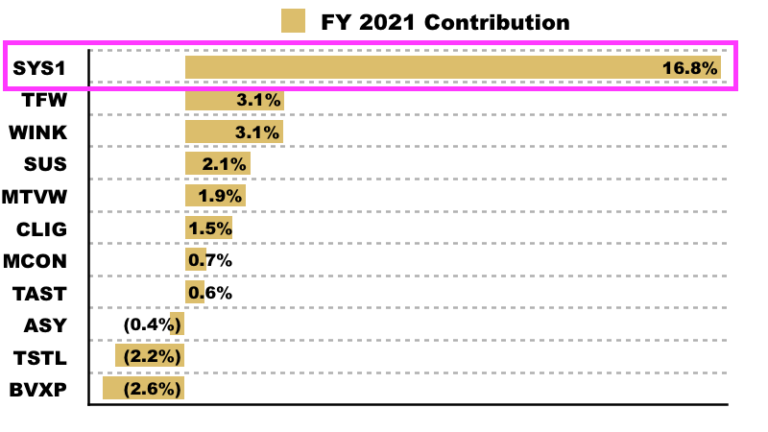
The ups and downs at System1 have dominated my returns during recent years. The shares represented 17 percentage points of my 25% gain during 2021…
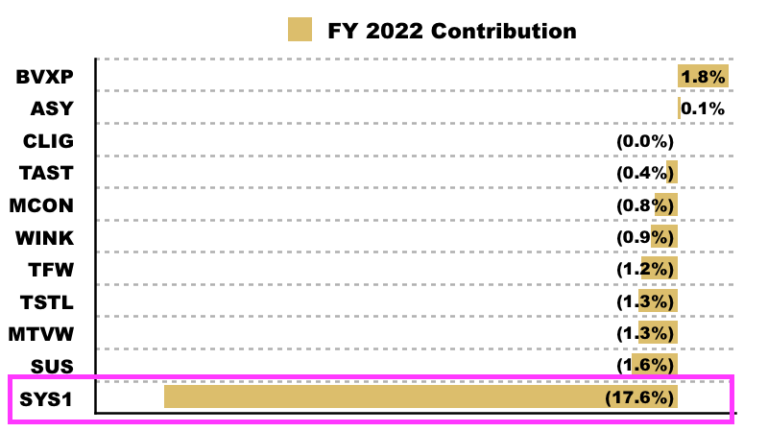
…18 percentage points of my 23% loss during 2022…
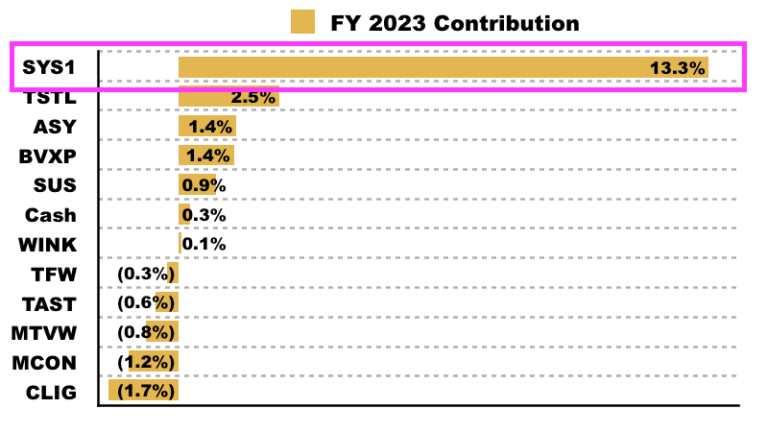
…13 percentage points of my 15% gain during 2023..
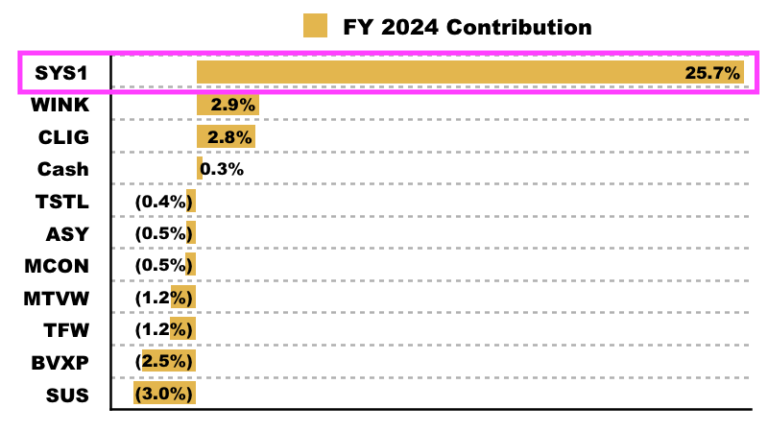
…and 26 percentage points of my 22% gain during 2024:
Last year’s System1 calamity was accompanied by disappointing progress at Bioventix, which subtracted a further 5% from my portfolio following some hefty top-ups early in the year. And my Tristel exit was not best timed with the shares up 18% since my sale.
Among my other holdings, only S & U delivered a FTSE-beating return during 2025. The shares of the specialist lender enjoyed a ‘relief rally’ and added 5% to my portfolio. A tiny position in Mincon meant the drill group’s healthy gain did not influence my overall return.
My five other positions — Andrews Sykes, City of London Investment, FW Thorpe, M Winkworth and Mountview Estates — delivered subdued total returns that reflected their subdued financial performances. Wider economic and market considerations also kept a lid on their valuations. The quintet combined to enhance my portfolio by only 1%.
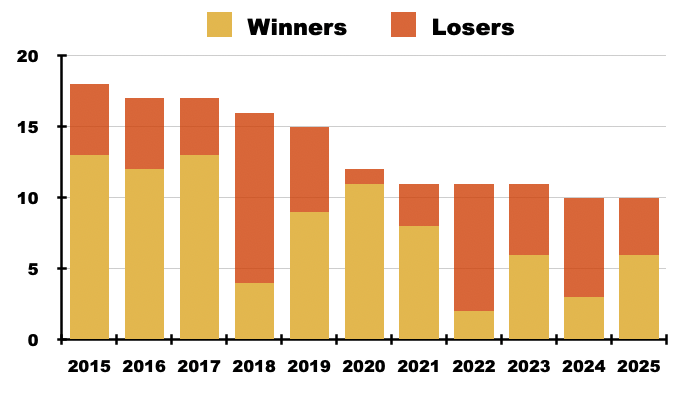
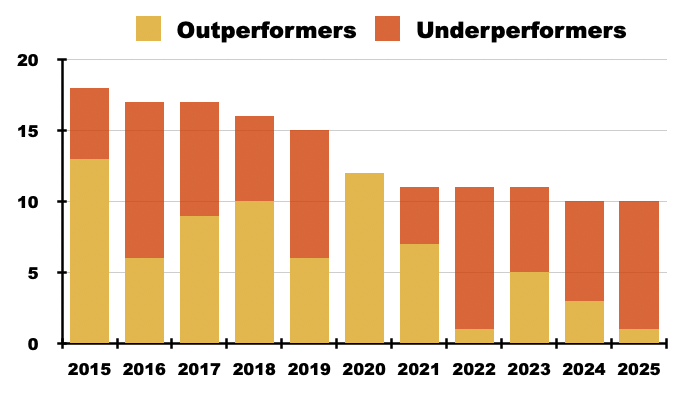
Six winners out of ten last year meant my holdings have delivered a positive annual return 59% of the time since the start of 2015:
But just S & U outgunning the FTSE 100 during 2025 meant my holdings have delivered a market-beating annual return only 49% of the time since the start of 2015:
Dividends, turnover and costs
My 2025 highlight was dividend income. Total payouts advanced a hefty 29% due almost entirely to purchasing extra shares during 2025 (Bioventix and S & U) and 2024 (City of London Investment, Mountview Estates and S & U). Dividends collectively added 4.3% to my total 2025 return:
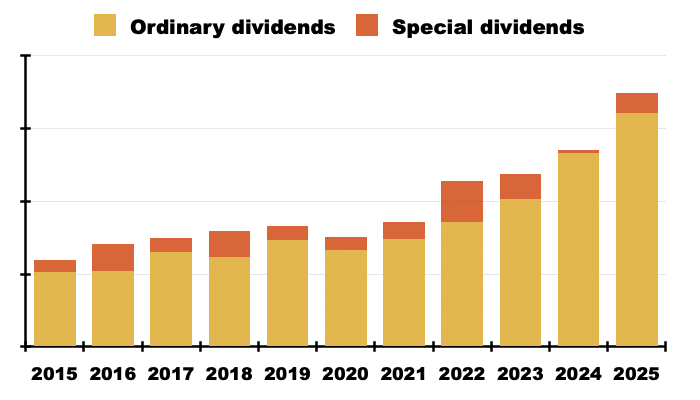
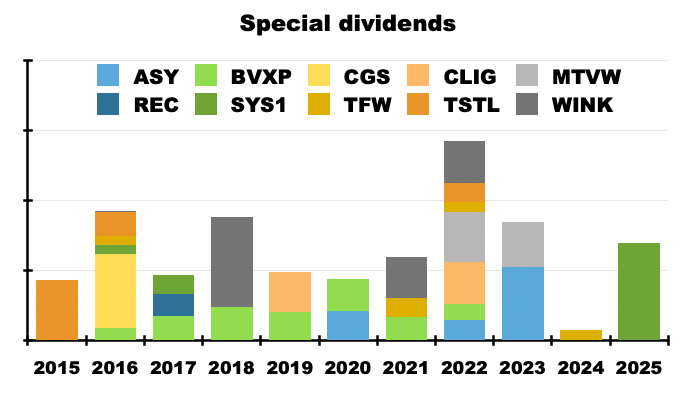
Last year I received only one special dividend — ironically from System1 — which enhanced my ordinary-dividend total by 9%. My portfolio has amazingly received specials every year since (at least) 2015, and such extra payments have bolstered my ordinaries by 16% during the lifespan of this blog:
My ordinary dividends gained a super 20% last year, which I estimate would have been only 1% were it not for the aforementioned extra shares purchased during 2024 and 2025. Only three of my holdings managed to lift their ordinary dividend last year — FW Thorpe (+5%), M Winkworth (+10%) and System1 (+10%).
Portfolio turnover was my highest since 2017. I bought shares equivalent to nearly 13% and sold shares equivalent to more than 9% of my portfolio’s year-start value.
Trading costs were kept modest. Dealing commissions, stamp duty and account-management fees represented an aggregate 0.05% of my portfolio’s year-start value.

Well thanks for being honest.
38.5% of your portfolio in one small cap share. What could go wrong?
Thank you for your time over the years for writing this blog.I have learnt a lot from it.Best of luck this year with your portfolio.