12 July 2025
By Maynard Paton
H1 2025 results summary for City of London Investment (CLIG):
- A positive H1 performance versus the comparable H1, with average funds under management (FuM) up 12% helping revenue gain 9%, profit improve 13% and the dividend to be sustained at 11p per share for the fifth consecutive H1.
- Net client withdrawals at $564m were the largest six-month outflow since at least H1 2018, and reiterated how client CAGRs at 5-8% and gross fees at 0.72% are no longer that appealing versus the “expansion of passive options“.
- A further failure to achieve the group’s main KPI looks to have prompted the search for a new chief executive, which offers hope marketing efforts can be enhanced to attract elusive new customers and the “team approach” can be assessed to improve client returns.
- Despite talk of cost savings, expenses continue to creep higher and cash flow just about covers the annual 33p per share dividend with the weaker USD. CLIG has meanwhile flattered its own dividend-cover projection by lifting the market-growth assumption from 0% to 5%.
- The persistent outflow of client money (another $212m during Q3 2025), the tight dividend cover and sudden leadership transition have kept the ‘value trap’ shares languishing at 2007 levels and yielding 9%. I continue to hold.
Contents
- News links, share data and disclosure
- Why I own CLIG
- Results summary
- Funds under management, revenue, profit and dividend
- Funds under management: inflows and outflows
- Funds under management: CLIM investment performance
- Funds under management: CLIM investment strategy
- Funds under management: CLIM discount engagement
- Funds under management: KIM investment performance
- Funds under management: capacity, marketing and growth plans
- Funds under management: fee rates
- Financials: margin and employees
- Financials: cash flow and balance sheet
- KPI
- Q3 2025 funds under management
- Boardroom
- Valuation
News links, share data and disclosure
- Interim results and presentation for the six months to 31 December 2024 published 25 February 2025;
- Appointment of independent non-executive director published 07 April 2025;
- Q3 2025 trading statement published 22 April 2025;
- Directorate change published 10 June 2025, and;
- Board and committee changes published 02 July 2025.
- Share price: 350p
- Share count: 50,679,095
- Market capitalisation: £177m
- Disclosure: Maynard owns shares in City of London Investment. This blog post contains ShareScope affiliate links.
Why I own CLIG

- Fund manager that employs a “very risk-averse” strategy of buying investment trusts at attractive discounts through a team-based approach (point 3).
- Accounts showcase high 39% margin, significant net cash and ability to distribute majority of earnings via dividends.
- Yield of 9% offers meaningful income potential with upside linked to fresh leadership winning extremely elusive new clients and/or further activist intervention from dissatisfied major shareholder George Karpus.
Further reading: My CLIG Buy report | All my CLIG posts | CLIG website
Results summary

Funds under management, revenue, profit and dividend
- January’s Q2 2025 update had already indicated this H1 would show funds under management (FuM) declining 3% to $9,946m:
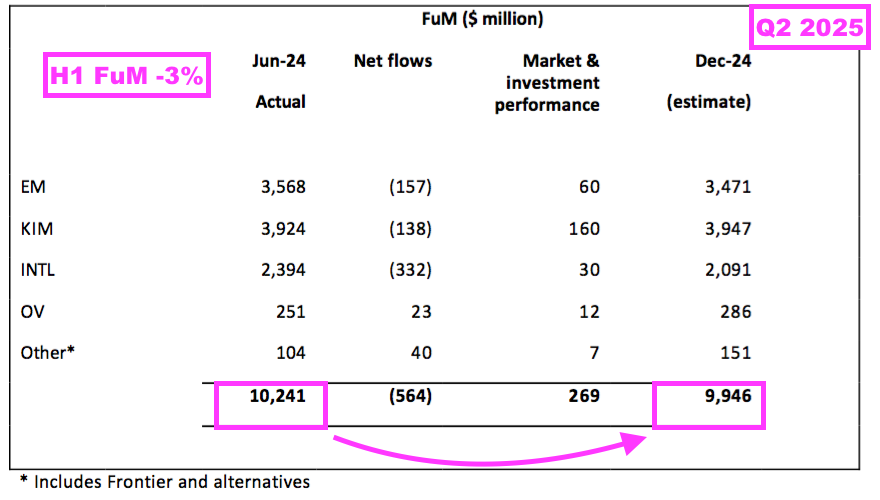
- This H1 confirmed H1 FuM was indeed $9,946m, and that average FuM during this H1 was 12% greater than the level witnessed during the comparable H1:
“Funds under management (FuM) averaged $10.3 billion in the period from 1st July 2024 to 31st December 2024, approximately 12% higher than the same period in 2023.”
- CLIG’s website confirms average H1 FuM was $10.3b versus an average $9.2b FuM for the comparable H1:

- The greater average FuM was due mostly to the preceding H2 2024, during which FuM gained $665m through positive investment returns to top $10b:

- Average FuM gaining 12% during this H1 led to H1 revenue improving 9% to $37.0m:

- Average FuM increasing 12% but H1 revenue improving 9% followed a further reduction to the group’s fee rate (see Funds under management: fee rates).
- H1 revenue at $37.0m was the best six-month revenue performance since H2 2022 ($38.7m), but was 14% lower than the record six-month revenue performance of H2 2021 ($43.2m).
- Note that this H1 restated the revenue and other administration expenses reported by the comparable H1. Both comparable entries were reduced by $422k:

- This H1 did not reveal why the comparable H1 had been restated, which seems poor form.
- CLIG does not distinguish between revenue from its original City of London Investment Management (CLIM) division and revenue from its £102m merger partner Karpus Investment Management (KIM).
- But Companies House reveals CLIM reported revenue of $41.2m for the preceding FY to support 59% of total FY revenue:

- Excluding amortisation associated with the KIM merger, H1 operating profit was $14.5m or 13% greater than the comparable H1:

- The H1 profit progress reflected revenue increasing by $3.2m while costs increased by $1.5m.
- This H1 said costs were “on track to be reduced by c$3m on an annualised basis” (see Financials: margin and employees).
- An 11p per share H1 dividend was declared for the fifth consecutive H1:

- This H1 reiterated the group’s five-year 1.2x dividend-cover policy:
“We continue to believe that the 1.2 times dividend-cover policy based on a rolling five-year period provides a prudent template that serves to protect shareholders from volatility that can affect profits of asset management companies. The Board applies this policy using Underlying Profits“.
- For the five years to this H1, aggregate adjusted earnings totalled 199p per share while the aggregate dividends declared came to 163p per share — equating to five-year dividend cover of 1.22x:

- Note that CLIG now publishes its accounts in USD but continues to declare dividends in GBP.
- How CLIG’s dividend-cover policy will fare following the USD weakening against GBP remains to be seen.
- GBP averaged 1.29 USD during this H1, averaged 1.30 during the subsequent H2 2025 and stood recently at 1.35:

- A weaker USD will translate into lower GBP earnings.
- For example, adjusted earnings for this H1 and the preceding H2 were $0.45 per share giving 35.1p per share, but could have been 33.3p per share had GBP:USD averaged the recent 1.35 rather than the actual 1.28 during those twelve months.
- Board remarks during the 2024 AGM about whether the dividend could be compromised if USD weakened significantly against GBP were not convincing:
[AGM 2024]
“It’s one of those speculations and hypotheticals that we are hopeful that we’ll be ready for.”
…
“It’s not our intention to not have a covered dividend over a period of time. If it comes to pass, we have to be pragmatic and we will do what’s best for shareholders.“
- This H1 implied dividends are denominated in GBP because CLIG’s shares are quoted in London:
“Underlying earnings per share in pence – CLIG’s shares are quoted on the London Stock Exchange therefore the dividend is declared in sterling.”
- Numerous FTSE 100 shares declare USD-denominated earnings and USD-denominated dividends, with payments subsequently converted into GBP at the prevailing exchange rate.
- The five-year 1.2x-cover policy was introduced during FY 2014 and thereafter CLIG had undertaken a policy review every five years.
- But the preceding FY stated the 1.2x-cover policy would now be “assessed for appropriateness annually.”
- Reviewing the policy every year therefore gives CLIG greater scope to alter the 1.2x cover and possibly pay a lower dividend.
- I do wonder whether CLIG will eventually conclude declaring USD-denominated dividends from its USD-denominated earnings will make its dividend-policy reviews somewhat simpler.
- CLIG’s own projections indicate 1.18x dividend cover for FY 2026:

- I am not convinced dividend cover will reach 1.18x for FY 2026 (see Valuation).
- Note that this H1 restated the calculations of past five-year dividend covers.
- For the preceding FY, CLIG derived five-year rolling dividend covers of 1.34x, 1.32x, 1.24x and 1.19x for FYs 2021 to 2024 respectively:

- But for this H1, CLIG derived five-year rolling dividend covers of 1.39x, 1.37x, 1.30x and 1.24x for FYs 2021 to 2024 respectively:

Funds under management: inflows and outflows
- Both CLIM and KIM employ a long-standing value approach of buying investment trusts at attractive discounts.
- The shares of investment trusts often trade below their net asset value (NAV), and CLIM/KIM essentially try to acquire £1 of market assets through a trust’s NAV for something like 85p… with the hope the discount will one day narrow as the shares return towards £1.
- Although buying investment trusts at wide discounts is an inherently logical method of investing, a lot does depend on:
- The investment ‘quality’ and future progress of the NAVs, and;
- Whether the boards of the trusts actually want the discounts to narrow.
- CLIM’s FuM can be divided into two main categories:
- Emerging Markets (EM), and;
- Other strategies, which cover:
- International (INTL) excluding the United States;
- Opportunistic Value (OV);
- Frontier;
- Listed Private Equity (LPE), and;
- Global including the United States.
- CLIM’s customers are primarily US-based institutions, although an EM fund-of-funds is offered to UK retail investors through intermediaries.
- KIM manages a mix of fixed-income and equity portfolios mostly for high-net worth individuals residing in the US.
- Inflows and outflows of client money are vital for assessing fund managers and the likelihood of higher or lower fees. Inflows give shareholders greater confidence the manager is keeping clients happy by investing well, while outflows always suggest clients are not happy and have found better alternatives.
- The (very thin) red bars on the chart below unfortunately show CLIG attracting minimal new client money since FY 2015:

- Indeed, this H1 witnessed net client-money withdrawals of $564m — the worst net outflow for any H1 or H2 since CLIG first disclosed such six-month FuM movements during H1 2018:

- On a quarterly basis, Q2 2025 witnessed net withdrawals of $369m — the worst net outflow for any quarter since CLIG first disclosed such quarterly FuM movements during Q3 2018:

- This H1 not surprisingly confessed “client flows during the previous [Q2 2025] quarter did not meet our expectations“.
- Net outflows between FY 2021 and this H1 now total $1,891m:

- Both CLIM and KIM suffered client withdrawals during this H1.
- CLIM suffered its worst net outflow of any H1 or H2 — $426m — since CLIG first disclosed such six-month FuM movements during H1 2018:

- EM has suffered net outflows for every H1 and H2 since at least H1 2018. Such outflows have totalled a net $2,052m.
- This H1 introduced a new reason — “talk of tariffs and trade wars” — for clients wanting to exit CLIM’s EM (and INTL) funds:
“We were happy with asset growth progression over the past year, but witnessed several outflows as we approached year end. These coincided with talk of tariffs and trade wars as the prospect of a second Trump presidency was absorbed by markets. In the short term, this underpinned the US and sparked a sell-off in international and emerging markets.”
- The preceding FY had blamed “geopolitical volatility“ for EM exits:
[FY 2024] “The total net investment outflows of $320 million were in large part down to clients reducing their exposure to EM due to ongoing geopolitical volatility.“
- The comparable H1 had blamed trackers and money-market funds:
[H1 2024] “The ongoing trend of outflows from active managers into passive managers continued in 2023, but with an additional twist, as flows into money market vehicles reached an all-time high for net inflows during calendar year 2023…“
- And FY 2023 had blamed higher interest rates and long-term EM underperformance:
[FY 2023] “With risk-free rates increasing, exposure to riskier asset classes are naturally being reduced by institutions. This is especially the case with EM and INTL, which are much further up the risk scale compared to US fixed income.“
…
“EM returns now lag US equities over two decades causing “EM fatigue” resulting in fewer new institutional mandates generated in the US.”
- CLIM’s Other strategies have since H1 2018 attracted net new client money of $1,352m, which has sadly not entirely counterbalanced the EM withdrawals.
- I speculate much of the net $1,352m added to Other strategies has in fact been supplied by EM clients seeking a lower-cost CLIM approach.
- After all, CLIM’s Other strategies undertake the same NAV-discount strategy as EM, have produced similar long-term returns to EM… but levy somewhat lower charges than EM (see Funds under management: CLIM investment performance and Funds under management: fee rates).
- During the preceding FY for example, a net $108m was added to Other strategies — of which $100m was through a transfer from EM:
[FY 2024] “Net outflows from the EM strategy included a $100 million transfer of a long-term client who reallocated within CLIM from the EM strategy to the International Equity (INTL) strategy, due to their underlying asset allocation decision”
- This H1 seemed to admit that future CLIM inflows were dependent on US markets losing their appeal rather than initiatives CLIM could undertake in the meantime (see Funds under management: CLIM investment performance):
“We have been patiently waiting for the US-centric investment focus to wane, which may be driven by further monetary easing and/or the shift that may come from the second Trump administration.“
- KIM clients withdrew a net $138m during this H1 to take total net KIM withdrawals since the merger to $572m:

- This H1 repeated how KIM continues to lose out to cash deposits:
“Currently, for US retail investors, interest rates in fixed rate bank deposits or money market vehicles offered by financial institutions remain higher than in recent memory and are in competition to an active fixed income manager. KIM’s outflows during the six months fall into one of three primary categories:
1) the retail client base who are required to withdraw retirement assets by calendar year end due to US regulations,
2) high-net-worth clients with considerable wealth who withdrew assets to deploy capital for life events and/or business opportunities, and
3) institutional pension plan clients that were impacted by regulation changes which drove the outflows.”
- Board remarks during the 2022 AGM claimed KIM suffers “natural” outflows of $100m a year through clients withdrawing capital and income for retirement.
- Board remarks during the 2022 AGM and the 2024 AGM noted that at the time of the merger, KIM clients “took a step back” while a “bunch of [KIM] relationship managers” retired — both of which would not have helped fund inflows.
- The various client-money inflows and outflows — alongside the intervening investment performances — have:
- Kept CLIM’s EM FuM at less than $4b since H2 2022;
- Pushed CLIM’s Other FuM from $0.7m to $2.5b since H1 2018, and;
- Lifted KIM’s FuM from $3.6b to $3.9b since the H1 2020 merger:

- This H1 left total FuM split 35% in EM (previously 35%), 40% in KIM (previously 38%) and 25% in Other strategies (previously 27%).
- 35% remains the lowest proportion of EM FuM in CLIG’s history.
- 40% is now the highest proportion of KIM FuM in CLIG’s history.
- EM funds represented 90% of client money during FY 2017, since when CLIG has diversified its FuM through developing the Other CLIM strategies and undertaking the KIM merger.
- Despite the ongoing FuM withdrawals, many CLIG clients remain encouragingly loyal to the group. The preceding FY reiterated how numerous clients had employed CLIM or KIM for more than ten years:
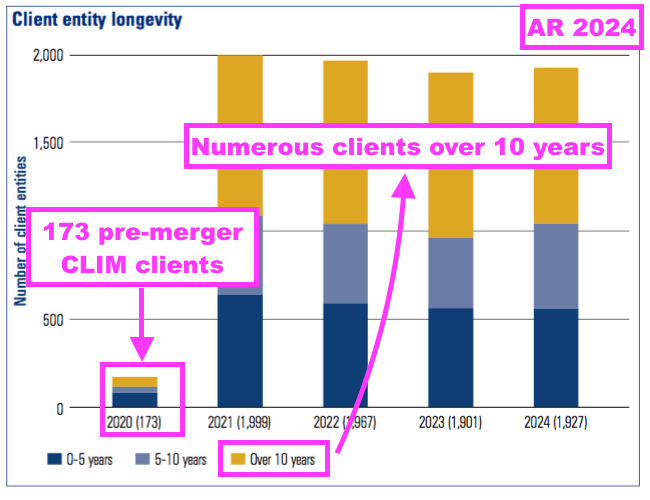
- The extended client tenures seem further evidence of FuM inflows into Other strategies being funded by customers switching from EM, rather than being funded by clients brand new to the group.
- Emphasising the lack of new client money, the 173 CLIM clients served immediately before the KIM merger compares to 161 for FY 2014.
Funds under management: CLIM investment performance
- CLIM’s substantial H1 client-money outflows occurred despite six months of benchmark outperformances:
“Our OV team at CLIM delivered strong absolute returns and outperformed their indices by between 6% and 16%.
The vast majority of our CLIM and KIM-managed International mandates nicely outperformed their various indices by between 1% and 3%.
Similarly, most of our EM mandates outperformed their indices in a range of 0.2% and 1.7%.
And our LPE strategies performed strongly, with the composite delivering 20.9% on an absolute basis net of fees, outperforming their hurdle rate by 12.9% points.”
- The H1 outperformances did not translate into superb absolute gains:
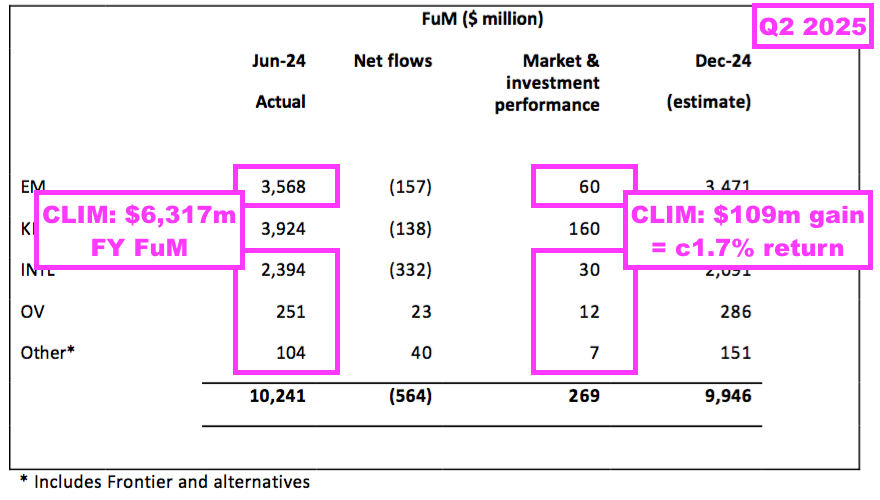
- CLIM’s $109m gain for this H1 equated to an approximate 1.7% return or 3.4% annualised.
- That low, single-digit return contrasted with the double-digit gains enjoyed during the preceding FY:
[FY 2024] “CLIM’s EM strategy returned 12.2% net of fees vs. 13.6% for the S&P EM Frontier Super Composite BMI Index, as it lagged the benchmark by 140 bps due to unfavourable country allocation and weak NAV performance.
…
CLIM’s INTL strategy returned 13.0% net of fees vs. its benchmark MSCI ACWI ex- US Net TR Index which returned 11.6%, outperforming by 140 bps.
…
The OV strategy delivered strong returns in FY 2024, rising 13.1% net of fees vs. its benchmark Blended 50/50 MSCI ACWI/Barclays Global Agg Index, which returned 9.9%, outperforming by 320 bps.
- This H1 reiterated CLIM’s main strategies have posted 5-8% CAGRs during the last ten years:

- Note that the returns shown above are taken before fees.
- Note also that CLIM’s all-equity approaches have delivered the same 5-8% CAGRs as KIM’s ‘Conservative Balanced’ strategy, which is 50-90% invested in (lower returning) cash and bonds (see Funds under management: KIM investment performance).
- The EM and INTL performances reveal an unusual phenomenon: the associated benchmarks are third- or fourth-quartile performers over ten years.
- Benchmarks languishing in the third or fourth quartiles may help explain why CLIM has struggled to attract new client money: lots of rival fund managers within the same sector can also claim ‘benchmark-beating’ returns.
- Unlike the comparable H1…
[H1 2024] “It is notable that emerging and international markets have substantially lagged the US market since the merger. Indeed, the S&P index has delivered a cumulative return of 49% in the 39-month period versus just 2% for EM and 23% for international markets.”
- …this H1 did not refer to the S&P 500.
- The S&P 500 has of course been the index to own during the last decade. The iShares S&P 500 ETF (CSPX) for example has delivered impressive double-digit annualised (USD) gains:

- I remain convinced the aggregate $970m withdrawn from CLIM during FY 2023, FY 2024 and this H1 is due mostly to CLIM’s (US) clientele becoming increasingly enamoured by the performance of the all-conquering S&P 500.
Funds under management: CLIM investment strategy
- My FY 2024 review showed ShareScope identifying 22 different UK investment trusts in which CLIM had announced a holding during the previous few months:
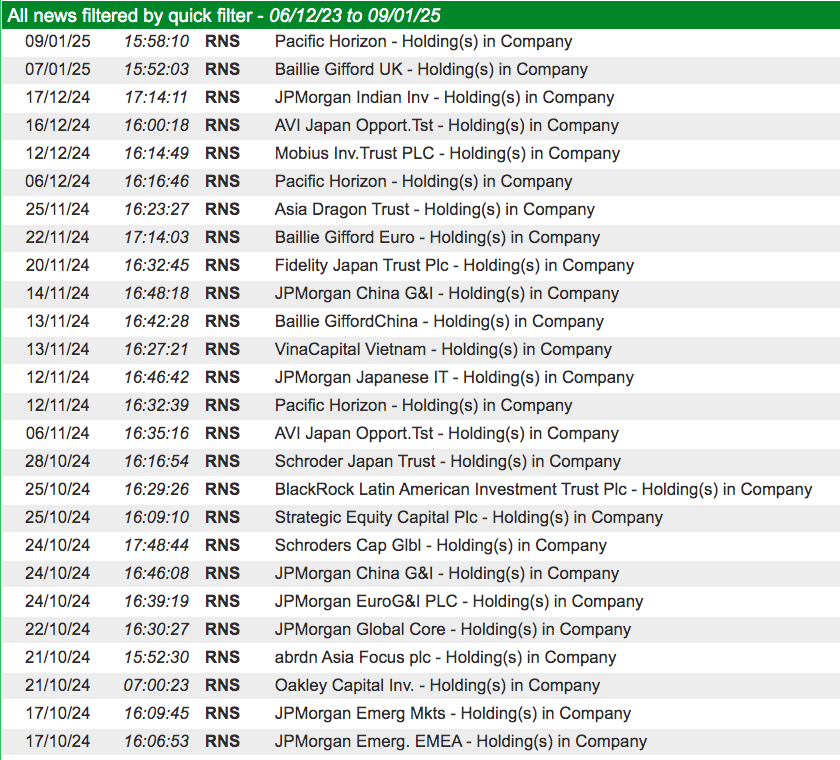
- The same ShareScope search this time identified 14 different holdings announced during the previous few months:

- Of those 14 holdings, six — abrdn New India (ANII), Baring Emerging EMEA Opportunities (BEMO), Fidelity Emerging Markets (FEML), JPMorgan European Discovery (JEDT), Schroder AsiaPacific (SDP) and Utilico Emerging Markets (UEM) — were not included within the initial 22 trusts.
- A check on these six holdings once again highlights the limitations of CLIG’s discount-to-NAV investing approach.
- Holdings in ANII, BEMO and JEDT for example have traded mostly between 0.8x and 1.0x NAV:


- As such, ‘re-rating’ gains are typically restricted to 25% (i.e. from 0.8x NAV to 1.0x NAV) with further returns dependent on NAV growth plus dividends paid.
- CLIM is a long-term holder. Of those 14 trusts identified within my ShareScope news search, eight have been owned for more than five years and four have been owned for at least ten years:

- Discounts on investment trusts can fluctuate notably over five or more years, and I get the impression the full 25% ‘re-rating’ is not always captured.
- Instead, CLIM seemingly adds to a position when the discount is wide, trims a position when the discount is narrow and leaves the position alone when the discount is middling.
- For example, CLIM’s holding in SDP has moved from 14% down to 5% and then up to 21% since 2015:

- The reason for keeping hold of trusts with narrow discounts was outlined by the board during the 2024 AGM; CLIM’s institutional clientele apparently wants to be “fully invested, whether discounts are 0% or discounts are 20%“.
- Being “fully invested” when discounts are 0% is not ideal when the best returns should (theoretically) occur when discounts are 20%.
- Another good reason for CLIM delivering only 5-8% CAGRs is CLIM’s UK universe of investment trusts is an asset class with inherent single-digit returns.
- ShareScope shows the FTSE All Share Sector Closed End Index returning a five-year 3.5% CAGR and a 4.9% ten-year CAGR:

- But perhaps CLIM’s CAGRs are improving. For instance, of those 14 different CLIM-held trusts identified by ShareScope, their average ten-year CAGR is approximately 8.1%…
- …while their average five-year CAGR is approximately 9.0%.
- Indeed, ShareScope also shows that, of the 286 UK investment trusts with ten-year records, only 34 — just 12% — delivered 10%-plus CAGRs during those ten years.
- But of the 355 UK investment trusts with five-year records, ShareScope says 99 — a notable 28% — delivered 10%-plus CAGRs during those five years.
- Mind you, five years ago during mid-2020, markets were low following the start of the pandemic…
- …and the even the FTSE 100 through the iShares FTSE 100 ETF (CUKX) has since delivered a 11% five-year CAGR:

- CLIM has previously delivered healthy long-term CAGRs. Annualised returns for the five years ending FY 2021 for example came in at between 12% and 17%:

- Perhaps attracted by those double-digit returns, CLIM then enjoyed four quarters of client-money inflows (Q2 2022 to Q1 2023):

- I am convinced CLIM will require double-digit CAGRs to appeal to potential new clients, who no doubt will question why bother with CLIM — or even active equity managers generally — when the S&P 500 and the revitalised FTSE 100 have been clocking up 10%-plus CAGRs.
- CLIM’s relative returns encouragingly improved following this H1.
- During Q3 2025 (January to March 2025), CLIM’s strategies returned an estimated 2.9% while the S&P 500 slipped 6.2% (see Q3 2025 funds under management).
Funds under management: CLIM discount engagement
- This H1 acknowledged the “expansion of passive options” had led to UK investment trusts trading at “wide” discounts to NAVs:
“Discounts in UK-listed investment trusts… remain wide as the expansion of passive options in the UK marketplace provide competition to the c.150- year-old investment trust industry.“
- This H1 also noted discounts on UK investment trusts remained at levels last seen during the 2008 banking crash:

- CLIG reckoned the “wide” discounts were “attractive“…
“Predicting markets is like predicting the weather, but what we can look at and extrapolate from with some confidence is closed-end fund (CEF) discounts and these continue to be quite wide, providing attractive entry points.”
- …and said investment-trust boards had been engaged to help close the discounts:
“In addition, our investment teams at CLIM and KIM continue to successfully engage in corporate-governance initiatives, working with CEF Boards to narrow discounts.“
- CLIG’s Annual Stewardship Reports recap CLIM’s efforts to “address persistently wide discounts“:
[CLIG Annual Stewardship Report 2024] “Our engagement strategy is to be patient but persistent advocates of sound corporate governance principles that we believe will help create long term value for our clients. The overriding objective is to encourage boards to take action to address persistently wide discounts.“
- Engagement efforts during 2024 appeared to lead to several mergers:
[CLIG Annual Stewardship Report 2024] “CLIM believes that CEFs which become too small to be cost effective or to implement effective discount control should seek a merger partner. Merger activity has picked up in recent years because larger funds are favoured by investors for their scale economies and liquidity advantages.
In 2024, Asia Dragon initiated a strategic review, in response to a merger proposal from Ashoka WhiteOak, which ultimately resulted in a merger with Invesco Asia. A defining characteristic of this transaction was Invesco Asia’s offer to propose an unconditional redemption option after three years which provides certainty regarding the eventual discount outcome.
Other mergers that received CLIM’s backing last year included Fidelity China Special Situations’ combination with abrdn China Investment Company and two in-house mergers: JPMorgan Japanese Investment Trust (JFJ) with JPMorgan Japan Small Cap Growth & Income (JSGI); and Henderson European Focus (HEFT) with Henderson Eurotrust (HNE). Further merger activity is expected in 2025.”
- Engagement efforts during 2024 also appeared to lead to several tender offers:
[CLIG Annual Stewardship Report 2024] “All CEFs should offer performance conditional tender offers (CTOs) which provide for a partial return of capital, typically 25%, at close to NAV in the event that NAV performance falls short of the target benchmark over a three to five year investment cycle.
Several new CTOs were announced in 2024 of which JPMorgan Emerging Markets was the most significant. Templeton Emerging Markets also renewed its CTO for a second five year term, having avoided a tender by outperforming over the previous five years. Henderson European Trust, the on-going entity that resulted from the HEFT – HNE combination, introduced a CTO as part of the merger terms. Finally, JPMorgan European Discovery (JEDT) implemented an immediate 15% tender with a further 15% CTO following a management change.”
- CLIG’s latest stewardship report noted US fund manager Saba Capital giving a “wakeup call” to the UK trust sector.
[CLIG Annual Stewardship Report 2024] “CLIM has urged boards to increase their buybacks as discounts have widened and the response has mostly been extremely positive. Buybacks reached a new record in 2024 but CLIM cannot claim all the credit.
Saba’s high-profile activism campaign in the UK investment trust sector has been a wakeup call to all boards about the imperative for robust discount control.”
- During recent years, Saba has acquired significant stakes in numerous UK trusts and requisitioned general meetings at seven to appoint new directors and “improve shareholder value“:

- According to the media, the requisitioned meetings “triggered fury and an industry-wide defensive effort“…
[CityAM January 2025] “US hedge fund Saba Capital triggered fury and an industry-wide defensive effort when it launched an activist campaign against seven UK investment trusts last month.“
- …with trust boards wanting to “avoid a situation like Saba becoming involved“:
[FTAdviser January 2025] “When Saba Capital, a US hedge fund business, began to appear on the registers of UK investment trusts it caused panic, with one industry participant saying “boards don’t mind what they have to do, as long as they avoid a situation like Saba becoming involved”.
- A trust director or manager losing a vote to an activist such as Saba would more than likely find his/her City career terminated.
- Saba may well have lost all seven of its requisitioned votes. But judging by the volume of media coverage and the industry’s follow-up petition, Saba appears to have achieved more to encourage UK trusts to close their discounts during the last 18 months than CLIM and others have achieved during the last 18 years.
- Indeed, I am sure UK trust boards do not have the same sense of urgency when engaging with CLIM in private as they do when engaging with Saba in public.
- I therefore speculate whether CLIM should become more assertive and public with its engagements and investments.
- After all, CLIM does own sizeable chunks in many trusts. Of those 14 listed by ShareScope, CLIM held 15%-plus stakes in nine that could dominate any shareholder vote:

- Saba has earned 11% annualised returns — versus CLIM’s 5-8% — by taking significant stakes in discounted trusts and then requisitioning general meetings to “improve shareholder value“:

- Further evidence of the power of requisitioned meetings comes from Achilles (AIC), a UK investment trust established earlier this year to “unlock value” within other trusts through an “active role“:
[Achilles July 2025] “The Company will seek to identify underperforming or undervalued assets and unlock value. The Company will take an active role in engaging with the boards and the investment managers of investment companies within its portfolio. This may include advocating selling the entire company or any or all of its assets, changes in strategy or restructuring“
- Early progress at AIC has been impressive. Just one month after listing, the trust requisitioned a shareholder meeting at Urban Logistics (SHED) to oust three directors:

- A few weeks after the requisition, SHED conveniently revealed a bid and the meeting requisition was dropped.
- SHED’s shares were 114p when AIC floated and were last seen at 156p before their cancellation:

- The SHED investment helped AIC’s shares gain 8% during their first four months of trading:

- Unlike CLIM’s funds, AIC is happy to hold cash as it trawls for trust bargains:
[Achilles July 2025] “The Company may hold cash in its portfolio from time to time to maintain investment flexibility. There is no limit on the amount of cash which may be held by the Company from time to time.“
- CLIG’s 2024 annual stewardship report summarised CLIM’s protest votes…
[CLIG Annual Stewardship Report 2024] “In total CLIM voted in 2024 on 1,993 resolutions at 243 meetings. We opposed 8% of resolutions, mostly against directors who lack independence due to excessive tenure or, less frequently, a connection with the investment manager.“
- …and revealed engagement with 60 different trust boards:

- As far as I am aware, CLIM has participated in only three public disagreements with investee trusts:
- Samsung C&T during 2023/2024;
- Lazard World Trust during 2018, and;
- icapital.biz Berhad during 2017.
- An irony of CLIM’s activism with investee boards is CLIG’s largest shareholder appears to have been actively reshaping CLIG’s own board (see Boardroom).
Funds under management: KIM investment performance
- This H1 described some of KIM’s investment performances as “exceptional“:
“Exceptional KIM performance deserves to be highlighted as well, particularly the team’s Taxable Fixed Income and Tax-Sensitive strategies, comprising c.26% of Group FuM. These products outperformed their indices by 6.2% and 7.7% in 2024, a staggering feat in fixed income.
- KIM’s website summarises the division’s longer-term investment progress.
- Certainly KIM’s fixed-income strategies have performed relatively well over time:


- Fixed-income returning 4-6% CAGRs during the last 10-15 years (after fees) does not seem too horrendous given US treasuries typically yielded less than 3% for the majority of that time.
- The fixed-income efforts have assisted KIM’s cash-management service, which looks to have performed well with 5-6% annualised returns:

- Earning 4-6% annualised returns from fixed-income and cash (after fees) raises awkward questions about whether CLIM’s 5-8% CAGRs from equities (before fees) deliver sufficient ‘risk premiums’.
- Indeed, KIM’s Conservative Balanced approach — with 10-50% in equities and the balance in bonds/cash — has impressively delivered CLIM-like 8% annualised returns during the last ten years:

- Note that KIM’s Equity Management strategy has returned between 8% and 14% annualised over the last five, ten and 15 years:

- 8-14% annualised has not beaten the S&P 500, but has matched Saba’s ETF and outrun CLIM’s strategies.
- Board remarks at the 2024 AGM revealed KIM enjoyed a more flexible approach to asset management compared to CLIM. KIM can apparently hold “dry powder” ETFs when discounts are narrow and reinvest in more attractive opportunities when discounts become wider.
- All told, KIM does appear to have inherently stronger investment returns versus CLIM… and as such may find capturing new client money somewhat easier than CLIM (see Funds under management: capacity, marketing and growth plans).
- Following this H1, KIM’s portfolios returned an estimated 1.1% during CLIG’s Q3 2025 (January to March 2025) (see Q3 2025 funds under management).
Funds under management: capacity, marketing and growth plans
- This H1 reiterated further client money of $6b could be accepted:

- An extra $6b would increase this H1’s FuM of $9.9b by 60%.
- The following H1 snippets explained how CLIG may secure new mandates:
“Our business development team was active in increasing outreach to clients and prospects and launched an effort to enhance communications.”
…
“It is our performance record that will assist with client retention and in converting prospects into long-term supporters.“
…
“The marketing team is focused on raising assets based on the good long-term performance of the Group’s investment management subsidiaries.“
…
“Client interest for our Listed Private Equity (LPE) strategy, managed by City of London Investment Management (CLIM) where an investment trust structure provides liquid access to private equity exposure with the transparency of regularly published net asset values, remains strong.”
…
“Over the six months, we have continued to bolster the marketing and relationship management teams at KIM, in order to find new avenues for growth and clients.”
- The aforementioned $564m client-money outflow during this H1 suggests CLIG’s marketing efforts must become more effective.
- This H1 said increased marketing efforts had led to increased business travel:
“Business travel increased during the period with growth in our marketing efforts as the team met clients and prospects. To offset the impact of increased business travel, the Group will continue with its carbon offset programme.”
- The preceding FY revealed business-travel emissions had more than doubled during the year (points 8a, 8i and 8j).
- Despite the doubling of business travel (or at least the doubling of business-travel emissions) for marketing purposes, the preceding FY suffered a net $320m client-money outflow:

- The preceding FY’s $320m client-money outflow occurred despite optimistic talk of recruiting new people…
[FY 2023] “The integration of KIM is now complete. What remains is to leverage the strengths of the Group in order to raise new FuM across the Group. In this regard, we created a new position – Head of Corporate Partnerships – to deepen our existing client relationships, particularly as baby boomers transfer wealth to the next generation, and build new partnerships with professional organisations. This individual, who has over twenty years of experience in the field, is also responsible for branding opportunities, unique client experiences, and increasing the profile for the Group.”
- …and of marketing activity picking up:
[H1 2024] “Marketing and sales activity picked up significantly in January 2024 as clients and prospects review their investment allocations. The Group is focused on new mandates in a number of CLIG’s asset classes with very good long-term performance as [closed-end fund] discounts are at compelling levels. Our business development team is actively reaching out to clients and prospects to discuss the current opportunity-rich environment“.
- Reflecting how earlier marketing efforts had not translated into incoming FuM, this H1 quietly admitted the expected pace of winning new CLIM money had reduced.
- CLIG’s dividend-cover assumptions (see Valuation) indicated the expected extra CLIM FuM for FY 2026 to be $100m:

- In contrast, the preceding FY — and the three FYs before that! — had expected annual extra CLIM FuM to be $250m:

- An extra $100m is equivalent to only 1.7% of total H1 CLIM FuM of $6.0b.
- Expecting new CLIM client money of $100m a year is not completely outrageous; CLIM attracted net inflows of $140m during FY 2016, $186m during FY 2018, $334m during FY 2020 and $212m during FY 2022.
- Mind you, the $970m net money withdrawn from CLIM during FY 2023, FY 2024 and this H1 does make CLIM receiving a net $100m anytime soon difficult to imagine.
- This H1 emphasised CLIG is an “investment-led organisation“:
“CLIG is an investment-led organisation, focused on providing our teams with the resources they need to continue to provide strong long-term performance for our clients.”
- The comment implied good investment performance alone should be enough to attract new clients.
- However, ten years of ‘benchmark-beating’ CAGRs combined with significant outflows of client money suggest prospective clients consider factors beyond past performance.
- Certainly with CLIM, reasons for the lack of new mandates may also include:
- Buying investment trusts at a discount is a boutique/contrarian/unglamorous approach that not every institution wants (or even understands);
- CLIM’s heritage area of expertise — emerging markets — has underperformed global markets during the last 15-plus years, and;
- The group’s “team approach” does not lend itself to the inherent promotional advantages of employing a super-star investor (see KPI).
- CLIM markets its funds to industry consultants, who then advise their end clients on the merits of those funds. This consultant (“gatekeeper“) process was explained during the Q1 2025 webinar:
[Q1 2025]
“We’re going out into the market with a very focused approach, which is to go through third parties, rather than having a massive marketing team across the United States, which is very expensive, and for different points in the cycle will have nothing to do because no one will pick up the phone.
If you look at the institutional marketplace in the United States, the consultant channel, they are the gatekeepers for those investors. They are constantly monitoring managers, providing updates, meeting with them, undertaking due diligence and ultimately, when a client needs a particular manager for a particular strategy, they will pull those managers into a finals presentation and then subject to that presentation, they’ll choose one, two, three or more managers depending on what their needs are.
That’s a very efficient way to market because you have a one-to-many relationship. You’re going through one consultant and you’re being opened up once you’re on their approved list to all of those underlying clients.“
- The webinar also claimed good past performance was enough to raise money through consultants:
[Q1 2025]
“And so with the performance that we’ve seen, which is good, very long-term, first or second quartile performance, that’s what the consultants and third parties are looking for. And then ultimately, if you can keep that performance going, if you can keep your investment team together and motivated and focused on adding alpha, you’re going to raise money over time.”
- This H1 spotlighted “strong” interest towards CLIM’s fledgling Listed Private Equity approach:
“Client interest for our Listed Private Equity (LPE) strategy, managed by City of London Investment Management (CLIM) where an investment trust structure provides liquid access to private equity exposure with the transparency of regularly published net asset values, remains strong.”
- This H1 reiterated KIM could attract new client money of $50m during FY 2026:

- An extra $50m is equivalent to only 1.3% of total H1 KIM FuM of $3.9b.
- Expecting new client money at KIM remains optimistic, given the division has suffered an aggregate $572m net withdrawal following the October 2020 merger:
- This H1 revealed KIM paid commissions of $978k to external investment advisers:

- Board comments during the 2024 AGM reiterated the importance of external salespeople on commission to KIM’s progress:
[AGM 2024] “In my 21 years at KIM, we never had a real high-producing salesperson. It was always third parties slowly bringing in business“.
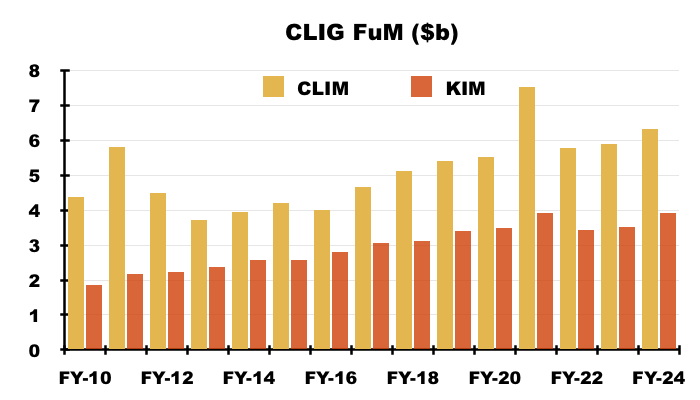
- Assisted by commission payments, KIM FuM has gained 121% versus CLIM FuM up 44% between FY 2010 and the preceding FY:
- Perhaps CLIM should re-adopt an external introducer that is incentivised through commission. CLIM previously employed North Bridge Capital to help promote its funds, until marketing was brought in-house during FY 2009.
- Following this H1, CLIG’s Q3 2025 update cited opportunities for “independent distribution partners” to sell CLIM funds outside the United States (see Q3 2025 funds under management).
- Note that KIM’s aggregate $572m net client-money outflow since the merger does indicate commissions alone are not the answer to finding extra FuM.
Funds under management: fee rates
- This H1 did not mention fee rates.
- But H1 revenue gaining 9% and average monthly H1 FuM advancing 12% indicates income per $1 of client money declined versus the comparable H1.
- The preceding FY confirmed the net fee rate had dropped three basis points to 69 basis points:
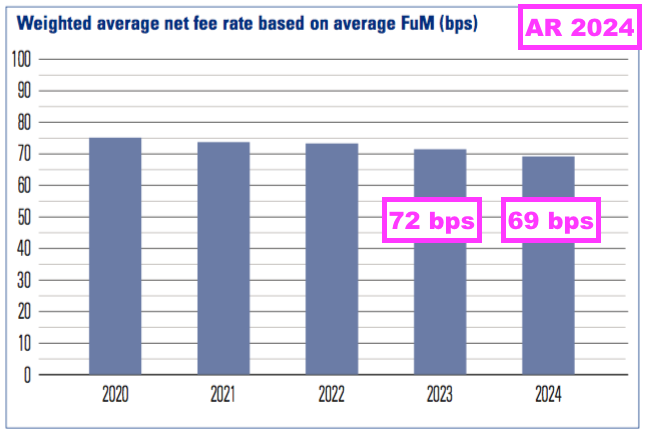
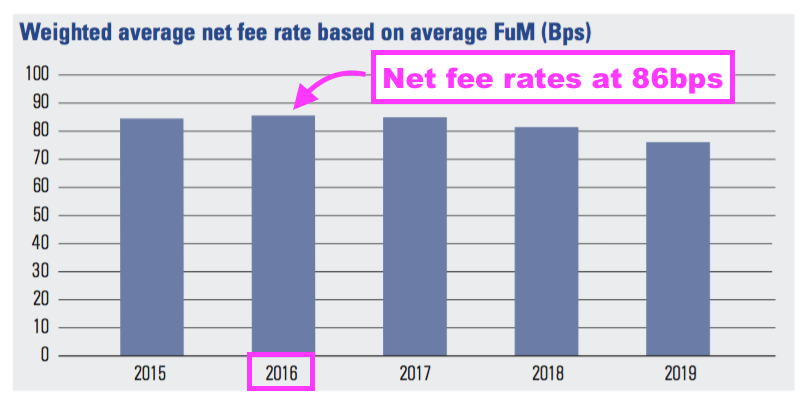
- CLIG’s net fee rate has been declining for some time. The rate was 86 basis points during FY 2016:
- Note that CLIG always quotes a net fee rate, which is based upon client payments less commissions and custody charges.
- I prefer measuring CLIG’s gross fee rate, which compares revenue without any subtractions as a proportion of average monthly FuM.
- My gross fee calculations show CLIG earning 0.72% on this H1’s average $10.3m FuM:

- For perspective, my gross fee rate was 0.80% for H1 2021, 0.90% for H1 2018 and 0.94% for H1 2016.
- CLIG has never disclosed fee rates for any of its strategies, and they may in fact fluctuate over time as clients renegotiate their own particular terms.
- But the general shrinking-fee trend has been due primarily to clients shifting from the higher-fee EM approach to a lower-fee Other approach. The preceding FY noted the aforementioned net-fee reduction to 69 basis points was due to lower EM FuM:
[FY 2024] “Changes in fee rates, product and investor mix are the principal factors that impact the weighted average rate. In general, the change is on account of a marginal reduction in the proportion of CLIM’s assets in the EM strategy from 61% in 2023 to 56% in 2024.“
- Fees can have a significant impact on returns. For example, investing $1m over ten years at 7% every year gives:
- $1,967k with fees of 0%
- $1,954k with fees of 0.07% as per that S&P 500 ETF (CSPX), and;
- $1,839k with fees of 0.72% as per CLIG.
- I remain convinced prospective CLIG clients have baulked at the prospect of paying fees of 72 basis points for single-digit returns, when tracker alternatives can levy fees at just seven basis points (or less) and have delivered double-digit returns.
Financials: margin and employees
- This H1 provided a confusing commentary about costs.
- CLIG looks set to reduce costs by $3m…
“From a cost reduction perspective, we are on track to reduce our costs by c.$3 million on an annualised basis.“
- …which was an upgrade on the $2.5m cited by the preceding FY:
[FY 2024] “Management has plans in place for cost reductions of c.$2.5 million over the next financial year. “
- However, this H1 also noted administrative expenses gained 6%:
“We continue to review expenses across the Group. Total administrative expenses for the six months ended 31st December 2024 were c.6% higher at $23.6 million as compared to $22.2 million for the six months ended 31st December 2023. The increase primarily relates to higher legal & professional fees, additional marketing resources, an increase in travel costs to meet clients and prospects, and the impact of US dollar weakening over costs denominated in sterling.”
- I am not sure exactly which costs CLIG is reducing to achieve that $3m saving, when total expenses are increasing.
- This H1 reiterated 32% of expenses were denominated in GBP and therefore subject to an adverse USD conversion:
“However, c.32% of Group overheads are incurred in sterling that are subject to USD/GBP currency rate fluctuations. On average, US dollars weakened by c.2% against sterling to 1.287 for the six months ended 31st December 2024 from 1.256 for the six months ended 31st December 2023. The weaker US dollar meant that our sterling-denominated expenses cost more in dollar terms.”
- GBP:USD advancing to the recent 1.35 means GBP-denominated expenses are likely to cost more in USD terms during the subsequent FY 2026.
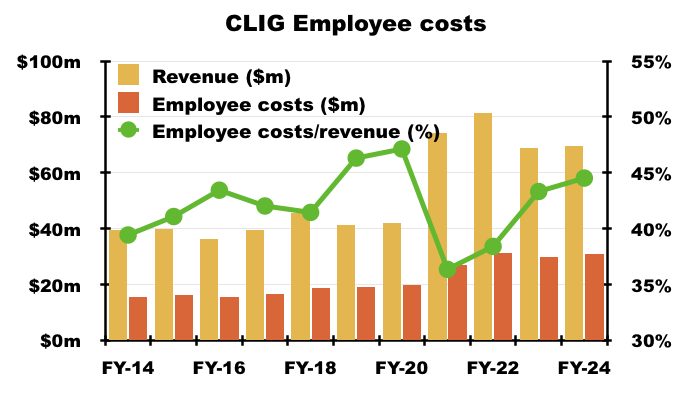
- CLIG’s largest expense is its workforce, the cost of which during this H1 increased 3% to absorb 42% of H1 revenue:

- Employee costs absorbing 42% of revenue compares to 44% for the comparable H1 and is the lowest proportion since KIM employees appeared to join CLIG’s profit-share scheme during FY 2022:

- Wishful thinking perhaps, but I am hopeful employee costs can be maintained at close to 42% of revenue.
- Prior to the KIM merger, employee costs captured 47% of revenue and were seemingly headed towards 50%:
- CLIG’s profit-share scheme effectively funds staff bonuses and allows up to 30% of pre-profit-share profit to be distributed among employees.
- This H1 paid 25.1% of pre-profit-share profit as profit share, versus 24.9% for the comparable H1:

- The preceding FY paid 27.0% of pre-profit-share profit as profit share, versus 26.7% for FY 2023.
- CLIG has never really clarified how the profit-share proportion is calculated, and in theory the profit-share payment could be maintained by lifting the proportion towards 30% while pre-profit-share profit drifts lower.
- CLIG’s dividend-cover template from the preceding FY suggested CLIM would reduce its FY 2025 overheads by 6%:

- But this H1 suggested CLIM’s FY 2025 overheads would not change:

- This H1 also indicated group overheads for FY 2026 would reduce by 1%.
- Annual overheads run currently at almost $29m, and I can’t correlate this 1% overhead reduction to the aforementioned $3m savings.
- The lower proportion of revenue absorbed by employee costs helped this H1’s operating margin (excluding merger amortisation) to improve to 39% versus the 38% witnessed during the comparable H1:

- Converting 39% of revenue into profit remains very healthy, although not as healthy as the 47-50% witnessed immediately following the KIM merger.
- CLIG’s margin could be chipped lower were fee rates to reduce further, overheads to creep higher and new client FuM to remain elusive.
- At the moment a 39% margin should sustain the present 33p per share annual dividend at 1.0x cover based on this H1 and the preceding H2. Here are my sums:
- Trailing twelve-month revenue of $72.6m with a 39% margin = $28.3m operating profit;
- Plus net interest of $1.2m less tax of 25% = earnings of $22.1m, and;
- Divided by 48.9m shares (share count less EBT shares) = $0.45/share or 33p per share at the recent GBP:USD 1.35.
- On the same basis, CLIG’s 1.2x dividend-cover ambition may actually require an operating margin beyond 45%.
Financials: cash flow and balance sheet
- CLIG’s cash flow also projected a very tight cover for the 33p per share annual dividend assuming GBP:USD stays at 1.35.
- For this H1 and the preceding H2:
- Trailing twelve-month net cash generated from operating activities was $23.6m;
- Less capex, lease liabilities and EBT purchases of $0.9m gives free cash flow of $22.7m, and;
- Divided by 48.9m shares (share count less EBT shares) = $0.46/share or 34p per share at the recent GBP:USD 1.35:

- Minimal requirements for working capital and capex have always assisted CLIG’s cash conversion.
- However, cash flow does suffer two longer-term niggles: tax and EBT expenditure:
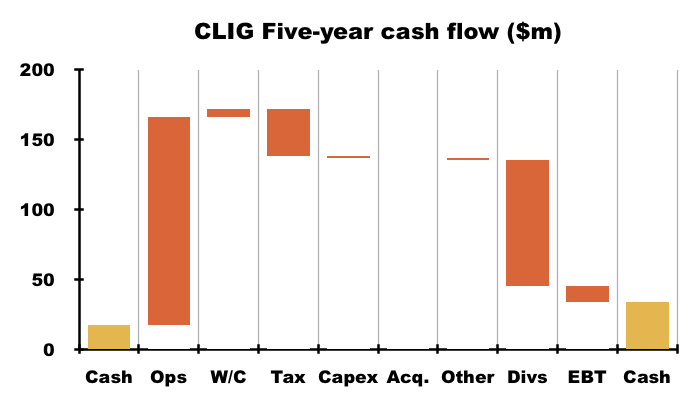
- Between FY 2020 and the preceding FY for example, CLIG:
- Paid $34m tax but charged only $27m tax to the income statement, and;
- Paid a net $12m to acquire shares for the employee benefit trust (EBT) but charged only $6m as share-based payments to the income statement.
- Both niggles reflect legitimate accounting, but during the same five years have arguably flattered aggregate adjusted earnings of $111m by $13m.
- This H1’s cash position lost $3.1m to $30.2m after free cash flow of $10.8m funded the preceding FY’s final dividend of $13.9m .
- H1 cash of $30.1m is equivalent to a significant 42% of the aggregate revenue achieved during this H1 and the preceding H2:

- CLIG’s cash position has not declined to below 30% of twelve-month revenue since at least FY 2014.
- CLIG’s cash position is net cash, as the group has never operated with conventional debt. Nor is the group saddled with defined-benefit pension obligations.
- I presume CLIG maintains a healthy net cash position in part to reassure clients the group’s operations will not be disrupted by major market downturns.
- How much of the cash — if any — can be used to help shore up the dividend remains to be seen.
- The cash balance averaged $32.0m during this H1 and — through KIM’s cash-management service — generated useful interest of $815k, equivalent to an annualised 5.1% rate.
- CLIG’s balance sheet implies the business remains an inherently capital-light operation.
- For this H1, conventional property and equipment plus net working capital stood at less than $2m:

- Such minimal ‘operating assets’ indicate CLIG should not need to retain significant amounts within the business were FuM to significantly increase.
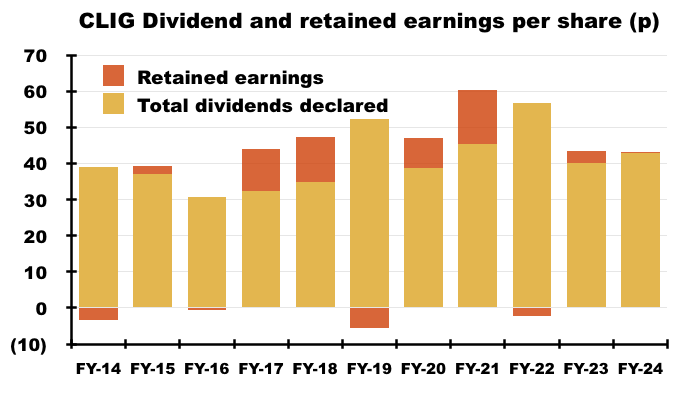
- Between FY 2014 and the preceding FY, CLIG in fact declared aggregate adjusted earnings of 479p per share, of which 411p were paid as ordinary or special dividends and the remaining 68p per share retained within the business:
KPI
- This H1 confirmed CLIG failed to meet its five-year CAGR KPI of 7.5%-plus:
“We retain the share price KPI to show the total return of CLIG over a market cycle. The goal of this KPI is for the total return (share price plus dividends) to compound annually in a range of 7.5% to 12.5% over a five-year period.
For the five years ended 31st December 2024, CLIG’s cumulative total return was 35.1%, or 6.2% annualised.”

- The KPI was introduced during FY 2019 and is said to “present a challenge for the management team” (point 15c).
- CLIG failed to achieve the KPI for the five years to the preceding FY, which blamed the KPI failure on external factors such as the shift to index trackers…
[FY 2024] “CLIG targets a total return (share price plus dividends) to compound annually in a range of 7.5% to 12.5% over a five-year period. For the five years ended 30th June 2024, the total return was 34.7%, or 6.2% annualised (source, Bloomberg). The environment for UK listed asset managers has been negative for the past three years due to the broader shift of underlying investors to passively managed vehicles.”
- …and soft markets:
[FY 2024] “For the five years ended 30th June 2024, CLIG’s cumulative total return was 34.7%, or 6.2% annualised. CLIG’s management team is monitoring this development, as the broad market declines in the first half of FY 2024 precipitated this underperformance.”
- Board remarks during the 2024 AGM did not suggest the KPI failure would lead to any repercussions. Attendees were told:
- There were generally no failings;
- The team has been working harder than ever, and;
- “We’ve had a rough patch and are working our way back”.
- Following this H1, CLIG has since failed to meet the KPI for the five years to FY 2025. Here are my calculations:
- The starting share price on 01 July 2020 was 383p;
- The finishing share price on 30 June 2025 was 346p;
- Dividends of 176.5p per share were collected, and;
- The total return was 36% or approximately 6.4% per annum.
- The 7.5%-plus CAGR KPI should really be very achievable given CLIG’s dividend typically yields at least 6%:

- The preceding FY reiterated CLIG does not employ individual KPIs:
[FY 2024] “We are focused on fostering a team approach across the Group, discouraging the ‘cult of the individual’ and the risks associated with a star culture. The Group therefore takes the view that individual KPIs are not appropriate for a business that employs a team-based approach, and that individual KPIs could prove divisive and introduce unnecessary risk”
- The absence of individual KPIs perhaps explains why CLIG has failed to meet its own group KPI: individual employees can hide within the “team approach” and seemingly under-perform without consequence.
- I am pleased the board has recently taken action following the ongoing failure to meet the group’s KPI (see Boardroom).
Q3 2025 funds under management
- Outlook comments from this H1 reckoned CLIG’s fund performances could help attract new clients:
“CLIG continues to strive for excellence for all its stakeholders while exercising care and patience in managing the business. Management and your Board continue to look for ways to improve processes and efficiency at your Company. Investment performance for the rolling six months and the calendar year was strong in the large majority of the Group’s investment strategies. It is our performance record that will assist with client retention and in converting prospects into long-term supporters.“
…
“As an active investment manager, our priority of delivering investment outperformance against a relevant benchmark for our clients is paramount. Throughout the calendar year 2024, our investment teams delivered outperformance for our clients, which sets the stage for our marketing and client servicing efforts in calendar year 2025. CEF discounts remain wide, which allow for existing and potential clients to understand and evaluate the value in the investment universe. Additionally, the potential for corporate governance activity provides a compelling opportunity.“
- Following this H1, April’s Q3 2025 update revealed FuM stable at $9.9b:

- Q3 2025 was bolstered by investment gains of $218m, which equated to a 2.2% return versus FuM at the end of this H1. CLIM’s Q3 gains equated to a 2.9% return while KIM’s Q3 gains equated to a 1.1% return.
- The S&P 500 ETF (CSPX) in contrast lost 6% during the same three months:

- CLIG’s funds enjoying positive quarterly returns when the S&P 500 has declined is highly unusual.
- Since CLIG started disclosing quarterly FuM movements, the only other time CLIG has enjoyed positive quarterly returns when the S&P 500 has declined was Q3 2018, when CLIG reported a 0.2% gain while the S&P 500 fell 2%:

- The hope perhaps is CLIG can continue to register positive returns while the S&P 500 continues to falter. After all, clients will always appreciate anyone who can make them money when most people are losing money.
- Mind you, the S&P 500’s 12% rebound during CLIG’s Q4 2025 may not have persuaded prospective clients to ditch the all-conquering index just yet.
- Despite this H1’s optimistic outlook commentary and CLIG’s positive investment returns versus the downward S&P 500, Q3 2025 suffered net client withdrawals of $212m to mark the ninth quarterly outflow during the last ten quarters:

- Net client withdrawals have now amounted to $1.0b during the last four quarters and $2.1b since FY 2021.
- The Q3 update blamed “uncertainty relating to US tariff policy” for CLIM Q3 outflows of $159m:

- CLIM clients have now withdrawn a net $1.5b since FY 2021.
- KIM clients have meanwhile now withdrawn a net $625m since the merger:

- The Q3 update included the most significant text to emerge from CLIG’s quarterly statements for years:
[Q3 2025] “We are redoubling our marketing efforts as closed‐end fund discounts are wide and we see opportunities to expand Group investment sales outside of the US with international distribution partners.”
- At last! CLIG has finally recognised how little its marketing efforts have achieved… and now seems open to re-employing external parties to capture new clients!
- CLIG’s website shows FuM advancing $374m to $10.3b following the Q3 update:

Boardroom
- Following this H1 and the Q3 2025 update, CLIG announced the departure of its chief executive:
[RNS June 2025]
“The Board announces that Tom Griffith will leave the Board and his role as Chief Executive Officer by July 2025. The Board and the Company are involved in a planned succession process and further information will be forthcoming.
Rian Dartnell, Chairman of CLIG, commented:
“On behalf of the Board, I would like to express our deep appreciation to Tom for his contributions. We anticipate a smooth transition with CLIG’s executive team working with Tom over a number of months.”
The Company reconfirms its 22 April 2025 Trading Update and looks forward to providing further details on its continued positive fourth‐quarter trading performance in the upcoming year‐end update, expected on 24 July 2025.”
- I am sure the chief executive did not make the decision to leave the board, given he:
- Would undertake only a further three weeks in his role after the announcement;
- Did not contribute a farewell quote to the RNS, and;
- Had no successor lined up.
- A statement earlier this month then confirmed the chief exec’s departure:
[RNS July 2025]
“Further to the announcement on 10 June 2025, the Company confirms that Tom Griffith left the Board and his role as Chief Executive Officer on 1 July 2025. Tom will remain with the Company as a Senior Advisor through September 2025. The Board and the Company are involved in a planned succession process and further information will be forthcoming.”
- Chief execs tend not to depart suddenly when things are going well, so I am braced for adverse trading news.
- I can’t rule out Q4 2025 experiencing another huge outflow of client money, costs not being controlled and CLIG no longer maintaining the 33p per share annual dividend.
- Wishful thinking perhaps, but perhaps the board has acted decisively before the dividend hits trouble.
- After all, my blog has highlighted CLIG’s weaknesses for some time now. And failing to meet the aforementioned five-year KPI should have emphasised to all shareholders that fresh leadership was required.
- The former chief exec had worked at CLIG since 2000. He was first appointed to the board during 2004 as chief operating officer and was then promoted to chief exec during 2019.
- I imagine the skill-set needed to run a fund-management group has changed significantly during the last 20 years.
- Tasks for the new boss to revitalise the group include:
- Ensuring CLIM’s investment returns can compete against passive alternatives;
- Enhancing CLIG’s marketing activities, and perhaps employing “distribution partners” within CLIM’s core US market as well as outside the US;
- Establishing a better link between employee pay/profit-share versus the value created for shareholders;
- Assessing the group’s main KPI, and whether the “team approach” should be swapped for individual KPIs, and;
- Evaluating the dividend, and whether it should now be determined in USD and whether five-year cover should still be 1.2x.
- The contents of the new chief exec’s in-tray must surely mean the successful candidate has to be recruited from outside CLIG.
- The departure of the chief exec is the latest in a long run of boardroom movements after George Karpus demanded the entire board be replaced at the 2023 AGM:
[George Karpus 2023] “I believe the future board should consist of individuals with different skill sets that believe in the great future of CLIG… They should have a combination of experience and skills, so they do not have to rely on outside consultants and advisors…
This board should be replaced with a seasoned group of directors that understand the enormous potential of CLIG and that can guide the management in profitably growing the company.”
- Mr Karpus founded KIM, became a CLIG non-executive following the CLIG/KIM merger, left CLIG’s board during 2023, retains a 31.5% personal CLIG shareholding and speaks for a further 6.3%:

- CLIG’s entire board has not been replaced, but has undergone notable changes since Mr Karpus issued his demand:

- Former chairman Barry Aling had already announced his retirement before the 2023 AGM, and to his credit attended the 2024 AGM as an ordinary shareholder.
- The current chairman has now served more than nine years on the board (which exceeds corporate-governance best practice) and the preceding FY stated a succession plan was underway:
[FY 2024] “Succession planning shall remain a key priority for the Nomination Committee with a particular focus on the process for identifying a new Chair… in due course and a new independent Non-Executive Director to replace Tazim Essani who will not be seeking re-election at the AGM in October 2024. As mentioned, we are progressing with the selection of a new NED to join the Board.“
- A new chairman will then mean only one director, non-exec Peter Roth, will have not stepped down after Mr Karpus demanded the entire board be replaced at the 2023 AGM.
- I am not convinced about Mr Roth’s commitment to outside shareholders following his 2024 AGM comments.
- Sarah Ing, a former “top-rated equity research analyst covering the financial sector“ was appointed a non-exec last year and really ought to be on top of CLIG’s weaknesses.
- Ben Stocks, the former chief exec of Porvair (PRV), was appointed as a non-exec following this H1 during April:
[RNS April 2025]
“City of London Investment, a leading specialist asset management group offering a range of institutional and retail products investing primarily in closed-end funds, is pleased to announce that Ben Stocks will be joining the Board as an Independent Non-Executive Director on 7 April 2025. This appointment follows a thorough search process undertaken by the Nomination Committee of the Board.
Ben brings extensive leadership experience from his 27-year tenure as an Executive Director and the CEO of London Stock Exchange-listed Porvair PLC, where he successfully led the company’s growth into a global business with operations in the USA, UK, Europe and Asia.
In his new role, Ben will serve as a member of CLIG’s Audit and Risk, Nomination and Remuneration Committees.
Rian Dartnell, Chairman of CLIG, commented:
“I am very happy to welcome Ben Stocks to the CLIG Board. His strategic acumen, combined with his ability to build high- performing teams and foster a growth mindset, make him a valuable addition. We look forward to benefiting from Ben’s wisdom, sound judgment, and ‘can-do’ attitude as he contributes to CLIG’s continued success.”
Ben Stocks commented:
“I am delighted to be joining CLIG to support the Board and management team in delivering growth and enhancing value for clients, employees and shareholders.”
- PRV designs and manufactures specialist filtration systems, particularly for the aerospace industry. The CV of Mr Stocks is therefore refreshingly different from the financial backgrounds typical of CLIG non-execs.
- Mr Stocks led PRV for a very commendable 27 years. The 27-year PRV share price suggests Mr Stocks knows about persisting through trading difficulties and rebuilding shareholder value:

- I am not sure whether the recent appointments of Mrs Ing and Mr Stocks alongside the sudden search for a new chief exec are a coincidence.
- CLIG’s Q4 2025 update due later this month, or more likely the FY 2025 results due in September, should shed more light on the decision to recruit a new chief exec.
Valuation
- This H1 supplied a revised dividend-cover template showing a new earnings projection for FY 2025.
- The preceding FY had anticipated retained FY 2025 adjusted earnings of £3.4m or approximately 6.7p per share:
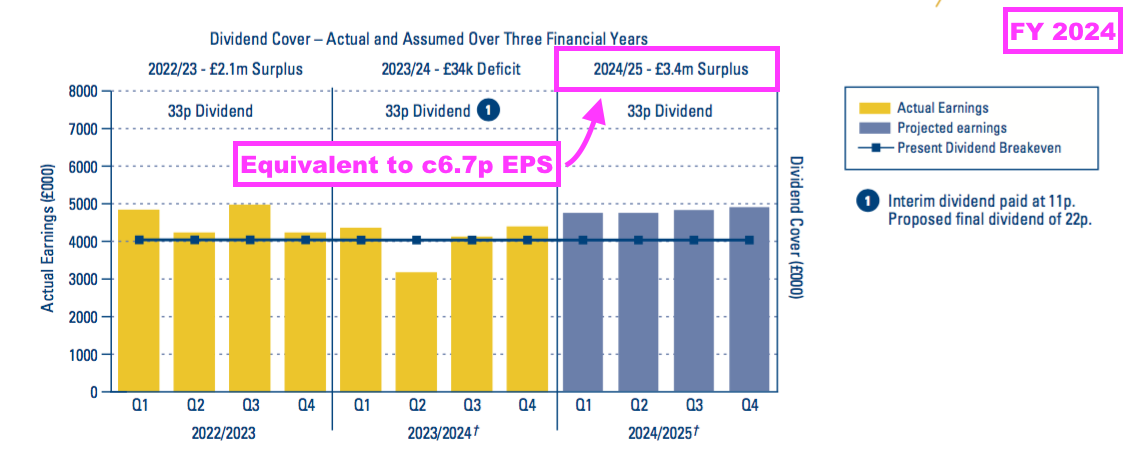
- But this H1 predicted retained FY 2025 adjusted earnings of £1.6m or approximately 3.1p per share:

- When added to the 33p per share annual dividend, retained earnings of 3.1p per share indicates FY 2025 adjusted earnings might be 36.1p per share.
- Note that the dividend-cover template has applied a GBP:USD rate of 1.26 versus the recent 1.35…

- …which means CLIG’s actual retained USD earnings might translate into GBP retained earnings that are lower than the £1.6m shown within the template.
- I don’t understand why CLIG persists using GBP-denominated retained earnings within the dividend-cover template when the group’s reported earnings are now denominated in USD.
- The dividend-cover template would be more useful if the retained earnings were stated in USD, whereby shareholders can then translate that projection into GBP and compare that GBP translation to the 33p per share dividend.
- Note also the dividend-cover template now assumes 5% annualised market growth rather than 0% market growth:

- I believe the last time CLIG assumed positive market growth was H1 2016:

- Assuming 5% market growth rather than 0% market growth no doubt leads to an improved retained-earnings projection that in turn leads to an improved dividend-cover projection.
- With the trailing twelve-month dividend cover so tight, lifting the projected annualised market growth from 0% to 5% does appear a deliberate decision to flatter near-term dividend cover.
- This H1’s dividend-cover template introduced a projection for FY 2026:
- Predicted retained FY 2026 earnings of £3.1m equate to approximately 6.1p per share:
- When added to the 33p per share annual dividend, retained earnings of 6.1p per share indicates FY 2026 adjusted earnings might be 39.1p per share.
- I am not convinced FY 2026 will be anything close to 39.1p, given the £3.1m retained-earnings projection assumes:
- GBP:USD at 1.26 versus the recent 1.35;
- Market growth of 5%, and;
- Annualised net new CLIM/KIM client money of $150m.
- Adjusted earnings for this H1 and the preceding H2 were $0.45 per share giving 35.1p per share, but may have been 33.3p per share had GBP:USD averaged the recent 1.35 rather than the actual 1.28 during those twelve months.
- Maintaining cover on the 33p per share annual dividend therefore seems very touch and go.
- Using either 35.1p or 33.3p per share puts the 350p shares on a P/E of 10-11x — a multiple often witnessed during CLIG’s quoted history:

- The 9% trailing yield remains very high, but is not entirely unusual for CLIG:

- The recent 350p share price was first achieved during late 2007…

- …and the lack of capital appreciation over 17 years does suggest CLIG’s business strategy, investment style, industry position and/or employee talent are not quite what they should be.
- Nonetheless, the shares have generated a very generous income. For example, I first bought CLIG during 2011 at 355p and total payouts (ordinary and special) throughout the last 14 years have totalled 415p per share to recoup my initial investment.
- But sustaining the dividend has become increasingly uncertain, and I am hopeful fresh leadership from outside the group will not be afraid to consider radical action — in particular to improve client CAGRs and attract new customers — to uphold the payout.
- The saving grace with CLIG is 31.5% shareholder Mr Karpus, who thankfully through a series of “constructive meetings” has seemingly instigated — or at least encouraged — a number of positive board changes.
- While shareholders collect the 9% yield and await the appointment of the new chief exec, this H1 sadly reiterated CLIG’s ‘value trap’ credentials:
- Major new client mandates are still very elusive;
- Client withdrawals are still very persistent;
- Long-term client returns at CLIM are still quite modest;
- Client fees are still reducing yet costs are still advancing, and;
- Dividend cover is still under pressure.
Maynard Paton

Great analysis as always.
I’ve made a nice profit on CLIG trading between 300-400 whilst collecting the dividend but it’s days are numbered. Old fashioned business that can’t compete in todays markets.
I’ve fully exited. Good luck to all holders
Hi Bob,
“Old fashioned business that can’t compete in todays markets.” –> a very fair comment! Similar to the wider industry, CLIM has certainly been disrupted by index trackers and the S&P in particular. But will the S&P continue to grow at 20%pa forever led by a handful of shares? I am doubtful, but I recognise CLIM can’t just wait until the S&P falters and must undertake its own initiatives to win elusive clients. I am secretly hopeful ‘old fashioned’ investing will one day come back into fashion (as it did during March 2000).
Maynard
The adage of ‘if you wouldn’t buy it today you shouldn’t continue to hold it’ comes to mind with CLIG.
You’ve identified so many red flags in your write up that I was genuinely surprised by you “I continue to hold” statement.
I appreciate that businesses have their ups and downs, but I’m struggling to have much faith in CLIG in enacting any drastic reforms in the near future.
There are other opportunities requiring a good deal less hopium.
Hi Greig,
All fair points. The saving grace here is major shareholder George Karpus, who has clearly instigated various board changes to help revitalise the group, and particularly CLIM. Without Mr Karpus holding the board to account, I think I would have exited by now. Mr Karpus said at the 2023 AGM he thought CLIG could double in five years given the strengths of CLIM and KIM post-merger. Clearly that doubling will not happen in those five years, but Mr Karpus had grown KIM for 30+ years and must have seen some decent CLIM potential before agreeing to the CLIM/KIM merger.
I would like to think all the red flags I highlighted effectively led to the chief exec’s departure. The chief exec’s departure suggests the revamped board and/or Mr Karpus are willing to take action, and the prospect of new leadership offers hope of some fresh thinking and perhaps even ‘drastic reforms’. Let’s see.
Maynard
CLIG REVIEW
That is a very deep dive – and first rate – even by your standards, Maynard.
We have under two weeks to go until CLIG is due to provide a TU and statement of fourth quarter FUM. I hope that the company has managed to reverse the trend of outflows. However, I am not that optimistic, particularly having looked at Polar Capital’s recent results.
One other thought. When George Karpus made his 2023 AGM statement, he gave Tom Griffith (and Carlos Juste) a vote of confidence, in contrast to his concerns about the Board. I wonder if his views changed subsequently. The departure of Tom Griffith was decidedly abrupt.
Andrew
Hi Andrew
Ah yes, Mr Karpus said at the 2023 AGM:
“I am more confident today than I was three years ago that Tom Griffith and Carlos Yuste can lead this company in achieving excellent performance for clients, a wonderful place to work for employees and growth with dividends for shareholders“.
Although GK did abstain that year from voting for TG’s re-election. But then his voting at the 2024 AGM was supportive of all directors. Clearly something has happened since October. The hefty outflows of client money during this last H1 would not have helped. Nor would higher costs and the ever-tighter dividend cover. All told, I speculate GK had become increasingly frustrated at the lack of group progress since the merger (e.g. no CLIM/KIM cross-selling has ever occurred), especially given his 2023 AGM statement reckoned CLIG could double over five years. TG therefore had to go in order for the business to stand any chance of a revival.
Maynard
Maynard,
On the subject of costs, you will remember that you and I quizzed the Board at the last AGM, given planned cost reductions over the financial year of circa USD 2.5 million. I pointed out that that figure was more than the house broker (Zeus) was forecasting. Ditto Hardman. I recall that we were told by Tom Griffith that the Board was very confident that costs could be reduced by the stated figure and that this was “in the budget”, being achieved by a mixture of planned retirements and reductions in overheads. The interims suggested to me that the planned cost reductions were far too ambitious, but we will see what happens in the second half.
Andrew
Hi Andrew
Yes, I recall you asked about the $2.5m savings and TG mentioned suppliers such as Charles River (IT) and custodian services “having to share the industry’s pain“. The savings seemed ambitious at the time given the overhead split (largest expense by some margin is the workforce) and now talking of $3m savings just feels very odd. The -1% overhead-reduction assumption in the dividend-cover template seems more realistic, but costs have increased in this H1 and I would not be surprised to see the same occur during H2.
Maynard
City of London Investment (CLIG)
Pre-Close Trading Update for the year to 30 June 2025 published 24 July 2025
This update covering FY 2025 — and indirectly the Q4 2025 performance — was notable for the extra figures and commentary compared to the comparable FY 2024 update.
I am hopeful the additional information will be maintained for future updates.
Here is the full text interspersed with my comments
——————————————————————————————————————
City of London (LSE: CLIG), a leading specialist asset management group offering a range of institutional and retail products investing primarily in closed‐end funds (“CEFs”), provides a pre‐close trading update for its financial year ended 30 June 2025. The numbers that follow are unaudited.
Funds under Management (FuM) increased by 5.6% to $10.8 billion as of 30 June 2025 as compared to $10.2 billion as of 30 June 2024.
——————————————————————————————————————
FuM at $10.8b is the highest since December 2021:
——————————————————————————————————————
Investment Management Performance
——————————————————————————————————————
CLIM’s FY 2025 performances all appear very positive and well beyond the 5-8% CAGR generated over the past decade. I am pleased CLIM’s returns beat the 13.7% return from the all-conquering S&P 500 during the same twelve months.
CLIM’s FuM generated investment returns of $1.203b during the FY, equivalent to 19.0% of the $6.317b CLIM FuM at the start of the FY.
The investment gains were biased towards Q4 (Q1: +$493m, Q2: -$385m, Q3: +$175m, Q4: +$920m), which I hope can continue throughout FY 2025.
CLIG gave the following reasons for the gains, perhaps the most encouraging of which was “outperformance by non‐US equities over the last twelve months” that “brought new buyers to our largest areas of underlying focus“:
——————————————————————————————————————
Firstly, our strategies have benefited from an improved environment for corporate governance. The last few years since 2022 have been characterised by a period of wide discounts among the universe of closed‐end funds in which CLIM primarily sources investments. This has been particularly pronounced in the UK market where outflows from institutional and retail investors alike had resulted in depressed ratings. Such ratings allowed CLIM to accumulate positions at deeply valued price points and to work with boards to take measures to address discounts. Among other factors, these engagements helped provide the catalyst for broad‐based actions by boards to narrow discounts on funds held in portfolios. Such event‐driven actions included elevated levels of share buybacks, tender offers, mergers, restructurings and, in extreme cases, outright liquidations. CLIM’s strategies benefited accordingly.
Secondly, heightened market volatility, particularly since the election of President Trump in late 2024, has provided additional opportunities to benefit from discount volatility, as well as market rotation, as countries, sectors, size and style factors came in and out of favour.
Lastly, outperformance by non‐US equities over the last twelve months, after more than a decade of dominance by US stocks, brought new buyers to our largest areas of underlying focus, namely International Equities and Emerging Markets.
The International Equity strategy benefited from increased demand, especially for European and UK large cap exposure as well as International mid and small cap exposure.
Conversely, in addition to the factors highlighted above, the Emerging Markets strategy was meaningfully aided by its allocation to South Korean holding companies which outperformed following the Government’s proposed Corporate Value Up program designed to address the “Korea Discount” by promoting capital efficiency, transparent governance and increased shareholder returns.
——————————————————————————————————————
CLIM could definitely do with “new buyers“!
KIM’s investment returns were positive as well:
——————————————————————————————————————
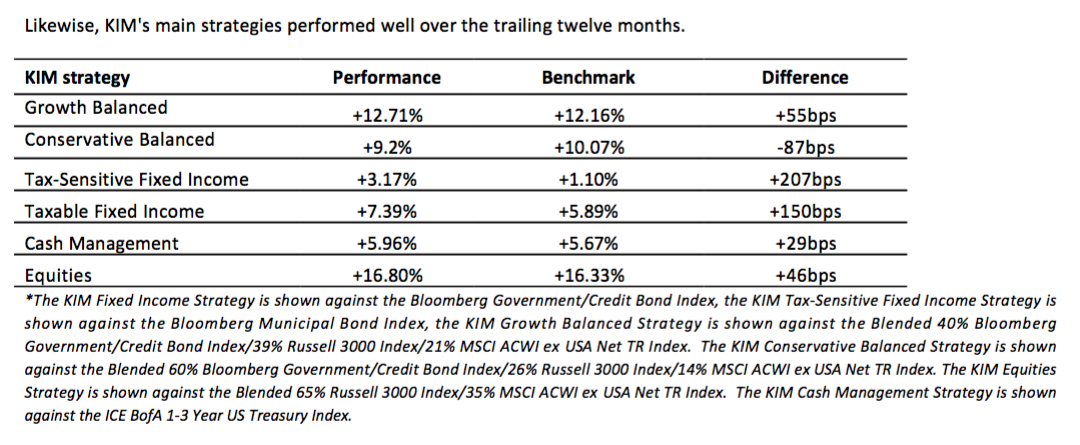
The primary contributor to outperformance over the past twelve months has been a modest narrowing of discounts across fixed income and equity closed‐end funds. Performance was further enhanced by substantial tender offers executed near net asset value and notable distribution increases among several major holdings.
Special Purpose Acquisition Companies, during their pre‐acquisition phase, continue to serve as effective alternatives to T‐ bills and money market funds within our Cash Management and Fixed Income strategies. While short‐term performance remains important, KIM’s long‐term track record is particularly strong, especially in fixed income.
Over the past five years, the Taxable Fixed Income and Tax‐Sensitive Fixed Income strategies have exceeded their respective benchmarks by 6.60% and 3.67% per annum.
——————————————————————————————————————
As per my blog post above, KIM’s investment gains have over time provided fewer concerns that those from CLIM.
Despite the positive investment returns from CLIM and KIM, both divisions suffered clients outflows during this FY:
——————————————————————————————————————
Flows
Net outflows were weighted more heavily to the first half of the financial year when macroeconomic uncertainty rattled markets. The second half withdrawals were characterised by some profit‐taking after very strong performance by our investment teams. This was particularly true in the International Equity and Emerging Markets strategies which saw net outflows of $387 million and $372 million, respectively. The Growth and Conservative Balanced strategies (a combination of equity and fixed income) saw net outflows of $241 million over this period, due primarily to client retirement cash needs. Net investment outflows totaled $974 million across the Group during the financial year.
New mandates included $60 million in the Listed Private Equity strategy and $70 million in the Emerging Markets strategy, with another $46 million mandate confirmed for August 2025 funding. Net inflows of circa $84 million combined across the Opportunistic Value, Listed Private Equity, alternatives and Taxable Fixed Income strategies were also recorded.
Persistent discount volatility and strong outperformance of the Group’s strategies continue to be the focus of marketing efforts with allocators.
A breakdown FuM by strategy is as follows:
——————————————————————————————————————
I calculate Q4 2025 witnessed net client withdrawals of $198m, with $98m withdrawn from CLIM and $100m withdrawn from KIM:
I suppose the net $98m withdrawn from CLIM being the lowest CLIM withdrawal since Q3 2024 (a net $170m inflow!) might suggest CLIM outflows are reducing. But CLIM’s longer-term record remains poor — a net £1.576b has been withdrawn from CLIM since the start of FY 2021.
KIM witnessing a net $100m withdrawn during Q4 2025 was very disappointing. KIM clients have now withdrawn a net $725m since the October 2020 merger.
And news of a fresh CLIM CIO:
——————————————————————————————————————
Leadership Update
In June, Mike Edmonds was appointed Chief Investment Officer of CLIM. A highly accomplished investor and City of London veteran, Mike first began his career with the Group in 1992. He brings deep investment expertise, creativity, and an engaging intellectual curiosity‐qualities that complement his strong collaborative relationships across our Investment, Research, and Macroeconomic teams.
In his capacity as Chairman, Rian Dartnell continues to work closely with our teams and with the Board to evaluate CEO candidates and consider the Group’s future leadership needs. A further announcement will be made in due course. Meanwhile, our entire team is focused on providing strong risk‐adjusted returns, enhancing client service excellence, and deepening shareholder engagement. We are also reinforcing our commitment to inclusivity and accountability to position the Group for long‐term success.
——————————————————————————————————————
Looking back through the archives, CLIM appears to have been without a CIO since Mark Dwyer departed at the end of FY 2024:
[RNS Oct 2023] “Mark Dwyer, CLIM CIO, has announced his intention to retire from the firm on 30th June 2024. Mark has been with the firm for over 20 years having served as the Head of EM CEF Strategy. We wish him the very best in his retirement.
Oliver Marschner, senior CLIM Portfolio Manager, will assume responsibility for the EM CEF Strategy from 1st January 2024. Oliver returned to CLIM’s London office five years ago, having previously worked for CLIM in Singapore for six years and Seattle for three years. He will continue to work closely with senior portfolio managers, Chris Weaver and Jeff Gill. The leadership of the other investment strategies within the CLIM subsidiary is unchanged. The average tenure of the lead portfolio managers at the firm approaches twenty-years, with a significant “bench” of talent behind them.”
Nothing as expected on the search for the replacement CEO, but the board’s use of the terms “deepening shareholder engagement” and “accountability” is encouraging.
——————————————————————————————————————
Dividend
The Board expects the final dividend for the year ended 30 June 2025 to be in line with the previous year.
Following the completion of the year‐end audit, the Board will announce the final dividend and results alongside publication of its Accounts for the year ended 30 June 2025 on 16 September 2025.
The Group’s Annual General Meeting will be held on 27 October 2025 and the Group expects the dividend payment date to be in November 2025 similar to last year’s timing.
——————————————————————————————————————
As per my blog post above, cover for the 33p per share dividend is touch and go, so an expectation to hold the 22p per share final payout is reassuring.
Hopefully this year the FY results will not be delayed by a staff shortage at the auditor.
I plan to attend the AGM!
Maynard
City of London Investment (CLIG)
Companies House update for CLIM published 04 August 2025
Two new director appointments at CLIM: i) Mike Edmonds, as per the Q4 2025 update above, and; ii) Edward Sevick, CLIG’s chief operating officer. Both live in the US, and Mr Edmonds is a dual UK/US national while Mr Sevick is a US national. The only UK and UK-based CLIM director is therefore group’s finance director. I am not convinced having the group’s head office and many CLIM staff in London creates the optimum working environment when the CLIM leadership is based mostly in the US. Will be fascinating to discover the identify of the new CEO and, among other matters, where exactly he/she will work! I do wonder if CLIG will gradually move its operations from the UK to the US.
Maynard
Maynard,
I agree. I was struck by the comment made at the last AGM that CLIG is a US company, with a UK badge. That may be no bad thing. I will be interested to see whether CLIG has stemmed the tide of fund outflows, despite decent performance. I still monitor performance against Polar Capital Holdings, which recently posted good results.
I hope that the company sorts out the new CEO appointment very quickly. I have seen at first hand in the last couple of years what happens to a company when this appointment is deferred. Treatt is the most painful example for me, but not the only one. It is a red flag for me, as I think that succession planning needs to work smoothly.
Andrew
Hi Andrew,
The fund outflows are somewhat frustrating. In particular, the recent Q4 2025 showcased superb double-digit gains for CLIM clients during the year — and yet the division witnessed a net $683m FY withdrawal. I am not quite sure what has to happen for CLIM clients to add money to their funds! Possibly some sort of major market rotation. Or maybe improved marketing (the Q3 2025 update did say “we see opportunities to expand Group investment sales outside of the US with international distribution partners.”). If our friends at TSTL are anything to go by, a sudden search for a new CEO takes six months to find a replacement and another three months before the replacement starts work. I do worry about the process dragging on as i) in the meantime nobody is really in charge, and; ii) candidates may not fancy the job for reasons that are yet to become clear to shareholders.
Maynard