27 July 2018
By Maynard Paton
Update on Daejan (DJAN).
Event: Preliminary results for the year to 31 March 2018 published 17 July 2018
Summary: The commercial property group once again left its numbers to do most of the talking, as new all-time highs for revenue, net asset value and the dividend were accompanied by only two paragraphs of management commentary. A bonus this year was US tax changes adding £40m to the balance sheet, which now stands at £111 per share and continues to dwarf the £64 share price. Conservative borrowing levels, veteran family management and an illustrious track record remain the foundations of this investment, and, in theory at least, a 14% earnings yield is available, too. I continue to hold.
Price: £64
Shares in issue: 16,295,357
Market capitalisation: £1,043m
Click here to read all my DJAN posts
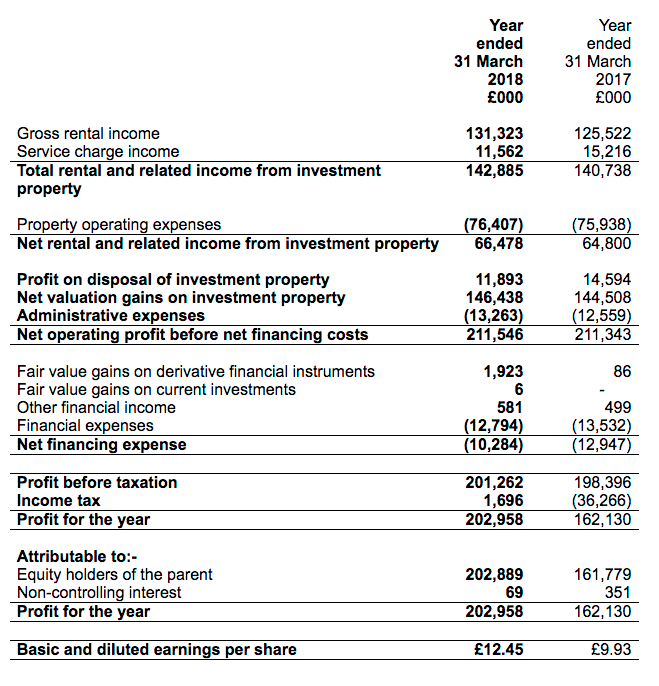
Results:
My thoughts:
* £40m US tax change takes net asset value to fresh £111 per share high
These 2018 figures were accompanied by the usual terse management commentary.
This year the effect of recent US tax changes provided a bonus remark. Here is the full (two-paragraph) narrative (my bold):
“The revaluation of the investment property portfolio at the year end has resulted in a net valuation surplus for the year of £146,438,000 (2017 – £144,508,000). As a result of the reduction in the USA corporation tax rate from 35% to 21%, the Group has benefitted from a release of £39.9m from the provision for deferred tax. The Board has recommended a final dividend of 68p per share in respect of the year ended 31 March 2018 payable on 2 November 2018 to shareholders on the register on 5 October 2018. This will make a total dividend for the year of 103p (2017 – 98p).
Earnings per share is calculated by reference to profit on ordinary activities after taxation attributable to equity holders of the parent of £202,889,000 (2017 – £161,779,000) and 16,295,357 (2017 – 16,295,357) ordinary shares being the weighted average number of ordinary shares in issue during the year. Equity shareholders’ funds per share is calculated by reference to total equity attributable to equity holders of the parent of £1,812,902,000 (2017 – £1,655,715,000) and the ordinary shares detailed above.”
Releasing £40m from the deferred tax provision added £2.45 per share to earnings and net asset value (NAV).
The results themselves set a trio of all-time records, with fresh peaks attained for revenue, NAV and the dividend:
| Year to 31 March | 2014 | 2015 | 2016 | 2017 | 2018 |
| Net asset value (£k) | 1,110,468 | 1,345,818 | 1,480,025 | 1,655,715 | 1,812,902 |
| Net asset value per share (p) | 6,815 | 8,259 | 9,082 | 10,161 | 11,125 |
| Revenue (£k) | 112,202 | 128,976 | 138,197 | 140,738 | 142,885 |
| Operating profit (£k) | 32,863 | 47,114 | 55,148 | 52,241 | 53,215 |
| Profit on property disposal (£k) | 11,320 | 12,036 | 11,725 | 14,594 | 11,983 |
| Net valuation gain (£k) | 119,648 | 229,722 | 117,947 | 144,508 | 146,438 |
| Finance expense (£k) | (11,129) | (11,763) | (12,692) | (13,532) | (12,794) |
| Other items (£k) | 11,803 | 430 | 1,114 | 585 | 2,510 |
| Pre-tax profit (£k) | 164,505 | 277,539 | 173,242 | 198,396 | 201,262 |
| Earnings per share (p) | 919 | 1,395 | 877 | 993 | 1,245 |
| Dividend per share (p) | 82 | 88 | 93 | 98 | 103 |
Progress was assisted mainly by the £146m/6.5% property valuation gain, which took the property estate’s book value to £2,373m and NAV to £1,813m.

DJAN’s balance sheet continues to benefit from ‘yield compression’, whereby property valuations have been rising faster than revenue (rents and similar income):
| Year to 31 March | 2014 | 2015 | 2016 | 2017 | 2018 |
| Rental income (£k) | 97,751 | 112,847 | 117,733 | 125,522 | 131,323 |
| Service charge income (£k) | 14,451 | 16,129 | 20,464 | 15,216 | 11,562 |
| Total revenue (£k) | 112,202 | 128,976 | 138,197 | 140,738 | 142,885 |
| Investment property (£k) | 1,546,718 | 1,855,230 | 2,009,361 | 2,256,800 | 2,373,184 |
| Revenue/Investment property (%) | 7.3 | 7.0 | 6.9 | 6.2 | 6.0 |
One number that did not set a new record — in fact, quite the opposite — was service charge income.
I have to confess, I am not exactly sure what this revenue source represents. The 2016 annual report said:
“Service charge income has increased due to a number of major works programmes across the UK portfolio together with new lettings.”
I wonder whether this income encompasses more than just the normal service charge paid by leaseholders to cover building maintenance costs.
Anyway, the service charge income for 2018 was £12m — down more than £3m on 2017 and down almost £9m on 2016. In fact, the level for 2018 was the lowest since DJAN first started disclosing the figure during 2005.
At least normal rental income climbed a useful 4.6% for the year to ensure total revenue gained 1.5%.
The half-year splits showed UK revenue slipping during the first half and gaining during the second, and US revenue gaining during the first half and slipping during the second:
| H1 2017 | H2 2017 | FY 2017 | H1 2018 | H2 2018 | FY 2018 | ||
| UK revenue (£k) | 46,436 | 45,423 | 91,859 | 45,602 | 46,793 | 92,395 | |
| US revenue (£k) | 23,778 | 25,101 | 48,879 | 25,668 | 24,822 | 50,490 | |
| Total revenue (£k) | 70,214 | 70,524 | 140,738 | 71,270 | 71,615 | 142,885 | |
| Valuation gain (£k) | 38,611 | 105,897 | 144,508 | 29,536 | 116,902 | 146,438 |
I must add that these 2018 results extended DJAN’s illustrious long-term record.
After the current chairman took charge during 1980, NAV has since ballooned 82-fold (+12% average), the dividend has since surged 28-fold (+9% average) while rental and other income has since rallied 14-fold (+7% average).
* Currency movements, balance sheet and cash flow
I wrote in November that adverse currency movements had hindered DJAN’s first-half NAV gains.
The GBP:USD exchange rate moved from 1.25 to 1.34 during the first half and extended the move to 1.40 during the second. The overall shift meant DJAN’s US properties had their year-end value cut by £11m to £590m despite a valuation gain of £49m.
At least the currency movements helped US liabilities decline by £57m to £347m, and total debt reduce by £2m despite the group taking on extra loans of £24m.
Net borrowings now stand at £252m and are equivalent to only 11% of the full property estate — the lowest proportion for ten years.
| Year to 31 March | 2014 | 2015 | 2016 | 2017 | 2018 |
| Net debt (£k) | (232,430) | (252,117) | (237,065) | (268,256) | (251,707) |
| Investment property (£k) | 1,546,718 | 1,855,230 | 2,009,361 | 2,256,800 | 2,373,184 |
| Net debt/Investment property (%) | (15.0) | (13.6) | (11.8) | (11.9) | (10.6) |
My early sums suggest interest paid on borrowings fell from 4.0% to 3.6% for the year.
These 2018 results presented the calculations behind ‘cash generated from continuing operations’ in a new format:
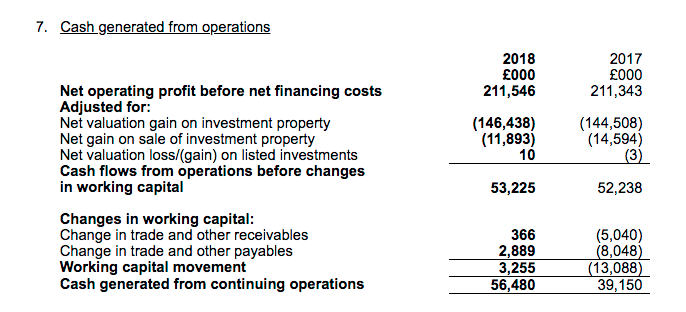
I am pleased working-capital movements are now specifically shown, and that the adverse outflow of working-capital cash witnessed during 2017 was partially reversed for 2018:
| Year to 31 March | 2014 | 2015 | 2016 | 2017 | 2018 |
| Operating profit (£k) | 32,863 | 47,114 | 55,148 | 52,241 | 53,215 |
| Acquisition/development of investment property (£k) | (47,797) | (43,460) | (26,939) | (27,726) | (39,424) |
| Proceeds from sale of investment property (£k) | 13,093 | 16,772 | 12,807 | 18,242 | 16,085 |
| Working-capital movement (£k) | (696)* | (5,909)* | 6,381* | (13,088) | 3,255 |
(*estimated)
I see DJAN upped its capital-expenditure programme during the year, too.
Valuation
Trading at £64, the share price is equivalent to 58% of the latest £111 per share NAV.
Although the discount appears sizeable, these shares have rarely traded close to NAV for decades.
Reasons for the persistent discount include the board’s 80% family shareholding, the management’s unconventional working culture/corporate governance, a lack of City engagement, and the absence of any takeover possibilities.
Nonetheless, I am hopeful that — one day! — the discount to NAV will narrow as the group’s performance and size simply become too difficult for the wider stock market to ignore.
In the meantime, another way of looking at DJAN’s value is from a return on equity standpoint.
During recent 10-year periods, DJAN has earned an average of at least 7.6% a year from its asset base:
| 10yrs to 2014 | 10yrs to 2015 | 10yrs to 2016 | 10yrs to 2017 | 10yrs to 2018 | |
| Start NAV (£) | 30.96 | 38.94 | 45.74 | 52.88 | 55.40 |
| End NAV (£) | 68.15 | 82.59 | 90.82 | 101.61 | 111.25 |
| Dividends accumulated (£) | 7.28 | 7.55 | 7.83 | 8.11 | 8.41 |
| Total return (£) | 44.47 | 51.20 | 52.91 | 56.84 | 64.26 |
| Total return/Start NAV (CAGR %) | 9.3 | 8.8 | 8.0 | 7.6 | 8.0 |
Assuming DJAN can earn an average of, say, 8% a year from its latest £111 per share NAV, typical annual earnings could be £8.90 per share — represented by a mix of rental profit and valuation gains.
In theory at least, enjoying £8.90 per share a year from a £64 entry price is equivalent to a worthwhile 14% annual earnings yield.
Meanwhile, the 103p per share dividend supports a very modest 1.6% income.
Maynard Paton
PS: You can now receive my Blog posts through an occasional e-mail newsletter. Click here for details.
Disclosure: Maynard owns shares in Daejan.

Maynard
Thanks for the update great analysis
I continue to hold also, it’s been a lack lustre share over the last year so nice to see some action
Regards
David
Daejan (DJAN)
Publication of 2018 annual report
Here are the points of interest:
1) Extra management narrative
The annual report provided some — but not much — extra management comment on the group’s 2018 progress. Nothing within the remarks was too surprising.
The completion of three major projects appears to have bolstered the group’s UK valuations. From my recollection of past annual reports, the upcoming Oxford Street project could be quite significant:
There was a line about the service charge income:
I now wonder whether a lower service charge income has much effect on profit, as I presume such income comes with the associated costs of performing the building maintenance. I see operating profit for 2018 was only £2m lower than 2016 (£53m vs. £55m), despite service charge income being £9m lower.
2) Outlook
The board remains frustrated by Brexit and once again says the UK operation faces “political and economic uncertainty“:
But such ‘uncertainty’ does not appear to have held the business back, with the UK estate enjoying a 5.5% valuation gain during 2018 and a 6.6% valuation gain during 2017.
3) Valuation gains
The table below shows both DJAN’s UK residential and UK commercial properties enjoying decent c8% valuation advances:
(The reported gains in the first table include purchases of new properties and other capex, so do not match my 5.5% calculation from point 2 above. But I am pleased the value of both residential and commercial properties improved.
The reported gains also include foreign-exchange movements, which the second table shows to be £67m and which dampened the year-end USA valuations.)
4) Risks
The report’s Risks section contained a few extra lines about owning retail property:
The report’s pie charts confirmed UK Retail properties represented £419m, or 18%, of the £2,373m group property estate:
I also see DJAN has inserted a new line about seeking fixed-price development contracts:
Probably a good idea.
5) Tax
I overlooked this issue within last year’s report. DJAN is disputing certain tax demands from HMRC:
Last year the estimated amount was between £0m and £49m, so it appears HMRC may be winning the argument.
I have heard on the grapevine that DJAN had been quite cavalier with certain tax arrangements, but the arrangements in question (according to the note above) have now ceased.
6) Trade receivables
I always like to check DJAN’s trade receivables and make sure tenants are paying their rent on time:
The £38.6m net trade receivable figure represents 27% of revenue, which compares to 24% for 2017, 26% for 2016 and sub-22% before that.
So there is a little more money outstanding than normal, but at least the quality of the owed invoices has improved.
In fact, the £8.2m impairment for the year represents 18% of the £46.8m outstanding gross receivables — by far the lowest proportion since the relevant figures were first disclosed in 2010 (the previous low was 23% during 2017).
7) Debt
It’s nice to see some of DJAN’s fixed-rate mortgages essentially being switched from 5.5%-6.0% to 3.5%-4.0%:
The group paid interest of £12.8m during 2018, which on average debt of £351m = a 3.6% interest rate. The cost for 2016 and 2017 was 4.1% and 4.0% respectively — so a useful reduction has occurred.
8) Director pay
The two family execs each enjoyed a £50k (4.3%) pay rise last year and both now earn hefty £1.2m salaries:
Chairman Benzion Freshwater has seen his basic pay advance 7.9%pa in the last five years and 6.7%pa in the last ten.
In contrast, the dividend is up 5.4%pa during the last five years and up 3.9%pa during the last ten years, while NAV is up 13.0%pa in the last five and 8.1%pa in the last ten.
So I continue to think the wage hikes have generally been justified on an NAV basis, although a £1.2m basic salary remains very chunky regardless of the size of the business.
As I have written before, I can’t argue with management’s track record and if £1.2m salaries are required to keep the record going, then that’s something shareholders have to live with.
Note that the board does not collect bonuses and does not enjoy pension contributions. Nor is there any option scheme.
Maynard
Hi Maynard,
I think you are correct with your thoughts on service charge income. In my view it is not really income but recovery of costs. There should be no profit potential in s.c recoveries, in fact if there are vacant properties this will result in a shortfall over costs. The level of charges will vary as in some buildings there will be sinking funds which have built up to recover major repair/replacement items but in some instances where no sinking fund exists the total cost will be recovered from the tenant(s) in a single year.
I think you should ignore these figures as they will be countered by the cost being inluded somewhere under expense items in the accounts.
Bear in mind that as interest rates rise yields on property will do likewise ie the capital values will fall. So as a happy holder it may be okay to retain but perhaps not the time in the cycle to consider a new investment.
Dave.
Hello Dave
Thanks for the Comment. Yes, I would agree with your view of service charge income being a ‘recovery of costs’ — a good way of describing it. Point taken on interest rates as well. From recent annual reports, I get the impression future NAV gains are more likely to come from property redevelopments than pure valuation uplifts.
Maynard