21 March 2018
By Maynard Paton
Update on Mincon (MCON).
Event: Final results for the twelve months ending 31 December 2017 published 20 March 2018
Summary: MCON’s subdued years of 2014, 2015 and 2016 now seem long forgotten after the mining-drill manufacturer confirmed a bumper set of 2017 numbers. Greater client activity has now fuelled director talk of “significant opportunities” and “the first year of the current upturn”, and the share price has naturally climbed to a premium level. Meanwhile, the accounts remain cash-rich, several factors may be suppressing certain ratios, and even the standstill dividend has been lifted. I continue to hold.
Price: 115p
Shares in issue: 210,541,102
Market capitalisation: £242m
Click here to read all my MCON posts
Results:
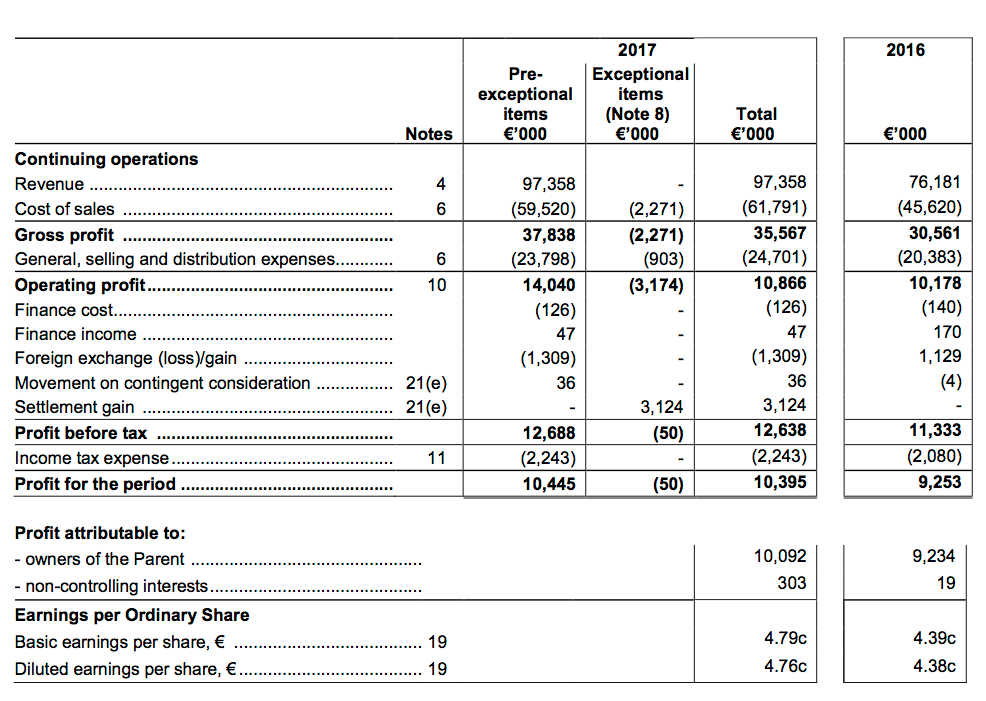
My thoughts:
* “The year was stronger for the company than the results suggest”
MCON’s full-year results confirmed the continuation of the upbeat progress reported within August’s interim statement and October’s third-quarter update.
Revenue climbed an impressive 28% and helped operating profit before exceptional and other items surge 38%. MCON’s revenue set a new peak for the third consecutive year, while underlying operating profit came quite close to the record level struck back in 2013:
| Year to 31 December | 2013 | 2014 | 2015 | 2016 | 2017 |
| Revenue (€k) | 52,343 | 54,544 | 70,266 | 76,181 | 97,358 |
| Operating profit (€k) | 15,012 | 10,350 | 9,990 | 10,178 | 14,040 |
| Exceptional charges (€k) | - | - | - | - | (3,174) |
| Exceptional gains (€k) | - | - | - | - | 3,124 |
| Other items (€k) | (2,527) | 364 | (481) | 1,125 | (1,273) |
| Finance income (€k) | 52 | 535 | 114 | 30 | (79) |
| Pre-tax profit (€k) | 12,537 | 11,249 | 9,623 | 11,333 | 12,638 |
| Earnings per share (c) | 4.80 | 4.34 | 3.79 | 4.39 | 4.79 |
| Dividend per share (c) | - | 2.00 | 2.00 | 2.00 | 2.05 |
The 2017 performance was underpinned mostly by increasing levels of activity among MCON’s mining clients. The group said:
“2013… was in retrospect the final year of the last cycle, and this looks very much like the first year of the current upturn.”
The results could have been better, too. MCON admitted “significant capacity constraints” had been experienced after the Q3 update claimed:
“We are producing and selling beyond our optimum levels at present and delivering those products in some cases uneconomically in order to maintain a high level of service to customers.”
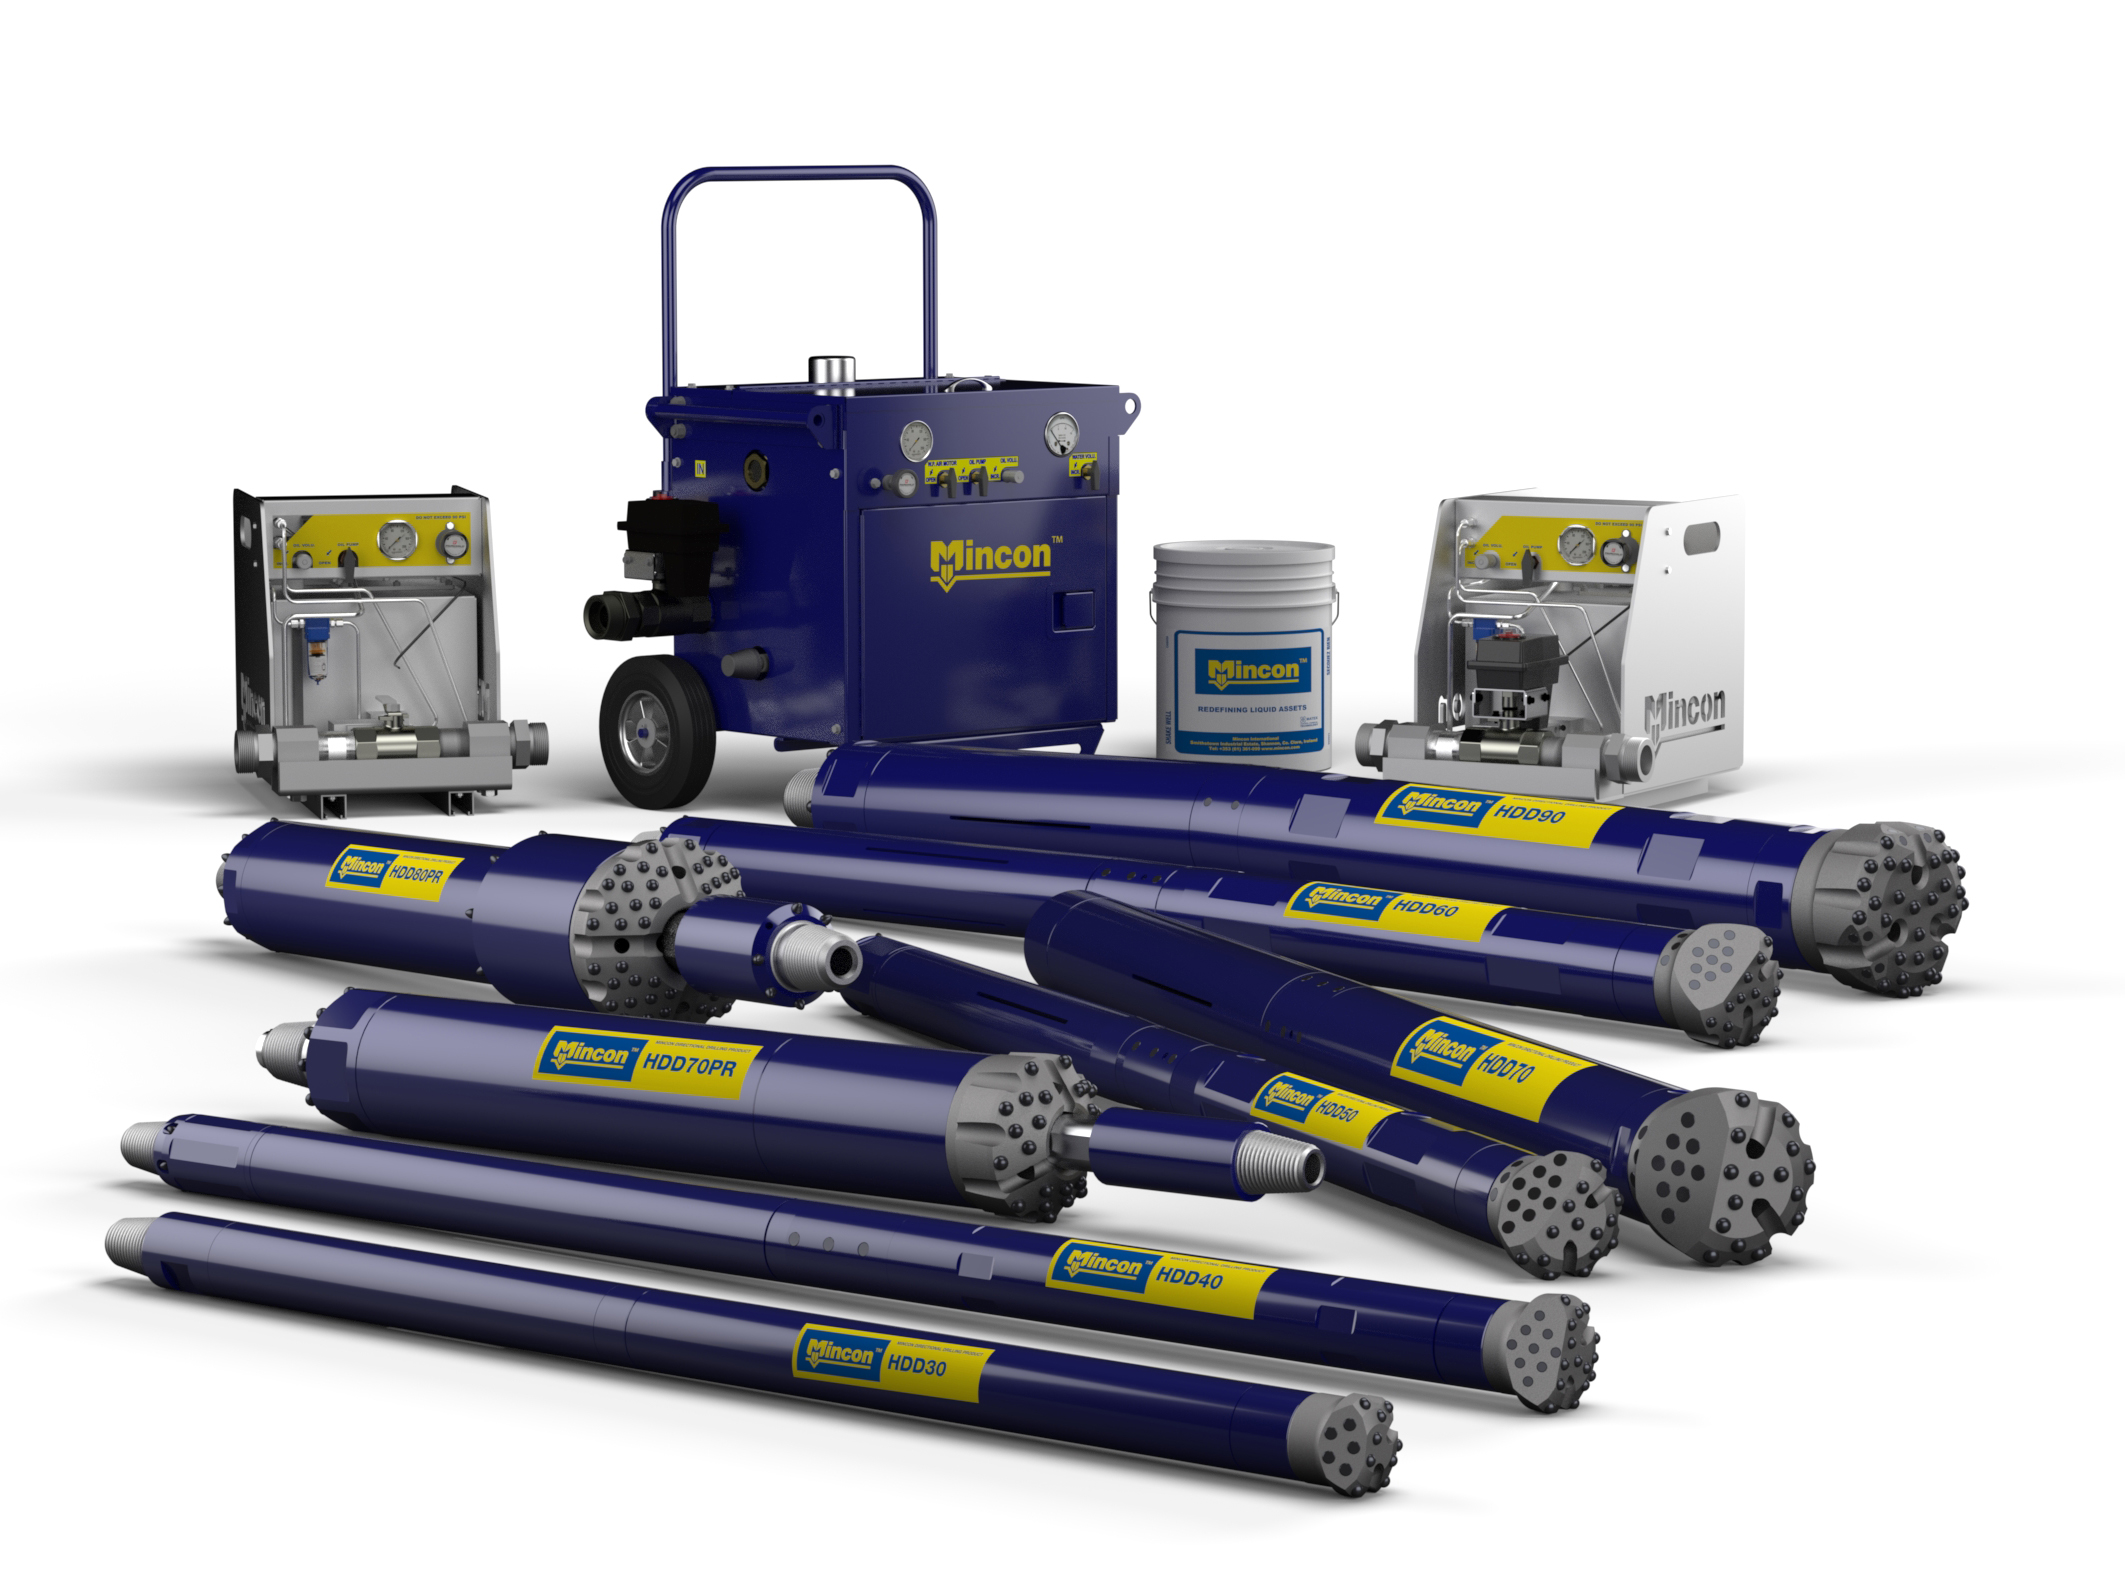
Notably, sales of MCON’s own products gained 33% during the year versus 13% for the third-party items the firm also distributes. In fact, the first-half/second-half split revealed sales of MCON’s own products soared 40% during H2:
| H1 2016 | H2 2016| FY 2016 | H1 2017 | H2 2017 | FY 2017 |
| ||
| Revenue (own brand) (€k) | 27,877 | 28,483 | 56,360 | 35,211 | 39,754 | 74,965 | |
| Revenue (third party) (€k) | 8,436 | 11,385 | 19,821 | 11,745 | 10,648 | 22,393 | |
| Revenue (total) (€k) | 36,313 | 39,868 | 76,181 | 46,956 | 50,402 | 97,358 | |
| Operating profit (€k) | 4,903 | 5,275 | 10,178 | 6,789 | 7,251 | 14,040 | |
| Exceptional costs €k) | - | - | - | (3,047) | (127) | (3,174) |
Some 77% of the top line is now delivered by own-brand products and I am hopeful this bodes well for future profit and margin improvements.
I am also pleased the hefty exceptional charges witnessed during the first half did not extend into the second half.
For what they are worth, here are my best guesses of MCON’s underlying quarterly performances:
| Q1 2017 | Q2 2017 | Q3 2017 | Q4 2017 | |
| Revenue (€k) | 21,368 | 25,588 | 24,875 | 25,527 |
| Gross profit (€k) | 7,906 | 10,461 | 9,647 | 9,824 |
| Pre-tax profit (€k) | 2,137 | 4,103 | 3,242 | 3,206 |
| Q1 2016 | Q2 2016 | Q3 2016 | Q4 2016 | |
| Revenue (€k) | 15,947 | 20,366 | 19,370 | 20,498 |
| Gross profit (€k) | 6,379 | 8,553 | 7,942 | 7,687 |
| Pre-tax profit (€k) | 1,563 | 3,445 | 3,680 | 2,645 |
* Three factors to consider about margins and returns on equity
MCON’s headline margin and return on equity figures continue to look adequate but not spectacular:
| Year to 31 December | 2013 | 2014 | 2015 | 2016 | 2017 |
| Operating margin (%) | 28.7 | 19.0 | 14.2 | 13.4 | 14.4 |
| Return on average equity* (%) | 25.8 | 18.6 | 12.7 | 13.0 | 12.6 |
(*adjusted for cash and deferred consideration)
My calculations are subject to several factors.
i) Third-party product purchases came to €17,580k, which equates to a 22% gross margin from the associated €22,393k revenue:

With the overall gross margin at 39%, it seems this smaller third-party division is diluting the wider group’s profitability.
ii) The group’s Q3 update confessed:
“We are…expensing the start-up costs of the Mincon Nordic strategy. The losses this year are just over €750,000. While it is early days, we expect the sales run rate to approach €10 million on an annualised basis.”
The Mincon Nordic strategy is essentially based on two acquisitions made last year (and a third announced with these results).
Last year’s purchases cost an initial €5m, may cost a further €7m, created extra goodwill of €11m…and it appears offer a near-term margin and return on equity of less than zero.
Adjust for the Nordic start-ups, and my group margin and return on equity calculations would improve.
iii) MCON did not mention its capitalised research and development expenditure within the results commentary. However, the accounts revealed the figure to be €1,163k:
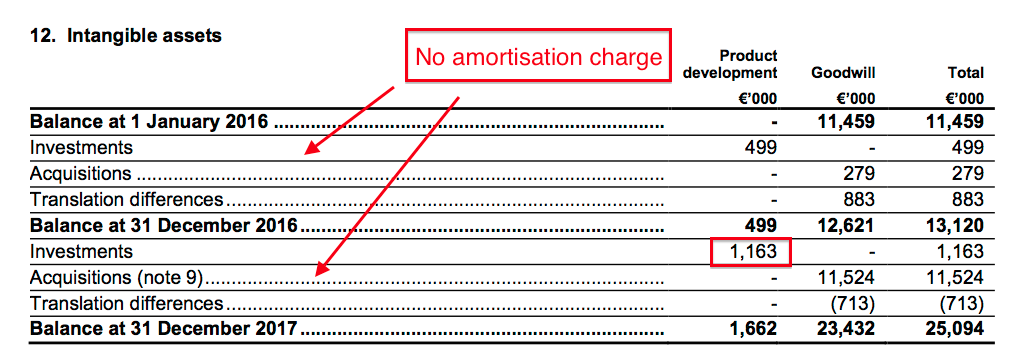
The note above shows there was no associated amortisation, so you could argue the headline operating profit (and margin) were flattered somewhat by redirecting this expenditure straight to the balance sheet.
Oddly, MCON’s cash flow statement does not identify the €1,163k intangible expenditure:
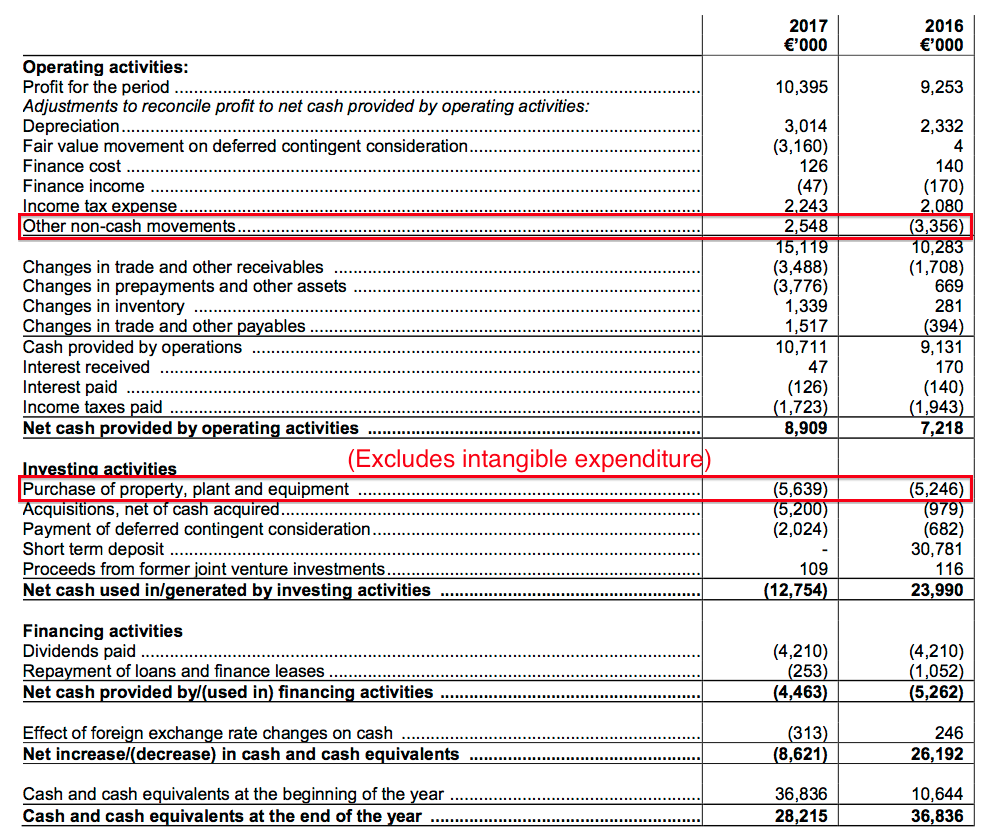
I can only assume the €1,163k has been lumped together with the various exceptional items into ‘other non-cash movements’.
Actually, MCON’s ‘other non-cash movements’ entry needs to be replaced with items that show exactly what is going on.
For the last three years now, this mysterious entry has been more than €1m either way of zero… and looks as if it is becoming a useful cover for disclosure avoidance.
* “Tightened” working capital leads to first dividend lift as a quoted company
Despite the ‘other non-cash movements’ ambiguity, MCON’s cash generation did not appear too bad:
| Year to 31 December | 2013 | 2014 | 2015 | 2016 | 2017 |
| Operating profit (€k) | 15,012 | 10,350 | 9,990 | 10,178 | 14,040 |
| Depreciation and amortisation (€k) | 1,874 | 2,053 | 2,346 | 2,332 | 3,014 |
| Net capital expenditure (€k) | (2,070) | (1,750) | (1,768) | (5,246) | (5,639) |
| Working-capital movements (€k) | (389) | (6,503) | (2,837) | (1,152) | (4,408) |
| Net cash (€k) | 48,600 | 41,754 | 38,610 | 34,960 | 26,142 |
I am not worried about the difference between the depreciation charged against earnings versus the larger cash capital expenditure.
During 2017 and previous years, the ‘extra’ sums spent have purchased additional land and buildings, which tend to hold their value and be used for expansionary purposes.
Meanwhile, MCON’s working-capital demands are still not the very best, with additional cash of €4m-plus becoming tied up in extra stock, debtors and creditors during 2017.
Mind you — revenue did grow by 28% during the year and improvements may be working their way through the books. MCON claimed:
“We have tightened up on our working capital, actually reducing it before the exceptional write-offs, even while sales rose 28%.”
True, total year-end stock, debtors and creditors came to €41.7m, down €3.5m. However, €2.9m of the reduction related to various ‘exceptional’ write-offs.
Over time, though, the year-end working-capital position has become a lower proportion of revenue:
Year to 31 December 2013 2014 2015 2016 2017
Revenue (€k) 52,343 54,544 70,266 76,181 97,358
Inventory (€k) 18,485 28,365 32,045 35,310 31,851
Receivables (€k) 8,492 11,822 13,021 16,437 17,560
Payables (€k) (2,189) (3,804) (6,780) (6,651) (7,721)
Total working capital (€k) 24,788 36,383 38,286 45,186 41,690
Total working capital/revenue (%) 47.4 66.7 54.5 59.3 42.8
MCON’s cash flow did not cover the group’s expenditure entirely. Some €7.2m was spent on acquisitions and earn-outs, with a further €4m used for dividends. The transactions meant the cash hoard was left €8.6m lighter at €28.2m, or approximately 11.8p per share.
Borrowings remain low at €2.1m while the deferred contingent consideration — representing an estimate of acquisition earn-out liabilities — advanced to €6.9m:
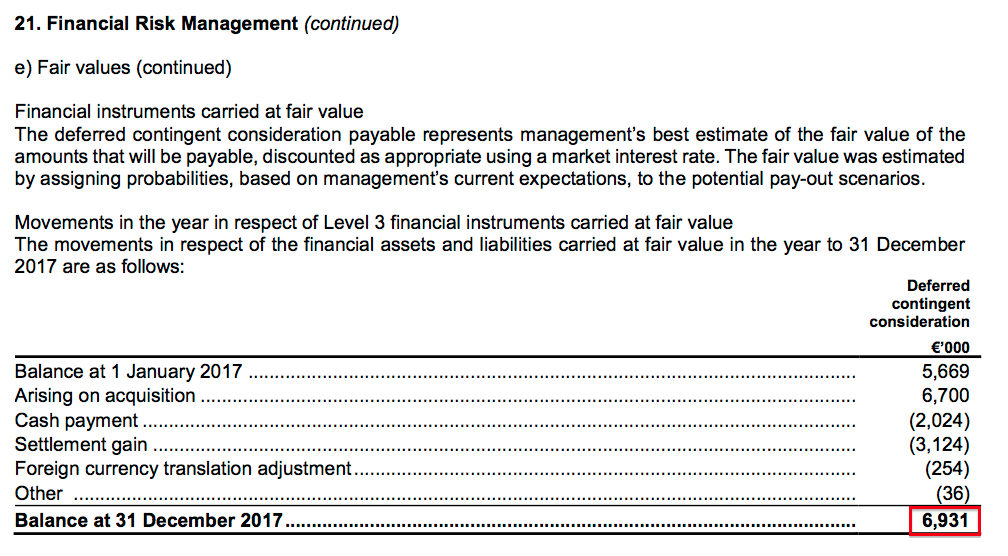
The net cash position is arguably €28.2m less €2.1m less €6.9m = €19.2m, or approximately 8.0p per share.
At least the cash generation and healthy cash pile prompted MCON to lift the annual dividend by 0.05 euro cents to 2.05 euro cents per share — the group’s first payout lift since the 2013 flotation.
Further confidence was expressed through the €8.0m purchase of a Swedish drill-pipe specialist announced alongside these results. The deal — MCON’s second largest — brings with it additional revenue of €21m but little in the way of immediate operating profit.
The new subsidiary is being merged with the aforementioned Nordic start-ups, and MCON claimed (my bold):
“With the acquisition… we have an excellent business with tremendous opportunities for development of customers, margins and profitability.”
Valuation
The management commentary included a number of positive snippets (my bold):
“We expect to see upward price movement for the product ranges through 2018.
Our organic growth may be constrained to single digits in the first half of 2018, as we have been running hard in 2017, and the new turnover base is so much higher, but if the demand continues to build, the capacity coming on stream should begin to reduce any order book back log.
If we can build sustainable organic growth on top of the acquisition growth, we will deliver another very strong year.
The Group is growing strongly, we have continued to build and invest, and we have made great strides in improving our culture and control.
Confidence is high in the Group, in our products, our management and our people, and we have tremendous opportunities in front of us that we have yet to realise in our revenues and returns.
We are not under pressure to grow revenue, that is coming naturally from good products and good management teams
The Group has great funding, good leadership, significant opportunities for organic and acquisition growth, exciting products and a strong, we believe, improving market position.”
The encouraging remarks are reflected in the share price.
MCON’s trailing €14.0m operating profit converts to earnings of £12.3m, or 4.8p per share, after applying 18% tax and using a £1:€1.14 exchange rate.
Adjusting for the €28.2m cash balance, the €2.1m debt, the €6.9m deferred contingent consideration and the €8.0m acquisition just paid, I reckon MCON’s enterprise value (EV) is £232m or 110p per share.
Dividing that 110p per share EV by my 4.8p per share EPS guess gives a multiple of 23 at the present 115p price.
A 23x multiple is not an obvious bargain, especially for a company that had stagnated for a few years and has only now recorded one full year of respectable progress.
I can only trust MCON is right when it says 2017 “looks very much like the first year of the current upturn….”
…and that the upturn has a few more years left to run.
Finally, the lifted €0.0205 per share dividend currently supports a 1.6% income (before Irish withholding taxes for UK-resident investors).
Maynard Paton
PS: You can now receive my Blog posts through an occasional e-mail newsletter. Click here for details.
Disclosure: Maynard owns shares in Mincon.

Mincon (MCON)
Publication of full 2017 accounts
Credit to MCON for including its full accounts within its results RNS. The forthcoming annual report will contain more info, but here are a few points to note from what’s been published so far.
1) New accounting standards
Not too much to worry about here:
For IFRS9:

For IFRS15:

For IFRS16:

MCON’s annual lease payments are relatively small anyway:
2) Regions
Greater sales were enjoyed in all three major regions:
I suspect the Europe, Middle East and Africa region was bolstered by the Nordic purchases mentioned in the Blog post above.
The results small-print did not disclose the contribution of the acquisitions…
3) Acquisitions
Indeed, contrast this note from these results:
…to this note from the 2016 annual report:
I am hopeful the 2017 annual report will disclose the contribution of the Nordic purchases.
4) Employees
Nothing of concern here:
Employee costs as a proportion of revenue were 24.2%, versus 24.9% and 25.2% for 2015 and 2016 respectively.
The average cost per employee increased from €64k to €73k, while average revenue per employee climbed from €256k to €300k. These two calculations are at their highest levels since 2013 (€78k and €347k).
5) Director pay
Good results have not surprisingly seen the directors’ wages increase:
Full details will be revealed in the forthcoming annual report.
6) Land and buildings
Confirmation of what was spent on land and buildings during the year:
7) Trade and other receivables
Mixed news here:
The year-end ‘net trade and other receivables’ entry represented 18% of revenue, versus between 19% and 22% for the previous three years. But the provision for impairment — which I think includes a €600k exceptional item — has increased not insignificantly.
The line that 22% of trade receivables were past due but not impaired is relatively reassuring — at least the percentage is similar to that of the year before. That said, the ratio was 14%, 12% and 11% for 2013, 2014 and 2015 respectively. Working-capital management has never been MCON’s forte and I am hopeful the upbeat trading conditions of late mean clients are doing well and invoices will eventually be paid.
Maynard
Maynard,
Excellent analysis, I’m holding also
Thanks
David
Mincon (MCON)
Publication of 2017 annual report
MCON traditionally leaves most of its management narrative for the annual report rather than publish it within the initial results RNS. So there are a fair few screenshots here. Thankfully MCON’s results RNS included the full accounts, and they were reviewed previously within a Comment above.
Here are the points of interest:
1) Additional chairman’s statement
The chairman wrote all this (my yellow highlights):
Everything sounds upbeat. It is useful to know that 2018 has started with record sales and that there is scope to improve margins by enhancing efficiency.
2) Additional chief exec remarks
The annual report included the following extra paragraphs from the chief exec (my yellow highlights).
I am pleased the Nordic start-up costs were revealed:
Here is confirmation that revenue growth was restrained because of a lack of operational capacity:
This is an interesting snippet about quarterly reporting being an “excellent market discipline“:
I dare say most investors/companies would suggest quarterly reporting can lead to making adverse short-term decisions.
Long order books sounds positive, too.
Some extra commentary from the chief exec:
The aforementioned Nordic start-up costs should be covered by the end of 2018:
More extra commentary from the chief exec:
Interesting to see MCON refer to revenue per head. Not often a quoted company refers to such measures:
3) Additional financial review
A few snippets from the financial-review narrative (my yellow highlight).
Ah, so Nordic is expected to produce a profit during the second half:
The following snippet is useful. My working-capital sums include the ‘prepayments’ referred to below:
Perhaps these prepayments should be excluded from my working-capital analysis, as they concern mostly upfront payments relating to fixed assets. That said, it is not easy to determine what the prepayments always are.
There is useful info on capitalised development costs, too. I hope the Greenhammer project can indeed become a “significant opportunity“.
It appears recent expenditure could lead to revenue capacity increasing by €20m:
“Cannot meet demand in the strongly recovering sectors we serve” is one of the better problems to have for a quoted company.
The latest acquisition will absorb an extra €2m on top of the €8m purchase price:
4) Acquisitions
Sadly the accounting notes did not disclose too many further details about the acquisitions:
My earlier Comment (point 3) had pondered what exactly the purchases contributed.
The commentary claimed 4% of revenue came from acquisitions:
5) Director pay
My earlier Comment (point 5) had spotted director wages had risen. It appears the pay increase was due solely to a 38% pay hike for the chief exec:
I doubt shareholders will complain too much given MCON’s profit advanced by a similar margin. And I do not feel the new pay level is completely out of line with the pay seen at companies of a similar level of profitability. I note the execs did not collect bonuses last year, and there is no option scheme in place either. So any signs of possible ‘fat cattery’ are not that obvious at present.
Maynard
Mincon (MCON)
Interim Trading Update
Here is the text interspersed with my comments:
————————————————————————————————————————–
Key elements (comparison of Q1, 2018 to Q1, 2017):
Continued improvement in our product sales mix:
· Mincon manufactured product sales up 19%
· Third party product sales down 27%
Resulting in:
· Revenue up 6% overall
· Gross margin: up to 39.5% from 37.4%
· Operating profit: 13.6% up from 11.5%
· Profit before tax: 12.4% up from 10.8%
· EBITDA: up to 17% from 14.7%
We continue our strategy of improving our product mix by manufacturing what we sell, where this provides commercial advantage. This has resulted in Mincon product representing 81% of sales in the quarter compared to 73% last year. The mix improvement has resulted in an improvement in margins alongside the revenue uplift.
————————————————————————————————————————–
Revenue up 6% was not exactly what I was expecting following the bumper top-line progress of 2017.
However, sales of MCON’s in-house product gained 19% while sales of third-party (and lower margin) items plunged 27%. So at least there remains good momentum within the more profitable core part of the business.
My very rough sums indicate Q1 2018 revenue and operating profit were €22,650k and €3,080k respectively, the latter being 25% up on Q1 2017.
————————————————————————————————————————–
Revenue
The Group continues to develop the full range of hammers, bits, and the drill string elements. We continue to invest in better engineering as our core proposition, delivering value, and positioning ourselves where this quality provides differentiation in the markets and with the customers we serve.
Revenue from Mincon manufactured products rose 19% in Q1, 2018 compared to the same period last year, and while we continue to run key factories, machinery and our people beyond the levels of maximum efficiency, this increase in own manufactured revenue underwrites our profit uplift. We will continue to seek growth for our own manufactured products, as this is where our margin is created, with third party products as ancillary to our own sales.
As additional capacity and the planned process upgrades are scheduled to come on-stream during the remainder of 2018, the Group is confident that the quality of our products will continue to improve, and some cost inefficiencies will be mitigated. Mincon product sales rose to 81% of total revenue, from 73% last year for Q1, with strong growth in Mincon Nordic and Australia in particular.
The Group did not increase prices through the quarter, but flagged a wide ranging and general uplift through the rest of the year where the competitive context facilitates this. However if we are able to improve cost efficiency by normalizing manufacturing and delivery, this may mitigate the need for price increases.
In the same quarter last year we noted that we had delivered third party rigs in Africa at very little margin, so the third party product in the first quarter this year represents a more normal level, and the reduction in revenue from third party sales has not been as significant in profit terms. We have not set revenue growth for its own sake as an objective of the Group; instead we have placed focus on improving our manufacturing mix which should drive continued improvement in our margins and profits.
————————————————————————————————————————–
It is useful to know MCON may be able to defer price rises for customers, who no doubt would welcome prices to remain unchanged. MCON’s remarks suggest the firm wants to maintain a harmonious relationship with its customers, which I would like to think will be to the long-term benefit of both parties.
Facilities that are still being run “beyond the levels of maximum efficiency” suggest scope for further margin improvement.
Ah, the comments on third-party sales explain the sudden shortfall during this quarter.
————————————————————————————————————————–
Margins
As the sales mix improved, so did the gross margin, by 2% from 37.4% to 39.5%, and we managed to keep all of that improvement at the operating profit line as the operating margin improved to 13.6% from 11.5%. The EBITDA margin improved to 17% in Q1, 2018, from the first quarter comparative for 2017 of 14.7%.
The Group is still making start-up losses in Mincon Nordic as it begins to mature from the start-up phase, but we expect to see volumes continue to ramp up with the build out of the full service team in the region. We have also absorbed some forex losses in the numbers above, but the margins are still making progress.
We should bear in mind that the Driconeq Group, which we recently acquired, currently makes a gross margin of about 22%, and as this represents approximately a fifth of our revenue going forward, this will have a dilutionary effect in the period immediately following acquisition. Improving the gross margin of Driconeq is a key objective for the year, and we believe efficiency in production, and normalization of supply terms will assist in this regard.
————————————————————————————————————————–
The points about Nordic and forex indicate underlying profit has run higher than what MCON’s percentage figures (and my rough sums) suggest.
The remarks about Driconeq are a useful reminder to prepare for group margins having declined when the half-year numbers emerge.
————————————————————————————————————————–
Balance sheet
During the first quarter of the year, the Group completed the acquisition of Driconeq for c. €8 million, and some €2 million was additionally invested in inventory. In H2, 2017 we decided to put another €5 million into raw materials and work in progress, to mitigate price increases and to reduce stock depletions due to demand. Even with this we have still seen lengthening order periods and while we are gaining market share, we believe we are losing further opportunity due to constraints in key factories.
After these investments the Group had net cash of some €18 million at the end of March.
Capacity is beginning to arrive, with;
· a new machining plant established in Sheffield, beside our Marshalls carbide operation, which went live in April 2018
· the Prototype factory in Shannon which is being commissioned for short run and prototype engineering work. This was a former warehouse and will go live in June 2018.
o this will clear the main factory floor for longer run production,
· phase 3 of our factory build out in Benton, Illinois bringing new plant on-stream in H2, 2018
o this continues the programme that has seen US$ 6 million invested over the last two years in the new factory and heat treatment facilities at our main USA plant
This year will see us bring the factories to greater capacities, with better lay outs and with key processes brought in house. We are, in addition, stepping up the headcount in our factories and introducing new shifts.
It is our view that this will bring this significant build-out phase to an end, and we should normalize capital expenditure in 2019 at or around the depreciation charge unless we continue to see growth at these current levels.
————————————————————————————————————————–
MCON continues to lose business due to the sudden customer-spending uplift and a shortfall of facilities: “we believe we are losing further opportunity due to constraints in key factories.”
As problems go for quoted companies, being unable to cater for greater customer spending is not so bad. It appears the problem may moderate during H2 as new facilities arrive… however, I see MCON teases us with the line “unless we continue to see growth at these current levels”
Well, yes, I would like MCON to “continue to see growth at these current levels” during 2019. So further investment in facilities and stock etc may be required.
————————————————————————————————————————–
Acquisition of Driconeq
At the quarter end Mincon acquired the Driconeq group and it is not included in the comparative numbers referred to above. However, the Mincon team is very actively on site in the various member companies in Perth, Sunne, Sweden, and in Johannesburg looking at efficiencies, and dealing with the inherited issues.
Driconeq Group had sales of some €24 million in 2017, on which, under its own policies, it broke even. Some €4 million of that was supplied to the Mincon Group, so the addition to net revenue in a full year will be about €20 million.
Mincon paid €7.2 million for the group, and with costs and contingent payments this will rise to €8 million. We have, in addition, addressed the working capital needs of that group to facilitate efficient ordering on the supply side, and we have assured key customers of continued supply. The Australian subsidiary had been placed into Administration by the previous owners, and Mincon funded that business being brought out of Administration prior to completion, in order to protect the brand and the team on site.
The Driconeq Australia business came through an administrative process prior to acquisition whereby creditors at that time were to be paid out over an eighteen month period. As a subsidiary of the Mincon Group we believe this is not required, and we have elected to pay out the agreed balances with the creditors of Driconeq Australia as soon as possible and will fund Driconeq Australia with AUD 1.5 million (€1 million) to back this decision.
We do this to normalize supply terms, to protect the brand, and to reduce hardship on the many businesses that supported Driconeq Australia prior to them joining the Mincon Group plc.
————————————————————————————————————————–
Back to MCON maintaining harmonious relationship with customers, and I see MCON looks to have done the ‘right thing’ with customers of a new Australian subsidiary. I welcome such actions — they tend not to be forgotten by the customers affected.
————————————————————————————————————————–
Market comment and position
We have seen strength in the revenue line from early last year, reflected in our organic growth. While we had further organic growth in Mincon product of 19% in Q1, this is beyond what we expected as we thought our capacity would not accommodate it. However additional capacity is now coming on stream, and we should be better able to manage our efficiencies through the rest of the year.
We have, to a degree, slowed order intake as an inability to deliver is not helpful to our business or that of our customers. Our business has continued to grow well with the early sector recovery, though we see some caution from market commentators about certain commodities and pricing.
We aim to produce consumables that deliver better performance for their cost rather than adopt price competition as our main product positioning. This relies on our engineering programmes delivering scheduled product improvement for the existing catalogue and a stream of new products being delivered into the market. Key among these is the Greenhammer project, still expected to go live at the end of the half year.
————————————————————————————————————————–
All sounds reasonable in the circumstances.
Maynard