19 January 2018
By Maynard Paton
Update on City of London Investment (CLIG).
Event: Trading update and shareholder presentation/summary results for the six months ending 31 December 2017 published 17 January 2018.
Summary: Favourable market movements helped CLIG report its best-ever first-half figures, with revenue, profit, net cash and the dividend all moving higher. However, the finer details showed the emerging-market fund manager struggling to capture new clients as its main strategy under-performed. Meanwhile, fee rates are still being chipped away and staff costs keep on climbing. The shares may look under-appreciated on a P/E of 10 and yield of 6%, but sadly a re-rating does not appear imminent. I continue to hold.
Price: 430p
Shares in issue: 26,861,707
Market capitalisation: £116m
Click here to read all my CLIG posts.
Results:
My thoughts:
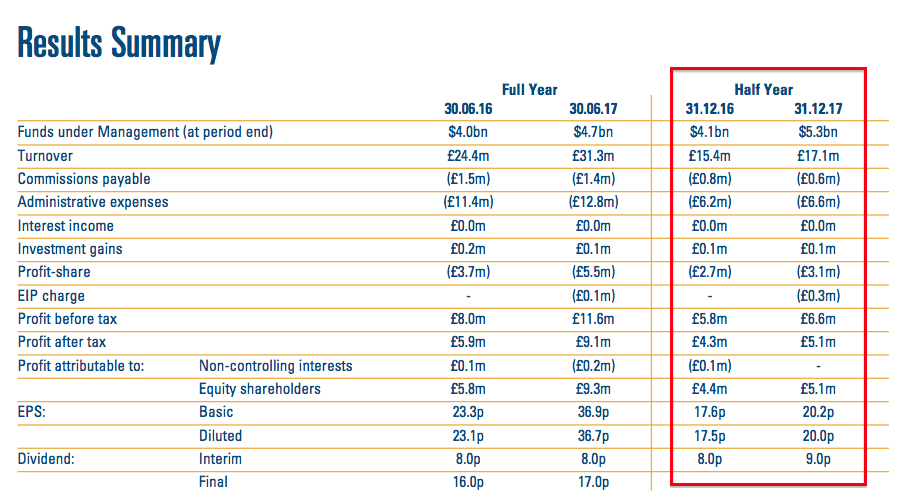
* These summary figures showed CLIG’s best-ever first half
CLIG’s monthly website updates had already suggested these results would be positive.
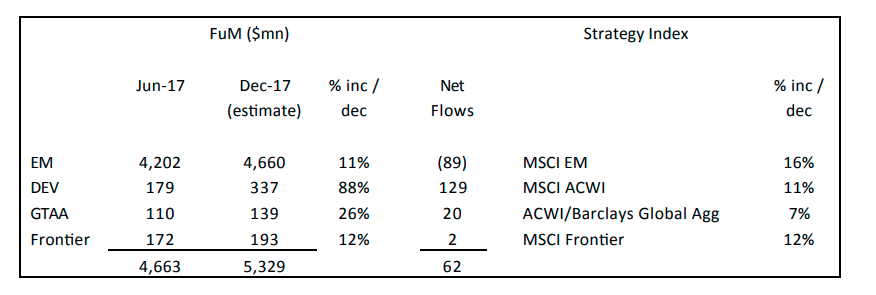
The fund manager’s statement confirmed funds under management (FUM) at the end of December were $5,329m — up 30% from the $4,097m seen twelve months prior and up 14% from the $4,663m seen at the June year-end.
Wider market movements generally underpinned the improvement. However, CLIG did admit its main Emerging Market division had under-performed its benchmark and had witnessed an $89m outflow of client money:
At least CLIG’s smaller divisions — currently representing 13% of FUM — either matched or outran their respective benchmarks.
CLIG’s FUM in dollar terms is now at its highest level since 2011, although the £3.9bn sterling equivalent is a new company record.
The six-month period also boasted CLIG’s best-ever H1 operating profit, while the super 38% operating margin was the highest for ten years.
All of CLIG’s main financial measures moved higher. Revenue gained 10%, pre-tax profit climbed 14%, net cash and investments improved £3.4m to £15.7m, while the interim dividend was raised a penny to 9p per share.
The payout lift was encouraging. Last year CLIG upped its annual dividend for the first time since 2011, and the group’s dividend cover now gives scope for further payout uplifts…
* Dividend-cover template suggests payout could increase further
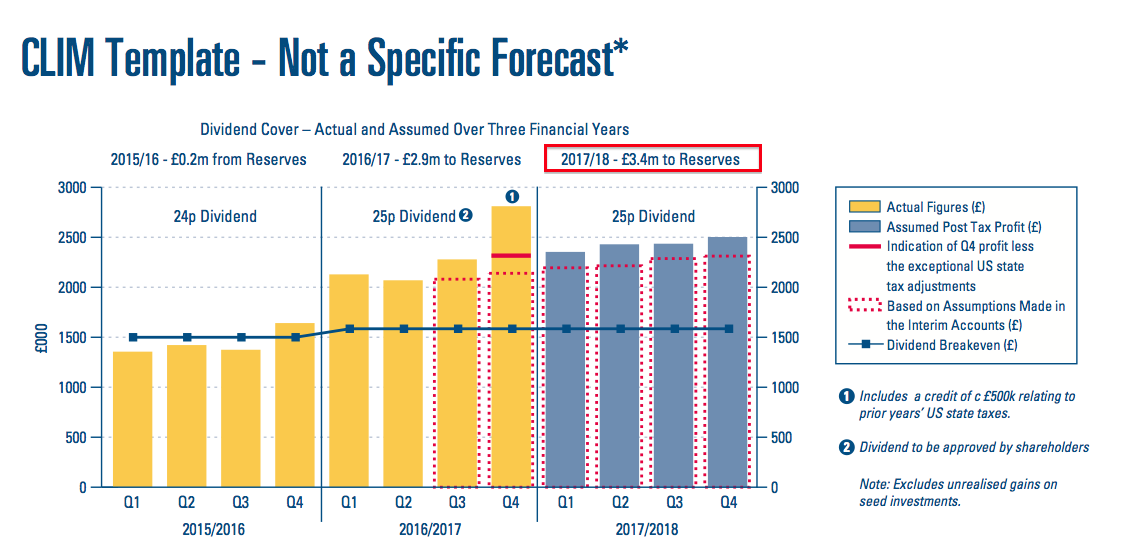
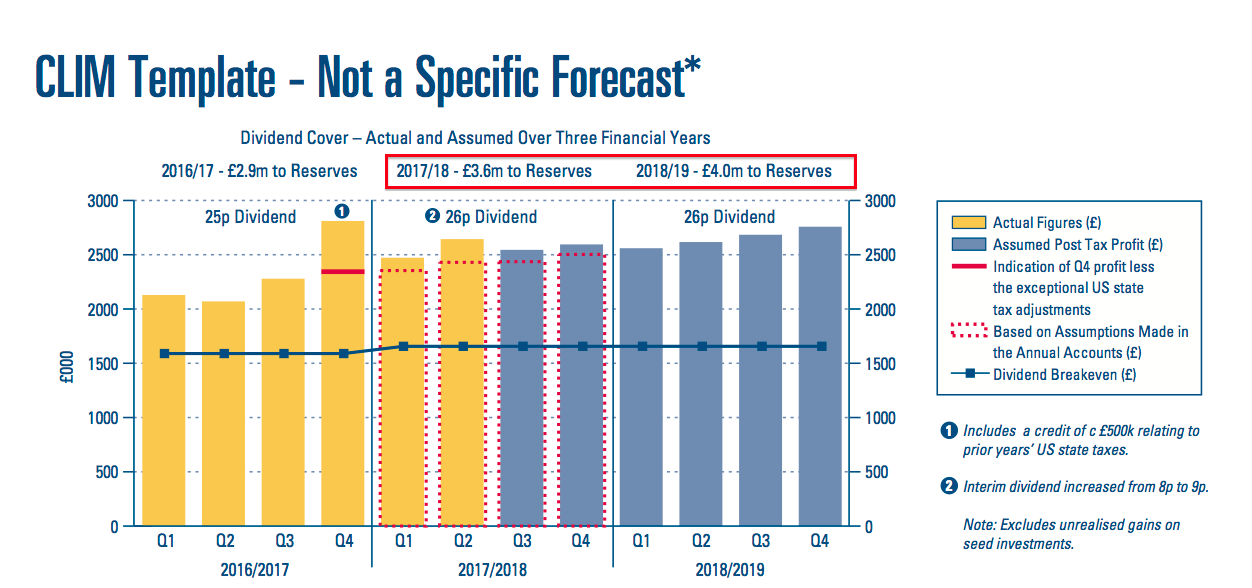
A revised dividend-cover template within CLIG’s shareholder presentation suggests the payout may be lifted again for 2018.
Three months ago the template looked like this:
And now it looks like this:
Essentially CLIG reckons it could now retain earnings of £3.6m during the current year — versus £3.4m previously expected.
Initial assumptions for the 2018/2019 financial year indicate earnings of £4.0m could be retained after dividends (of approximately £6.6m).
CLIG was happy to distribute all of its earnings as dividends between 2013 and 2016. So perhaps some of that £4m ‘cushion’ will be paid to shareholders, too.
Mind you…
While CLIG should still be given credit for publishing these templates — I have never come across another quoted business that provides anything similar — the templates have often proved to be somewhat optimistic.
What typically undoes CLIG’s projections is a mix of falling markets and client withdrawals.
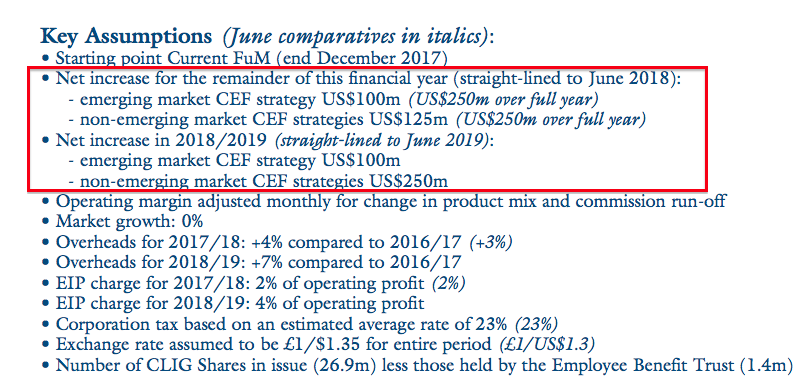
For what it is worth, CLIG estimates it can collect an extra $225m of client money during the current second half, and an extra $350m during the following financial year:
Those estimates do look ambitious when just $62m (net of withdrawals) was received from clients during the last six months (when markets were favourable).
* Another look at an embarrassing chart and some snippets from a past AGM
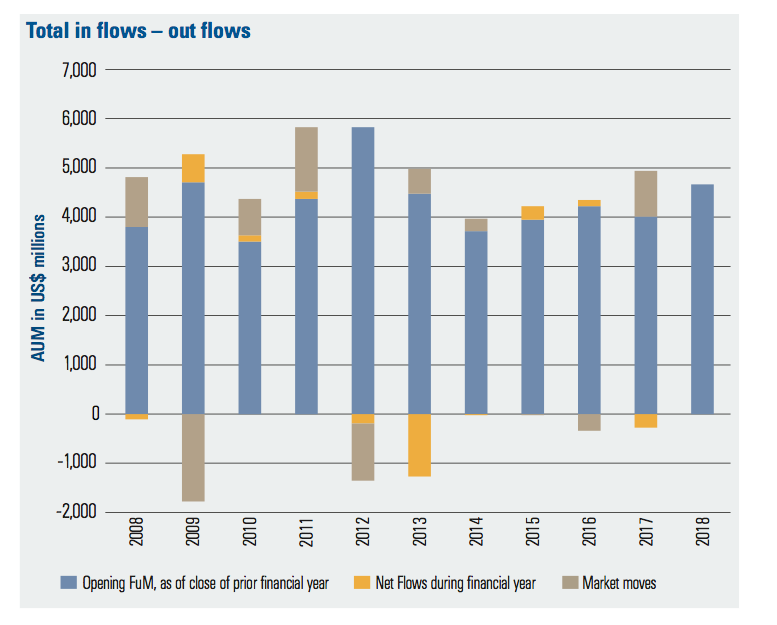
CLIG’s 2017 annual report (point 2) contains this embarrassing chart:
The yellow boxes represent the net amount of FUM added or withdrawn each year.
As you can see, the amount of new money added between 2014 and 2017 is shockingly low — and the net $62m received during the latest six months continues the lacklustre efforts.
A couple of snippets from a past AGM explain the problem.
First, CLIG’s main Emerging Market strategy is not ‘scalable’ — the associated FUM is apparently limited by a ‘capacity constraint’ of between $4bn and $5bn. I assume the constraint is due to the size and scope of the underlying investment opportunities.
Emerging Market FUM currently stands at $4.7bn, so further headroom there appears limited. New clients will therefore gravitate towards CLIG’s other strategies, but these have shorter track records and may be harder to sell.
On this selling point, I was told at the AGM that the group’s three ‘business development’ employees are only ‘introducers’ of clients to CLIG. The actual selling is done by the fund-management team, which I thought was odd. In my view, fund managers are more used to spreadsheets than marketing!
Over time I have sadly concluded that CLIG is simply reluctant (or unable) to promote itself well to new customers. The word “marketing” is mentioned only once within the 2017 annual report narrative.
* The main Emerging Market strategy is trailing various indices
CLIG’s investment performances may not be helping the marketing cause.
The H1 statement admitted:
“The Emerging Market strategy under-performed due to widening discounts and an underweight to the Chinese IT sector which posted very strong returns.”
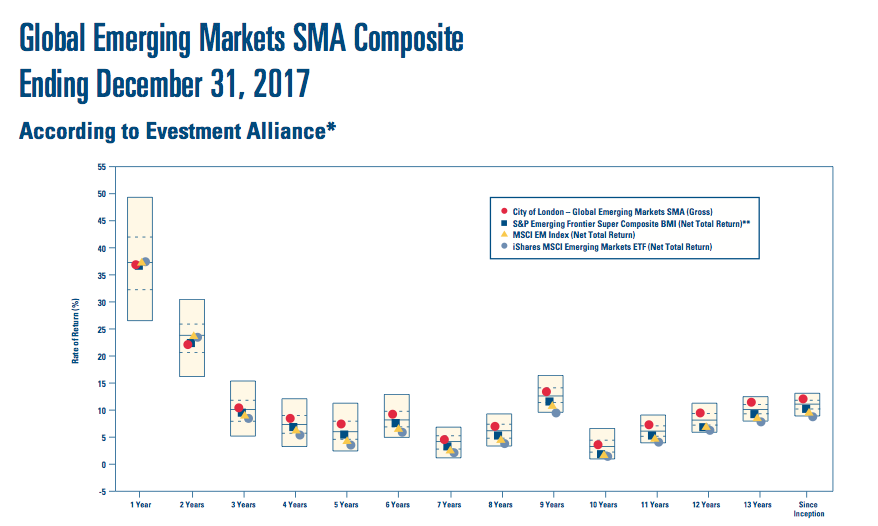
The shareholder presentation contained this chart:
The red circles show CLIG’s representative Emerging Market fund lagging various benchmarks during the last two years.
* The EIP will skim 4% of profit
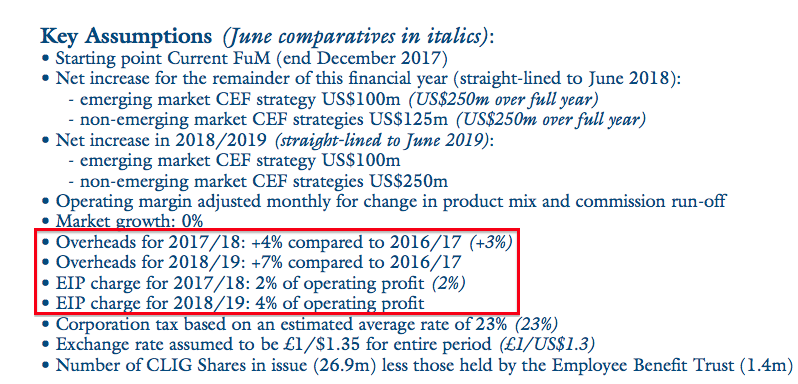
The small-print on the aforementioned dividend-cover template highlighted modest cost increases:
Predicted overheads are set to rise 4% this year, versus 3% expected six months ago. The cost base may then advance another 3% for 2018/2019.
However, don’t forget the outrageous extra bonus pot, which is now expected to skim 4% from operating profit next year (this employee incentive plan can snaffle up to 5%).
* Illustrative profit table revised for lower fee rate
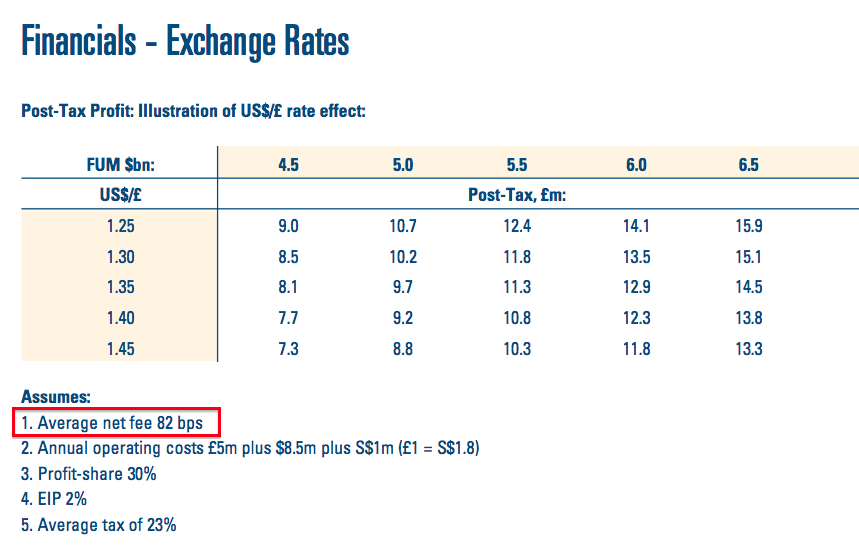
CLIG’s regular exchange-rate/FUM matrix has once again been tweaked unfavourably.
This time last year, CLIG’s presentation showed clients were paying fees at 85 basis points on the money they invested. The figure dropped to 84 basis point six months ago, and the latest presentation now states 82 basis points:
For my valuation sums, I have modified this profit table to assume the employee incentive plan takes the full 5% of pre-bonus operating profit.
Valuation
Using the above exchange-rate/FUM table, but applying a 35% staff profit-share/EIP, I arrive at earnings of £10.06m or 37.5p per share with client money at $5.3bn and £1 buying $1.39.
After adjusting for cash, investments and regulatory capital, my enterprise value (EV) for CLIG is approximately £100m or 374p per share. Dividing that EV by my earnings guess gives me a possible P/E of 10.
That multiple does not look extravagant in the current market, although bear in mind:
i) the shares have rarely traded at an extended multiple in the past;
ii) little progress has been made attracting new FUM for some years, and;
iii) founder/chief exec Barry Olliff retires at the end of 2019 and is currently reducing his 8% shareholding.
In my view, a notable re-rating will be hard to achieve until the group starts to win additional clients that bring significant FUM.
Still, I am happy to collect the trailing 26p per share dividend and enjoy the 6.0% income, and hope one day there could be some radical marketing developments.
Maynard Paton
PS: You can now receive my Blog posts through an occasional e-mail newsletter. Click here for details.
Disclosure: Maynard owns shares in City of London Investment.

City of London Investment (CLIG)
Interim results
These results confirmed the summary figures released in January and reviewed in the Blog post above.
However, the management narrative did include a few interesting snippets and charts.
1) Client fees
I noted in the Blog post above that client fees as a percentage of assets managed had declined from 85 to 82 basis points during the past twelve months.
The results narrative addressed this change:
“Shareholders will appreciate that the graph shown on this page reflects this changing mix in our business in terms of overall fees. In my opinion the level of fees will not reduce significantly further in the next two years.”
Here is the graph:
I am encouraged the fees will not reduce “significantly further” during the next two years.
2) Client numbers
CLIG’s results statement was proud to present a client longevity graph:
Sure, CLIG’s clients are loyal. But the trouble is, they don’t like adding extra money for CLIG to manage — and their numbers are not growing. You will see CLIG’s client base has dropped by three since June 2014.
As I wrote in the Blog post above:
“As you can see, the amount of new money added between 2014 and 2017 is shockingly low — and the net $62m received during the latest six months continues the lacklustre efforts…
Over time I have sadly concluded that CLIG is simply reluctant (or unable) to promote itself well to new customers. The word “marketing” is mentioned only once within the 2017 annual report narrative.”
3) Staff numbers
I can’t recall a quoted company ever showing an employee-by-department graph. Yet here is one from CLIG:
CLIG says:
“Please review above the changing relationships in terms of the number of employees in each department over the past ten years.”
I have highlighted the lavender-coloured line that reflects that only three staff are employed in business development and marketing. There must be a correlation between this level of staffing and the lack of new client money.
4) Succession hint
The results narrative suggested that Tom Griffith, CLIG’s chief operating office, could succeed Barry Olliff as chief exec:
“As was originally reported in 2015, Barry Olliff, our Founder, CEO and CIO, has informed the Board that he intends to retire as of 31st December 2019. Your Board has therefore increasingly been working on ensuring a smooth transition.
The first major step in securing succession was the appointment, announced with the interim report in January 2014, of Mark Dwyer taking responsibility for the Emerging Markets CEF products. Mark was subsequently appointed to the Board in October 2015 as CIO of EM CEFs which then amounted to over 90 per cent of our FuM.
I am now delighted to announce the appointment of Tom Griffith, a long standing director and our current COO, as Deputy CEO working alongside Barry Olliff. I am of the view that a successful succession is best achieved by way of an internal appointment and we are very fortunate in having someone as well qualified for the role as is Tom Griffith.”
I am pleased Mr Olliff seemingly has an internal successor lined up. That way there should be less chance of any ‘cultural fit’ difficulties.
That said, Mr Olliff appointed his then finance director as chief exec during 2013, only for the new boss to resign a few months later in mysterious circumstances but with a fat payoff.
5) Valuation
The results narrative confirmed client assets under management at 31st January 2018 were $5.8 billion.
Using the exchange-rate/FUM table shown in the Blog post above, but applying a 35% staff profit-share/EIP, I arrive at earnings of £11.35m or 42.25p per share with client money at $5.8bn and £1 buying $1.40.
After adjusting for cash, investments and regulatory capital, my enterprise value (EV) for CLIG is approximately £100m or 374p per share at a 430p share price. Dividing that EV by my earnings guess gives me a possible P/E of 8.9.
Maynard
City of London Investment (CLIG)
Funds under Management update
FUM at the end of February had declined from almost £5.8bn to below $5.5bn:
https://citlon.com/investor-relations/funds-under-management.php
Using the exchange-rate/FUM table shown in the Blog post above, but applying a 35% staff profit-share/EIP, I arrive at earnings of £10.54m or 39.24p per share with client money at $5.493bn and £1 buying $1.39.
Maynard
City of London Investment (CLIG)
Funds under Management update
FUM during March declined by $72m to $5,419m:
https://citlon.com/investor-relations/funds-under-management.php
Using the exchange-rate/FUM table shown in the Blog post above, but applying a 35% staff profit-share/EIP, I arrive at earnings of £9.96m or 37.1p per share with client money at $5,419m and £1 buying $1.43.
Maynard
Maynard
Steady progress
Thanks
David
City of London Investment (CLIG)
Q3 Interim Management Statement
Nothing much of significance here. The latest level of funds under management had already been disclosed on the group’s website (see previous Comment). The “active pipeline” of possible mandates remains “in excess of $400m“.
Interesting to note the Developed strategy received extra client money of $102m, equivalent to 30% of the department’s FUM at the start of the quarter. Apparently a “focused marketing strategy” helped attract the money — and I wonder if such a “focused marketing strategy” can be applied to the much larger Emerging Market division. Efforts there to attract new client money have been lamentable over the years.
Here is the full text:
——————————————————————————————————————
City of London (LSE: CLIG), a leading specialist asset management group focused on emerging markets and closed-end funds, provides a third quarter trading update for the period 1 January 2018 to 31 March 2018. Total funds under management (FuM) at 31 March 2018 were US$5.4 billion (£3.9 billion). This compares with US$5.3 billion (£3.9 billion) at the Company’s half-year on 31 December 2017. A breakdown by strategy follows:
Positive relative investment performance was recorded in the Developed strategy, whilst the EM, GTAA and Frontier strategies underperformed. Sharply wider discount movements, driven by increased volatility, drove relative performance, whilst the Developed strategy benefitted from strong NAV performance. Net flows were positive in aggregate over the period, particularly in the Developed strategy which continues to benefit from a focused marketing strategy and excellent long term investment results.
With regards to business development, the Group continues to maintain an active pipeline across all of its major CEF offerings with an increased interest in the diversification CEF strategies. In total the active pipeline is in excess of US$400 million, these include opportunities that are spread across Emerging and Developed Markets, Global Tactical Asset Allocation, Tactical Income, and Frontier CEF strategies.
Operations
The Group’s income accrues at a weighted average rate of approximately 80 basis points, net of commissions and custody charges. “Fixed” costs are c£1.0 million per month, and accordingly the current run-rate for operating profit, before profit-share at 30%, and an estimated EIP charge of 2%, is approximately £1.5 million per month based upon current FuM and a US$/£ exchange rate of US$1.42 to £1.
Further to the City of London Investment Management press release of 12th April (see link below), the Group received notice of an appeal on 16th April. The City of London Investment Group would estimate that at the present time the effect on the Group P&L will not be material.
A link to that press release follows:
https://www.prnewswire.com/news-releases/city-of-london-issues-open-letter-to-stockholders-of-the-china-fund-300629156.html
Dividends
The interim dividend of 9 pence per share was paid on 16 March 2018. The Board will announce the final dividend on Tuesday 17 July 2018 in its pre-close trading update.
——————————————————————————————————————
Maynard
City of London Investment (CLIG)
Funds under Management update
FUM during April declined by $50m to $5,369m:
https://citlon.com/investor-relations/funds-under-management.php
Using the exchange-rate/FUM table shown in the Blog post above, but applying a 35% staff profit-share/EIP, I arrive at earnings of £10.56m or 39.3p per share with client money at $5,369m and £1 buying $1.35.
Maynard
City of London Investment (CLIG)
Funds under Management update
FUM during May declined by $121m to $5,248m:
https://citlon.com/investor-relations/funds-under-management.php
Using the exchange-rate/FUM table shown in the Blog post above, but applying a 35% staff profit-share/EIP, I arrive at earnings of £10.49m or 39.1p per share with client money at $5,248m and £1 buying $1.32.
Maynard
City of London Investment (CLIG)
Funds under Management update
FUM during June declined by $141m to $5,107m:
https://citlon.com/investor-relations/funds-under-management.php
FUM has declined by $224m since the start of 2018.
Using the exchange-rate/FUM table shown in the Blog post above, but applying a 35% staff profit-share/EIP, I arrive at earnings of £9.95m or 37.0p per share with client money at $5,107m and £1 buying $1.33.
Maynard