13 July 2017
By Maynard Paton
Quick update on Daejan (DJAN).
Event: Preliminary results for the year to 31 March 2017 published 12 July 2017
Summary: This time last year DJAN’s management was full of Brexit gloom, but here we are now with the commercial property group declaring new highs for revenue, net asset value and the dividend. Of course, the board’s caution may eventually prove to be shrewd, and I’m hopeful the veteran executives will be able to navigate through any wider property uncertainty — assisted in part by the firm’s relatively low level of debt. The shares trade at 63% of net asset value and I continue to hold.
Price: £64
Shares in issue: 16,295,357
Market capitalisation: £1,043m
Click here for all my previous DJAN posts
Results:
My thoughts:
* Another set of record results with NAV surpassing £100 per share
These 2017 figures were accompanied by a little more management text than usual.
This year shareholders were treated to a few extra lines concerning two new director appointments. Here is the full narrative:
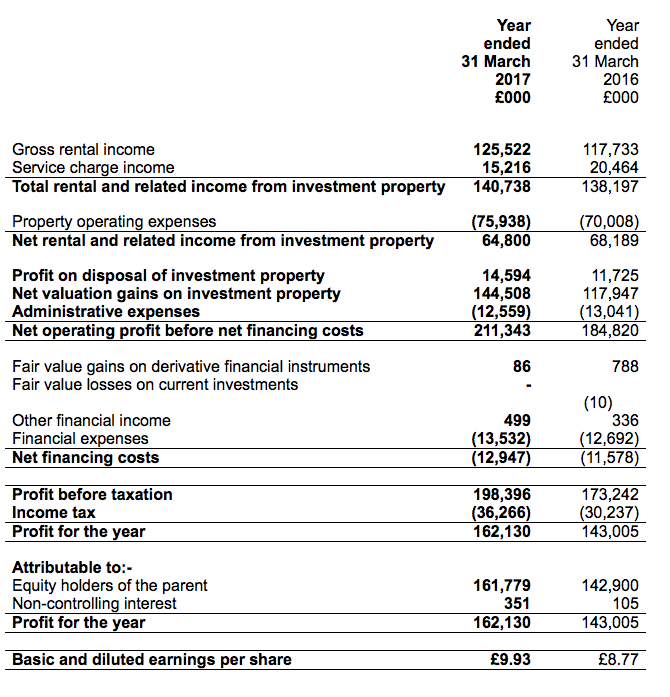
“The revaluation of the investment property portfolio at the year end has resulted in a net valuation surplus for the year of £144,508,000 (2016 – £117,947,000). The board has recommended a final dividend of 63p per share in respect of the year ended 31 March 2017 payable on 10 November 2017 to shareholders on the register on 13 October 2017. This will make a total dividend for the year of 98p (2016 – 93p).
Earnings per share is calculated by reference to profit on ordinary activities after taxation attributable to equity holders of the parent of £161,779,000 (2016 – £142,900,000) and 16,295,357 (2016 – 16,295,357) ordinary shares being the weighted average number of ordinary shares in issue during the year. Equity shareholders’ funds per share is calculated by reference to total equity attributable to equity holders of the parent of £1,655,715,000 (2016 – £1,480,025,000) and the ordinary shares detailed above.
Daejan Holdings PLC is pleased to announce the following appointments as non-executive directors:
Mr Sander Srulowitz, senior partner of Sonnenschein, Sherman & Deutsch, a New York law firm specialising in property law. Daejan now holds approximately 25% of its assets in the United States and will welcome Mr Srulowitz’s wide experience in USA property matters.
Mr Chaim B. Freshwater, who is the son of Mr S. I. Freshwater and currently lectures at a London college. His appointment is a further step in our succession planning.”
As usual, the figures were then left to do all of the talking.
However, I must admit one or two numbers within the statement will require the forthcoming 2017 annual report to provide more detail.
I was certainly surprised that total rental and service revenue gained only 2% to £141m, given November’s half-year results had revealed first-half revenue had climbed 6%.
The numbers showed full-year service charge income falling by £5m to £15m, and a quick check back to the 2016 annual report revealed:
“Service charge income has increased due to a number of major works programmes across the UK portfolio together with new lettings.”
I now get the impression the £20m service income reported for 2016 was perhaps bolstered by significant, one-off work.
At least full-year US rental and service revenue advanced 19% to £49m, due in part to the stronger USD:
| H1 2016 | H2 2016 | FY 2016 | H1 2017 | H2 2017 | FY 2017 | ||
| UK revenue (£k) | 46,465 | 50,614 | 97,079 | 46,436 | 45,423 | 91,859 | |
| US revenue (£k) | 19,755 | 21,363 | 41,118 | 23,778 | 25,101 | 48,879 | |
| Total revenue (£k) | 66,220 | 71,977 | 138,197 | 70,214 | 70,524 | 140,738 |
The lower service income led to operating profit falling 5%, although valuation gains of £145m were impressive and helped pushed DJAN’s net asset value (NAV) to a new all-time high of £102 per share.
Progress was also assisted by currency movements, which added £29m or £1.78 per share to NAV:
| Year to 31 March | 2013 | 2014 | 2015 | 2016 | 2017 |
| Net asset value (£k) | 984,870 | 1,110,468 | 1,345,818 | 1,480,025 | 1,655,715 |
| Net asset value per share (p) | 6,044 | 6,815 | 8,259 | 9,082 | 10,161 |
| Revenue (£k) | 111,037 | 112,202 | 128,976 | 138,197 | 140,738 |
| Operating profit (£k) | 33,084 | 32,863 | 47,114 | 55,148 | 52,241 |
| Profit on property disposal (£k) | 6,612 | 11,320 | 12,036 | 11,725 | 14,594 |
| Net valuation gain (£k) | 82,694 | 119,648 | 229,722 | 117,947 | 144,508 |
| Finance expense (£k) | (11,094) | (11,129) | (11,763) | (12,692) | (13,532) |
| Other items (£k) | 391 | 11,803 | 430 | 1,114 | 585 |
| Pre-tax profit (£k) | 111,687 | 164,505 | 277,539 | 173,242 | 198,396 |
| Earnings per share (p) | 550 | 919 | 1,395 | 877 | 993 |
| Dividend per share (p) | 79 | 82 | 88 | 93 | 98 |
With revenue, NAV and the dividend setting new peaks, I guess the Brexit concern expressed by DJAN’s management in the 2016 annual report — “adverse impacts on rental income, capital values, vacancy rates and bad debts” — has yet to materialise just yet.
* Cash flow and balance sheet
I wrote in November that DJAN’s first-half operational cash flow looked a little low, and these full-year figures also showed profit not being converted into cash too well.
Indeed, the £13m shortfall between reported operating profit and operational cash flow is the largest since at least 2005:
| Year to 31 March | 2013 | 2014 | 2015 | 2016 | 2017 |
| Operating profit (£k) | 33,084 | 32,863 | 47,114 | 55,148 | 52,241 |
| Cash generated from operations (£k) | 35,379 | 32,167 | 41,205 | 61,529 | 39,150 |
| Difference (£k) | 2,295 | (696) | (5,909) | 6,381 | (13,091) |
I had speculated in November that perhaps a few tenants have experienced difficulties paying their rents. I will have to double-check the 2017 annual report to discover whether overdue rents have increased further.
I should add that DJAN’s cash conversion has not been too bad over time. Generally speaking, some 95% of reported operating profit is translated into cash.
Similar to last year, DJAN decided to keep capital expenditure below the substantial levels of 2013, 2014 and 2015:
| Year to 31 March | 2013 | 2014 | 2015 | 2016 | 2017 |
| Acquisition and development of investment property (£k) | (57,668) | (47,797) | (43,460) | (26,939) | (27,726) |
| Proceeds from sale of investment property (£k) | 28,454 | 13,093 | 16,772 | 12,807 | 18,242 |
DJAN’s debt continues to look very manageable. The stronger USD — most of DJAN’s loans are held in the US — was the main reason total borrowings increased by £31m to £352m during the year.
The debts represent just 16% of the £2.3bn property estate.
Valuation
Trading at £64, the share price is equivalent to 63% of the latest £102 per share NAV.
Although the discount appears sizeable, these shares have rarely traded at close to NAV for years. Reasons for the persistent discount probably include the board’s 80% family shareholding, its unconventional working culture and the complete absence of any takeover possibilities.
Another way of looking at DJAN’s value is from a return on equity standpoint.
During recent 10-year periods, DJAN has earned at least 7% a year from its asset base:
| 10yrs to 2013 | 10yrs to 2014 | 10yrs to 2015 | 10yrs to 2016 | 10yrs to 2017 | |
| Start NAV (£) | 28.81 | 30.96 | 38.94 | 45.74 | 52.88 |
| End NAV (£) | 60.44 | 68.15 | 82.59 | 90.82 | 101.61 |
| Dividends accumulated (£) | 7.04 | 7.28 | 7.55 | 7.83 | 8.11 |
| Total return (£) | 38.67 | 44.47 | 51.20 | 52.91 | 56.84 |
| Total return/Start NAV (CAGR %) | 8.9 | 9.3 | 8.8 | 8.0 | 7.6 |
Assuming DJAN can earn an average of, say, 8% a year from its £102 per share asset base, typical annual earnings could be £8.13 per share — represented by a mix of rental profit and valuation gains.
In theory at least, enjoying £8.13 per share a year from a £64 entry price is equivalent to a worthwhile 13% annual return.
Meanwhile, the 98p per share dividend supports a measly 1.5% income.
Maynard Paton
Disclosure: Maynard owns shares in Daejan.

Daejan (DJAN)
Publication of 2017 annual report
Here are the points of interest:
1) Extra management narrative
The annual report provided a little more management comment on the group’s 2017 progress.
The slower rate of total rental and service income was explained, while the (apparently) anti-Brexit board remain somewhat cautious about the domestic economy:
Further Brexit comment here:
Still, the business continues to develop sites and the report provided more details than last year about what was going on:
Tucked away in the report was an admission that UK rents have been flat overall:
I guess that supports management’s thoughts on the wider UK economy.
2) Risk factors
A quick check of the report’s ‘risk’ factors did not reveal anything new or untoward.
I see the group has added the following two lines about its dependence on the lead executives. There is now a “strong group management team” in place:
It also appears the group is taking a more active approach to debt recovery, with the following highlighted line being a new 2017 addition:
Plus, the remarks concerning the availability of banking finance have been revised from last year and the new text suggests there is less risk of problems than before:
3) Director pay
The executive directors enjoyed another pay rise, this year up 4.5% to a chunky £1.15m each:
Chairman Benzion Freshwater has seen his basic pay advance 8.4%pa in the last five years and 6.7%pa in the last ten.
In contrast, the dividend is up about 4-5% pa during the last five and ten years, while NAV is up 12.9%pa in the last five and 7.5%pa in the last ten.
So I continue to think the wage hikes have been generally justified, though a £1.15m basic salary does look very hefty regardless of the size of the business.
Still, I can’t argue with management’s track record and if £1m-plus salaries are required to keep the record going, then that’s something shareholders have to live with.
Note that the board does not collect bonuses and does not enjoy pension contributions. Nor is there any option scheme.
4) Valuation gains
This snapshot confirms that each of DJAN’s property divisions reported valuation gains:
I note UK residential has performed better than UK commercial (again), and the UK split is 43:57 — pretty much the average for the last decade or so:
5) Trade receivables, trade payables and cash flow
The annual report did not provide any obvious clues to solve the cash-flow question I raised in the Blog post above.
I speculated that perhaps a few tenants have experienced difficulties paying their rents.
Well, the trade receivables note did not indicate a vast increase in late payers:
In fact, the £9.9m impairment for the year represents 23% of the £43.5m outstanding gross receivables — the lowest proportion since the relevant figures were first disclosed in 2010.
Plus, the net £33.6m net trade receivable figure represents 24% of revenue, which is a slight improvement on the 26% from last year.
So there appears nothing awry with trade receivables. Nor is there anything dramatic going on with trade payables (the money DJAN owes its supplies):
A £4m movement movement there does not explain the £13m operating cash flow difference as mentioned in my Blog post above.
So at the moment I am a bit stumped on the cash flow issue.
6) Debt
It’s nice to see DJAN’s additional fixed-rate mortgages being arranged at 3% to 4% rates of interest:
The group paid interest of £13.6m during 2017, which on average debt of £337m = a 4.0% interest rate. The cost for 2015 and 2016 was 3.9% and 4.1% respectively — so no great changes has occurred.
Maynard
Maynard,
Thanks for the analysis. Cautious words from DJAN as the UK navigates Brexit. I didn’t appreciate how much residential property in the US is held by DJAN.
David