10 February 2017
By Maynard Paton
Quick update on BrainJuicer (BJU).
Event: Annual results and shareholder presentation for the twelve months to 31 December 2016 published 09 February 2017
Summary: These impressive annual figures confirmed BJU had enjoyed a magnificent second half. The market-research pioneer confirmed all of its core products had performed well, including the group’s best-selling system that had suffered a wobble during H1. I’m also pleased the accounts remain first class, while it’s not surprising the share-price rating is now expecting further robust growth. However, the usual “limited visibility” of client orders remains a drawback. I continue to hold.
Price: 720p
Shares in issue: 12,217,277
Market capitalisation: £88.0m
Click here for all my previous BJU posts
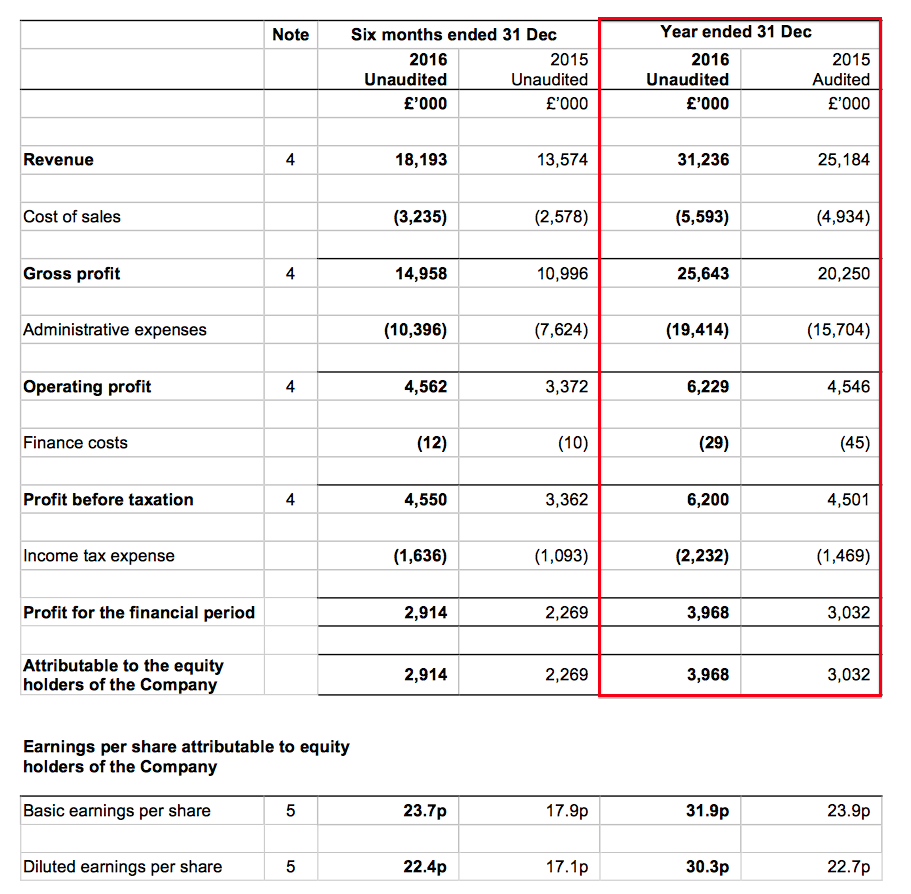
Results:
My thoughts:
* These results were very respectable
Trading updates during December and January had already signalled these results would be very respectable.
In the event, BJU reported revenue up 24% and gross profit — the firm’s “main top-line indicator” — up 27%. Both advances would have been 15% without favourable currency movements.
Certainly the second half enjoyed a greater rate of growth than the first:
| H1 2015 | H2 2015 | FY 2015 | H1 2016 | H2 2016 | FY 2016 | ||
| Revenue (£k) | 11,610 | 13,574 | 25,184 | 13,043 | 18,193 | 31,236 | |
| Operating profit before one-off and start-up costs (£k) | 1,494 | 3,372 | 4,866 | 1,927 | 4,608 | 6,535 | |
| One-off and start-up costs (£k) | (320) | - | (320) | (260) | (46) | (306) | |
| Operating profit (£k) | 1,174 | 3,372 | 4,546 | 1,667 | 4,562 | 6,229 |
BJU’s H1 statement indicated the group’s first half had enjoyed about 10% growth adjusted for currency movements, and I’m guessing the second half must have experienced something close to a 20% underlying advance.
These annual figures showed record levels of revenue, profit and earnings, with progress accelerating following a few subdued years:
| Year to 31 December | 2012 | 2013 | 2014 | 2015 | 2016 |
| Revenue (£k) | 20,822 | 24,457 | 24,645 | 25,184 | 31,236 |
| Operating profit (£k) | 1,513 | 3,550 | 4,301 | 4,546 | 6,229 |
| Other items (£k) | - | 14 | - | - | - |
| Finance income (£k) | 2 | (8) | (15) | (45) | (29) |
| Pre-tax profit (£k) | 1,515 | 3,556 | 4,286 | 4,501 | 6,200 |
| Earnings per share (p) | 8.3 | 19.4 | 23.0 | 24.0 | 31.9 |
| Dividend per share (p) | 3.1 | 3.9 | 4.3 | 4.5 | 1.1 |
| Special dividend per share (p) | - | 12.0 | 12.0 | - | 12.0 |
It’s probably fair to predict 2017 will witness further progress, if only from favourable currency factors.
US customers represented 42% and other overseas clients represented 33% of BJU’s gross profit during the year, and the first six months of 2017 ought to benefit from the weaker, post-Brexit GBP in comparison to H1 2016.
Something to note about these results was the absence of a final dividend. BJU is shifting its year-end to March and will declare a final payout when the group publishes its 15-month results during June.
* A new “express” product appears to have steadied the earlier wobble
I was pleased to see BJU’s core products all performing well after a small wobble at the half-year stage.
September’s interims revealed the Predictive Markets service — the group’s largest fee-earner — had suffered a 4% gross-profit drop during H1. At the time, BJU referred to “pricing pressure” and plans to launch a cheaper “express” version.
I’m glad these results showed the new “express” version working well. I calculate Predictive Markets gross profit jumped 28% during H2 and 12% for the full year.
Overall, gross profit from BJU’s core products advanced by 18% for the year. The group claims much more of the income from these services is now “ongoing in nature” rather than “ad-hoc”.
The chart below from BJU’s shareholder presentation is useful. It shows that gross profit from the group’s main products has surged from about £7.5m to beyond £20m between 2011 and 2016:

* Financials remain first class
Once again I could not fault BJU’s accounts.
In particular, cash flow remains excellent:
| Year to 31 December | 2012 | 2013 | 2014 | 2015 | 2016 |
| Operating profit (£k) | 1,513 | 3,550 | 4,301 | 4,546 | 6,229 |
| Depreciation and amortisation (£k) | 526 | 465 | 425 | 459 | 446 |
| Net capital expenditure (£k) | (231) | (139) | (273) | (322) | (176) |
| Working-capital movement (£k) | (278) | 1,184 | (89) | (1,053) | 1,183 |
| Net cash (£k) | 3,755 | 6,188 | 5,347 | 6,365 | 7,754 |
Cash capital expenditure continues to be more than covered by the depreciation and amortisation charged to the income statement. Meanwhile, working-capital requirements continue to be modest and last year produced a favourable inflow of cash.
The super cash generation allowed £3.5m to be spent on buybacks, £2.1m to be spent on ordinary/special dividends, and £1.4m to be added to the bank balance. The £7.8m year-end cash position is equivalent to 64p per share. BJU continues to operate without debt and remains free of any final-salary pension obligations.
BJU’s operating margin increased once again and, at 20%, supports the notion the business enjoys a lucrative advantage with its ‘System 1’ market-research techniques. (The margin is even higher if you consider gross profit to be BJU’s “main top-line indicator”):
| Year to 31 December | 2012 | 2013 | 2014 | 2015 | 2016 |
| Operating profit/revenue (%) | 7.3 | 14.5 | 17.5 | 18.1 | 19.9 |
| Operating profit/gross profit (%) | 9.4 | 18.6 | 22.2 | 22.4 | 24.3 |
The return on equity figures (adjusted for the cash position) continue to be astounding as well:
| Year to 31 December | 2012 | 2013 | 2014 | 2015 | 2016 |
| Return on average equity (%) | 30.1 | 88.4 | 135.4 | 115.9 | 181.1 |
Valuation
BJU’s outlook was the usual mix of optimism and caution:
“We will continue to focus on our core products, particularly Ad Testing and Brand Tracking where we are beginning to get a foothold in large clients. These products are comparatively easy to grow and scale, and they also provide more revenue visibility than our other products.”
“Nevertheless, our business still remains predominantly ad hoc, with limited revenue visibility, and as always we need to acknowledge that we cannot predict with very much certainty how revenue growth will unfold over the coming financial year.
“Having said that, we are pleased with the continued progress across the business and remain confident in its long-term potential.”
Operating profit for 2016 (excluding start-up costs of £306k for a new ad agency) came to £6.5m. Taxed at the group’s 36% rate gives earnings of £4.2m or 34.2p per share.
Adjusting the £88m (at 720p) market cap for the £7.8m net cash position, I arrive at an enterprise value of £80.2m or 656p per share.
Dividing that 656p by my 34.2p earnings per share figure gives a P/E of 19. I suppose that rating is understandable given BJU’s 15% (or more) organic expansion rate and a stock market that’s currently biased towards growth shares.
I must admit, it was much easier to determine whether BJU offered good value around this time last year — when the business had already started to return to double-digit growth yet the shares were rated on a multiple of only 11.
For the record, the trailing ordinary dividend remains at 4.6p per share and supports a tiny 0.6% income.
Maynard Paton
Disclosure: Maynard owns shares in BrainJuicer.

BrainJuicer (BJU)
Valuation and start-up costs
A quick note on BJU’s start-up costs. The group launched a small advertising agency early last year and these results indicated the venture produced a £3056k operating loss. September’s interim statement indicated the start-up lost £260k, so leaving a £46k deficit during H2 (see me H1:H2 table in the Blog post above).
The reduced H2 losses appear promising and suggest the venture may break-even during 2017. As such, I have ignored the venture from my valuation sums.
Maynard
The report was very good and i continue to hold as well, since theres high growth both in high margin products and also espcially in the U.S (which is most importent). But it also seems everything went BJU:s way with growth in almost all geografical areas wich is very rare. My biggest problem is that they slightly lost quantity of customers, of course its good that customers increase spending but it would be easier to se the snowball grow forward if also the number of customers increased over time. A decent part of the FCF is also being eaten up by pretty cheap options to management historically. Maybe its the best way to drive incentives and keep key personal though.
Hello S&U
Thanks for the Comment.
I am not as concerned about the loss of client work.
Historically I understand customers have come and gone, and sometimes they return. BJU has always cited “limited visibility” with its customers’ orders and I guess sometimes there is just not the external marketing budgets available for certain group services. At least BJU admitted to shareholders that it had seen income from two large UK clients decline — which lessens the probability the lower work was due to more sinister reasons. For what it is worth, BJU’s 5-year summary in the 2015 annual report show client numbers growing every year during the timeframe.
Good point about cheap options. The 2014/15/16 LTIP scheme appears to have come good for the management, with EPS growing from 19.4p to 31.9p between 2013 and 2016 = an 18% CAGR. The LTIP scheme required at least a 15% CAGR and a share price of 505p.
This document has more details about the LTIP:
http://media.brainjuicer.com/media/files/BrainJuicer_Group_Plc_-_Notice_of_Meeting_AGM_20144.PDF
I reckon about 53% of the LTIP shares will vest given the 18% CAGR, which equals 591,120 * 53% = around 313k shares (2.6% dilution). At 645p a pop that is £2m to be shared between the three directors. Not bad. That £2m LTIP payout compares to an aggregate £15m operating profit recorded during the same three years.
Has the bonus been worth it? Well, if my £2m sum is accurate-ish, then I think so. If c3% dilution is required to produce another three years of 15%-plus EPS growth and superior share-price upside, then I am all for it.
Indeed, I cannot now complain about this LTIP as I noted the LTIP scheme in my initial investment writeup. I recall thinking back then that if EPS does grow at 15%-plus and the shares do hit 505p, then the LTIP dilution would be a nice problem to have after buying at 325p.
Maynard
(PS I have just noticed your Blog (small cap & exception?) — your English is better than my Swedish! I found this useful link on your site to another BJU write-up. I will have to read that write-up in more depth. Many thanks.)
Yes, i have done the “option calculation” aswell and i belive youre numbers matched mine pretty well and like you say its nog a huge problem if they perform. Rules have tighten up abit latly which is good.
Its not a big deal that they gaind higher incom on a few less customers – but i think fluctuations will be higher that way and maybe this year was abit more lucky than avrage. But overall it looks like a hold to me aswell.
Yes, or “small companies & exeptions” might be the right translation – even though small companies over here are more like macro/nano-cap in the U.K/U.S
Keep up the good work!
S&U
BrainJuicer (BJU)
Notice of General Meeting:
http://media.brainjuicer.com/media/files/2017_Notice_General_Meeting_-final.pdf
BJU is proposing to changes its name to System1 Group PLC and introduce a new Long-Term Incentive Plan.
Here are the name change details:
Name change
Shareholders are being asked to approve the Company’s proposed change of name from BrainJuicer Group PLC to System1 Group PLC (the “Name Change”).
Over the last 16 years BrainJuicer has built an international business by applying Behavioural Science to predicting profitable marketing. At the heart of Behavioural Science is the notion that people use instinct, intuition and emotion to make most decisions. This is known as, “System 1” thinking. Having adopted the System 1 approach to market research and successfully launched our System1 advertising agency (System1 Agency), we believe the Company’s growth will be better served by adopting the System1 name across the group. Within the System1 Group, we will have System1 Agency to produce profitable marketing and System1 Research to predict it. As the ‘System1’ name becomes synonymous with ‘profitable growth’, the business will be well positioned to help clients move towards “5-star marketing” and the growth that comes with it.
If approved, the rebranding will be launched to the public with effect from 1 April 2017, and the Company’s AIM symbol will change from “BJU” to “SYS1”.
It might take me a while to adapt to the new name.
Here are details about the LTIP:
Background
The Executive Directors of the Company have existing LTIP awards that cover the financial years 2013 to 2016. The existing LTIP awards are due to vest in April 2017 and as such the Remuneration Committee are proposing new LTIP awards to be granted to cover the next four financial years, being 2017 to 2021 (commencing on 1 April 2017). Other than the existing LTIP awards due to vest in April 2017 the Executive Directors do not have any unvested stock options or equity awards. It is the Remuneration Committee’s intention that the new LTIP awards will be the only grant made in the next four-year period.
The new LTIP has been designed to support the declared growth strategy of the Company, namely to expand rapidly into a broader marketing services company based on behavioural economics. This will include advertising creation as well as market research and associated marketing services.
Shareholder Consultation
As a part of the LTIP design process, we consulted with our largest shareholders. I would like to thank those who participated in the consultation process for their engagement and feedback which helped shape the new LTIP proposed below. We made a number of changes as a result of the feedback received including a reduction in the maximum award levels and changes to the profit performance condition underpin.
Operation
The new LTIP will run for a four-year period, commencing on 1 April 2017 with vesting dependent on the achievement of stretching performance conditions. We anticipate the 3 Executive Directors excluding the Chief Executive Officer (see below) and 4 Senior Executives will participate with opportunity levels dependent on seniority. Awards will be made in the form of nil cost options or conditional shares (where appropriate for local tax/legal reasons).
Award levels
The maximum individual opportunity that will be granted under the LTIP is as follows:
• Executive Directors: 1.50% of the issued share capital1
• Senior Executives: 1.00% of the issued share capital
The total number of shares that can therefore be granted under the LTIP is equal to 8.5% of the issued share capital.
Performance Conditions
Awards will be subject to stretching Gross Profit growth targets. This will be measured based on the compound annual growth (CAGR) in Gross Profit (as defined in the Annual Report and Accounts) over the four-year period. The number of shares awarded that will vest at different performance levels is as follows:
Threshold: 10% p.a. Gross Profit CAGR
Target: 20% p.a. Gross Profit CAGR
Stretch: 30% p.a. Gross Profit CAGR
In addition there will be a Profit after Tax (“PAT”) and share price underpin. The PAT underpin will operate such that a minimum of 10% p.a. growth must be achieved for vesting up to the Target level, with 20% p.a. PAT growth required for vesting between Target and Stretch levels.
The Gross Profit and PAT growth levels are designed to represent organic growth and as such the Remuneration Committee retains the discretion to make adjustments to the targets and/or the performance measures to take account of any acquisitions or other material events.
The absolute share price underpin will be determined on grant but will be no less than 130% of the mid-market price of the shares on the day the awards are granted. This underpin further mitigates against payment for failure.
As LTIPs go, this scheme does not look too bad to me. It is based on organic growth, requires double-digit growth rates to produce the execs a payout, and (crucially) includes a share-price underpin of at least 130%. The share-price underpin equates to 23% annual average growth during the four years of the scheme. Needless to say, I would be very happy with a 23% CAGR from my BJU shares from here. If it takes an LTIP and up to 8.5% dilution to deliver that sort of 23% return, then so be it.
Maynard
System1 (SYS1)
Grant of Options
So these LTIP options have now been granted. I calculate the total number is 1,124,268, which is indeed 8.5% of the total 13,226,773 share count (12,264,784 in circulation plus 961,989 in treasury).
The forthcoming annual report for the 15 months to 31 March 2017 ought to confirm the vesting details — including I hope the exact share-price ‘underpin’ required for the options to come good. The LTIP documentation to date has indicated a 130% share-price gain was necessary.
Maynard
System 1 (SYS1)
Trading Update:
Here is the full text (my bold):
—————————————————————————————————————-
System1 (formerly BrainJuicer) today releases the following update on trading for the 12 month period ended 31st March 2017.
As previously announced, the Company has changed its year-end from 31 December to 31 March, and this is the first financial reporting period adopting the new year-end date. The Company announced unaudited financial results for the 12 month period ended 31 December 2016 on 9 February. It will be announcing unaudited financial results for the 12 month period ended 31 March 2017, and audited financial results for the 15 month period ended 31 March 2017, on 15 June.
The Company has continued to trade strongly since December 2016. For the 12 month period ended 31 March 2017, vs the 12 months to 31 March 2016, revenue grew by some 27% to approximately £33m and gross profit (our main top line performance indicator) has grown by some 29% to approximately £27m. Excluding the impact of exchange rate movements the increase in revenue was approximately 13% and gross profit was some 15%. These growth rates are similar to those for the 12 month period ended 31 December 2016, as are the product mix and geographic split.
The Company incurred the costs related to its name change (to System1) and the associated significant re-branding exercise, during the period since 31 December 2016. Nevertheless pre-tax profit for the 12 month period ended 31 March 2017 is expected to be around £6.2m, representing 25% growth over the pre-tax profit for the 12 month period ended 31 March 2016, and in line with expectations.
The Company continues to be highly cash generative. Since 31 December 2016, it has paid annual employee bonus payments relating to the 12 months ended 31 December 2016 (totalling £2.4m) and yet had a cash balance of £8.3m as at 31 March 2017 (up from £7.8m as at 31 December 2016). It has no debt.
The Company launched its new name and re-brand on 1st April 2017 and this marks the start of a new chapter. It has built its business by applying Behavioural Science to predicting profitable marketing. Behavioural Science is based on the conviction that people use instinct, intuition and emotion to make most decisions. This is known as “System 1” thinking. Having adopted the System 1 approach to market research and launched the System 1 advertising agency (“System1 Agency”), we are now adopting the System1 name across the business. The Company will have System1 Agency to produce profitable marketing and System1 Research to predict it and, we believe, will be well positioned to help clients move towards what we call “5-star marketing” and the growth that comes with it.
—————————————————————————————————————–
This update sounded promising.
The results for the 12 months to 31 December 2016 (reviewed in the Blog post above) showed revenue of £31.2m and gross profit of £25.6m.
So references to revenue of £33m and gross profit of £27m suggest the quarter to 31 March 2017 enjoyed £1m-2m greater revenue/gross profit than the comparable quarter of 2016. The results for the quarter to 31 March 2017 should be able to be deduced when the 15-month results are published during June.
The £6.2m pre-tax profit figure for the 12 months to 31 March 2017 equals that reported for the 12 months to 31 December 2016 — suggesting the costs of the recent System1 re-branding were indeed “significant”
Cash at £8.2m appears fine, too. The positive working-capital movement for 2016 (referred to in the Blog post above) probably relates to the significant bonuses referred to within this trading update. The bonuses were charged against earnings, but were not paid until after the year-end.
Maynard