27 July 2016
By Maynard Paton
Quick update on City of London Investment (CLIG).
Event: Trading update for the year ending 30 June 2016 published 18 July 2016
Summary: Regular monthly updates had already ensured this statement would not be too surprising. However, CLIG trimmed back its projections for 2017 and despite stagnant funds under management, extra costs are filtering into the business. Fortunately the group should benefit significantly from the weaker pound, and its dollar-based income may currently support a P/E of 10 and 7%-plus yield. I continue to hold.
Price: 330p
Shares in issue: 26,809,771
Market capitalisation: £88.5m
Click here for all my previous CLIG posts
Results summary:
My thoughts:
* Once again, credit must go to management for these speedy summary results
It took CLIG just eleven working days to construct this set of summary annual accounts. I just wish all quoted companies could be this timely when outlining their yearly performance.
Note that CLIG’s RNS on the day did not point to the summary numbers. The group’s website carried a City presentation that included the figures as well as various other charts and stats.
* Funds under management and earnings per share were no surprise
CLIG’s monthly website updates had already indicated the group’s funds under management (FUM) had dropped during the year.
The statement confirmed FUM at the end of June was $4.0bn — down from the $4.2bn seen at the preceding year-end but up from the $3.8bn seen at the December half-year.
My own monthly calculations following the interim numbers had indicated earnings could have been running at 25.3p, 20.0p, 22.0p, 26.8p, 27.2p, and 26.4p.
Funnily enough, the mid-point between my low (20.0p) and high (27.2p) estimates came to 23.6p per share — which is what CLIG reported for the year.
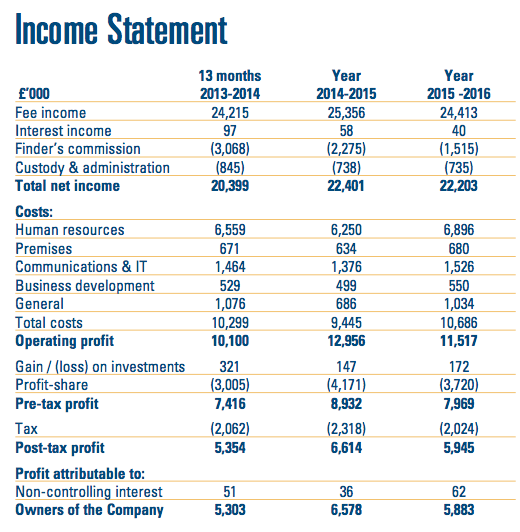
This is how CLIG’s latest results compare to the previous four years:
| Year to 30 June | 2012* | 2013* | 2014** | 2015 | 2016 |
| Funds under management ($m) | 4,479 | 3,713 | 3,944 | 4,211 | 4,005 |
| Revenue (£k) | 34,143 | 29,364 | 24,215 | 25,356 | 24,413 |
| Operating profit (£k) | 11,034 | 8,359 | 6,998 | 8,727 | 7,757 |
| Finance income (£k) | 428 | 501 | 244 | 205 | 212 |
| Other items (£k) | - | - | - | - | - |
| Pre-tax profit (£k) | 11,462 | 8,860 | 7,242 | 8,932 | 7,969 |
| Earnings per share (p) | 33.8 | 24.9 | 20.7 | 26.4 | 23.6 |
| Dividend per share (p) | 24.0 | 24.0 | 24.0 | 24.0 | 24.0 |
(*Year to 31 May; **13 months to 30 June)
* New client money falls short of expectations
CLIG claimed a “positive investment performance” as well as “new and existing client inflows” had helped to mitigate the 12% drop in the firm’s benchmark index during the year.
However, I note the amount of new client money collected was not as great as originally hoped.
The annual presentation from July 2015 had predictied new money of $500m could be garnered during the year just passed: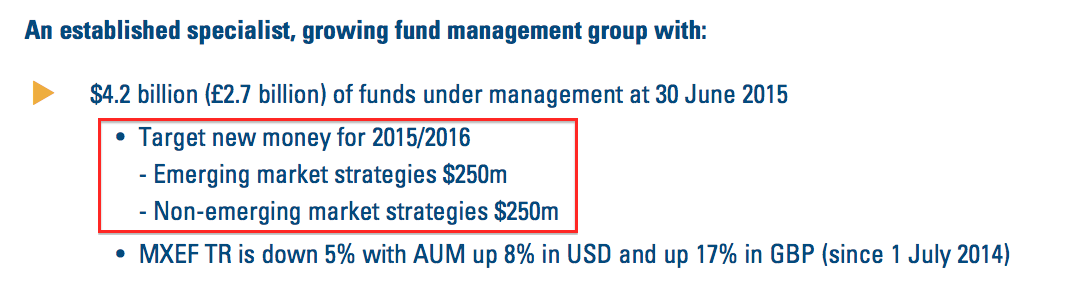
What’s more, the January 2016 presentation suggested an extra $200m from new clients could be received during the second half: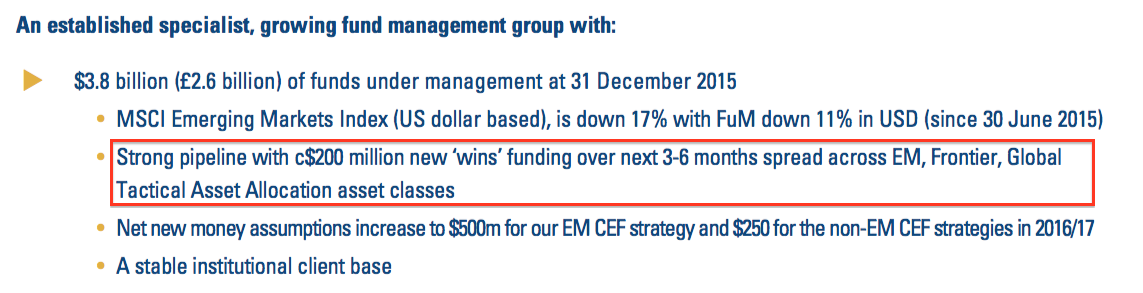
However, I see from the latest 2016 presentation that the money from the 13 new clients secured during 2015 and 2016 came to less than $400m, with about $130m collected in the second half:
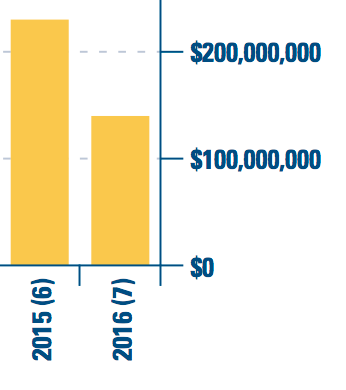 I suppose with emerging markets suffering a rough twelve months, some leeway with client wins should be expected. Nonetheless, it does go to show how precarious CLIG’s client-money assumptions can be.
* Further disappointment with FUM for 2016/17
Another disappointment within the latest presentation was the downgrade for new client money expected for the current 2016/17 financial year.
You may recall CLIG had trumpeted within January’s half-year results that it had lifted its new-money target from $500m to $750m: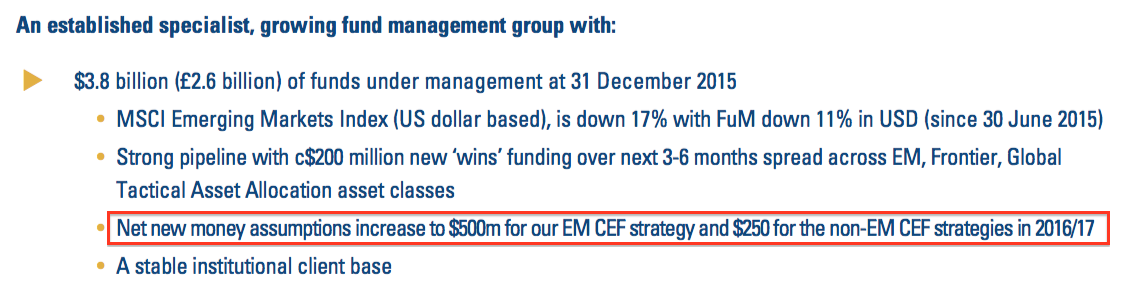
However, that target has now sadly reverted back to $500m: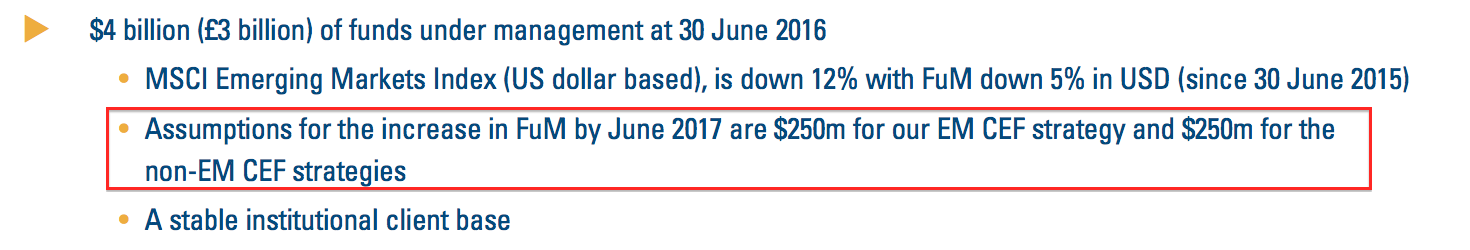
No explanation for the reduction was given.
* Updated dividend-cover prediction becoming rather academic
The shortfalls and changes to CLIG’s FUM projections does increasingly mean that its dividend-cover template is becoming rather academic.
I mean, this time last year the group was predicting for 2015/16 that it could transfer £1.4m to reserves — in other words, pay a maintained 24p per share dividend and still have £1.4m left over to add to the group’s cash balance: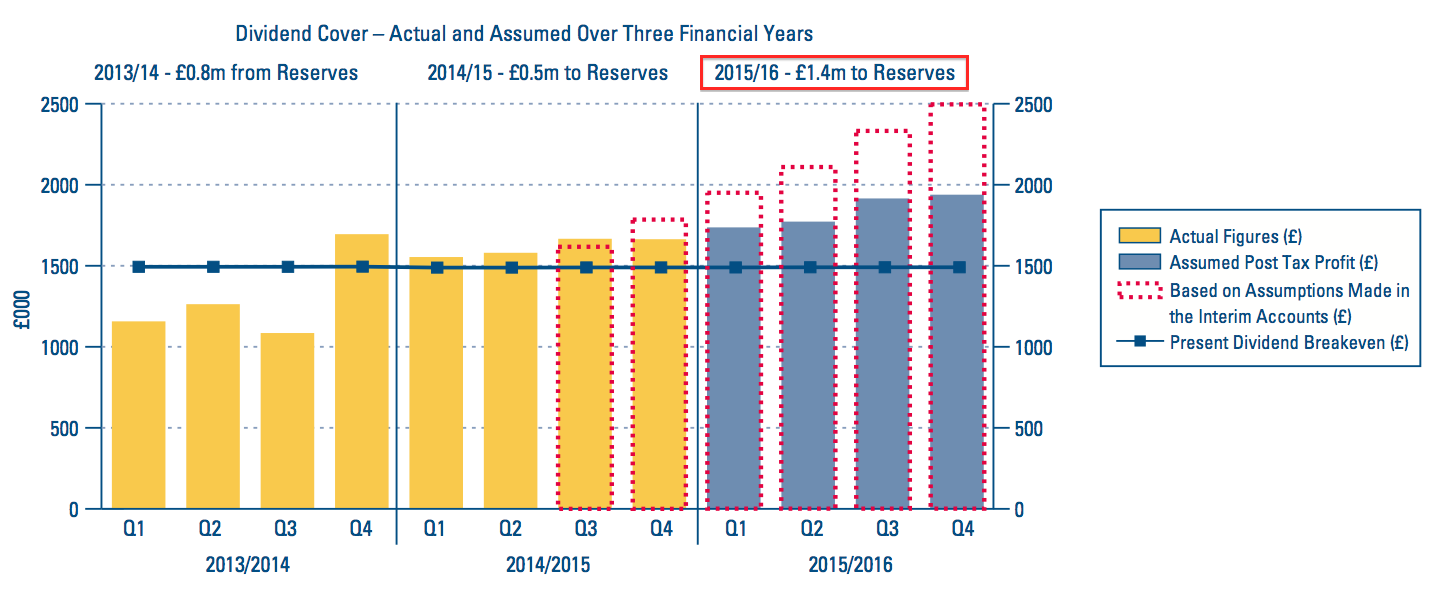
Roll on to July 2016, and the latest dividend-cover template confirms for 2015/16 that CLIG had to take £0.2m from reserves — that is, take £0.2m from its cash balance to sustain the 24p per share dividend: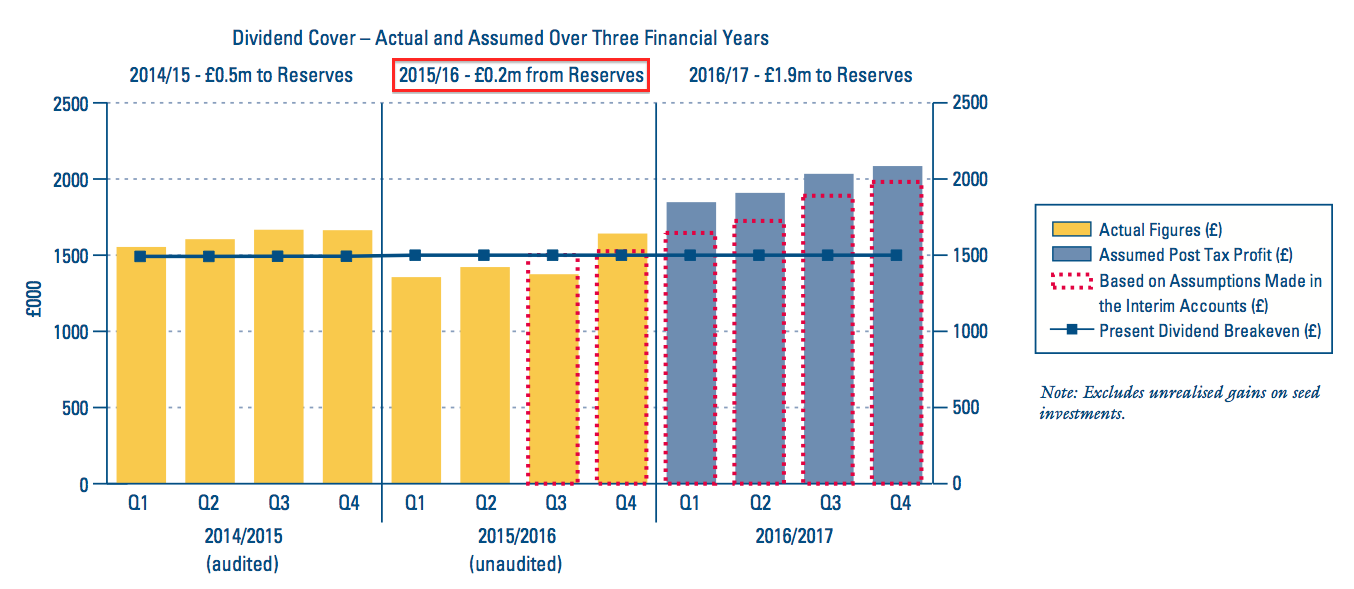
Given the sizeable difference between the original 2015/16 projection and the actual outcome — earnings of about 30p per share versus 23.6p per share — I’m not really too excited about CLIG’s upbeat dividend-cover forecast for 2016/17.
A quick check of the assumptions shows the group having cut its overhead growth from 10% to 5%, and trimmed its potential tax rate from 27% to 26%: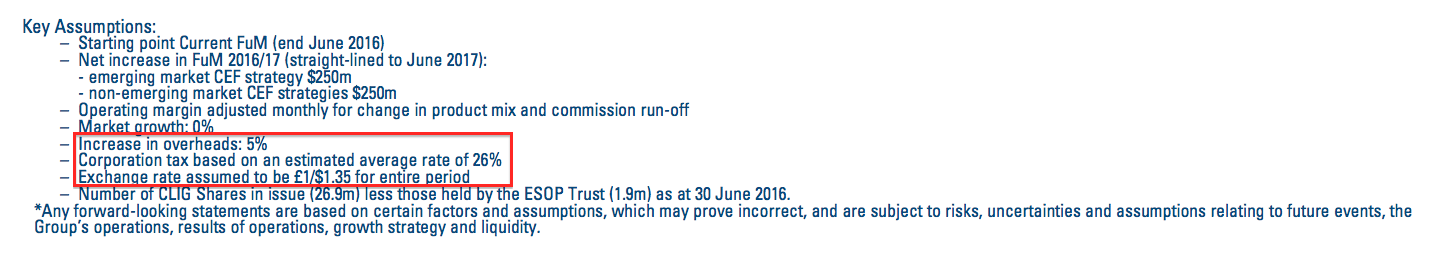
However, the real driver of current-year earnings could be the weaker pound.
CLIG has confirmed that it continues to earn almost all of its fees in US dollars, although 40% of costs are in sterling: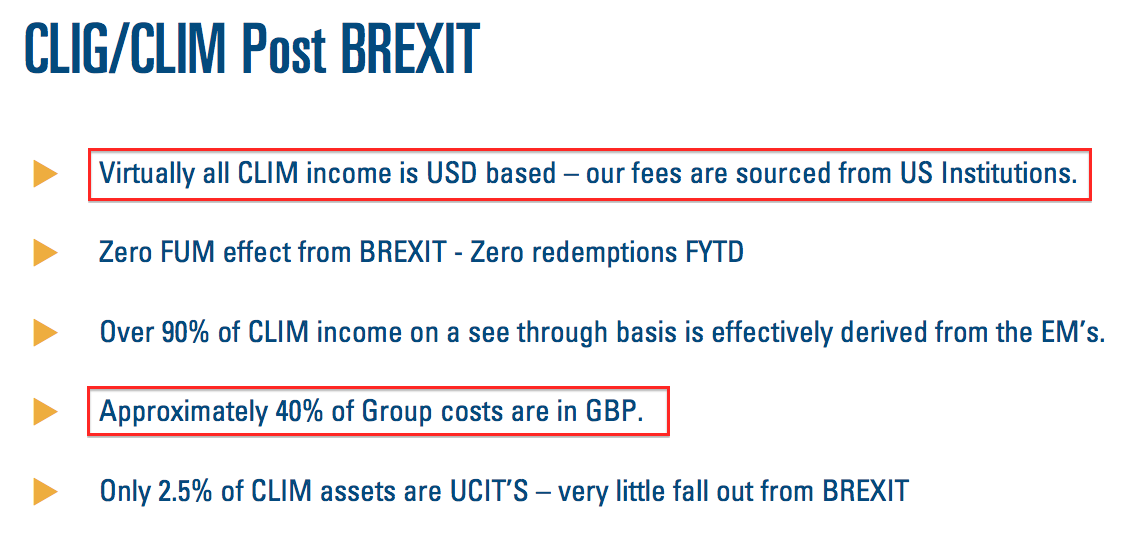
That currency set-up should benefit CLIG if the pound stays weak.
* FUM/exchange-rate table sneaks in extra costs
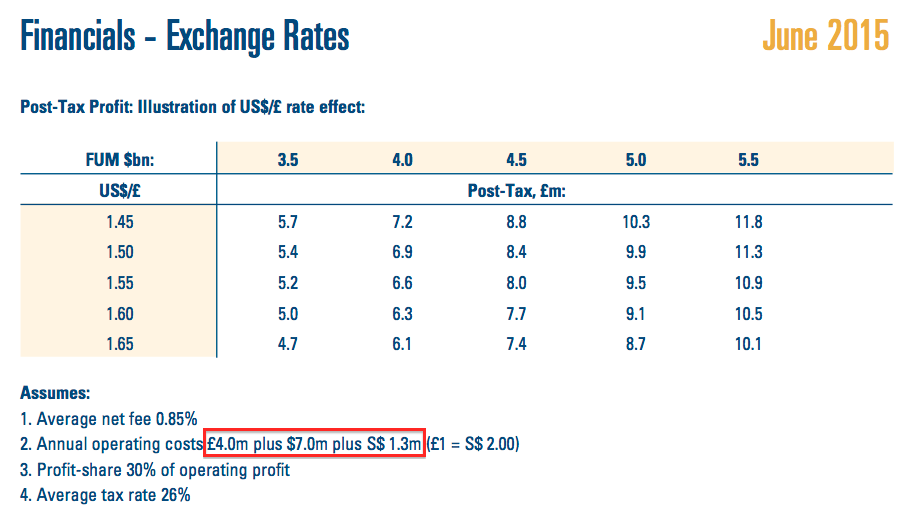
I was disappointed to see CLIG owning up to greater operating costs ahead.
Back in July 2015, the group’s helpful FUM/exchange-rate table had indicated operating costs of £4m plus $7m within the main UK and US offices:
Now the FUM/exchange-rate table shows operating costs of £5m plus $8m: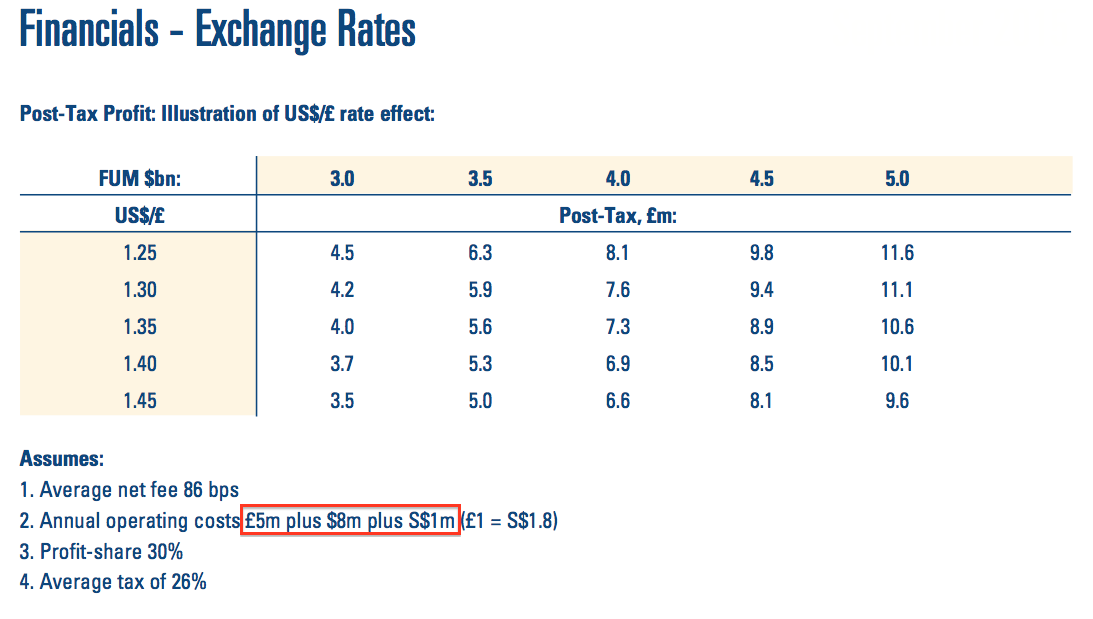
The rising cost base is unfortunate, not least because CLIG does like to say it keeps costs under control: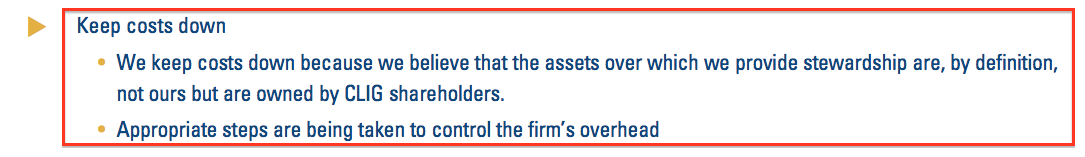
The rising cost base is also unhelpful when FUM this time last year was $4.2bn and now it is lower at $4.0bn.
I suspect the staff have enjoyed a pay rise — unlike us shareholders, who have had to make do with a static dividend for six years now as FUM remains marooned.
* Changes to ESOP still looming
CLIG’s rising cost base may be accompanied by changes to the group’s employee share ownership plan (ESOP).
The latest presentation once again suggested changes were on the cards, but no new details were offered.
The phrase “existing ESOP is considered uncompetitive” indicates to me that the new ESOP will be more expensive to shareholders: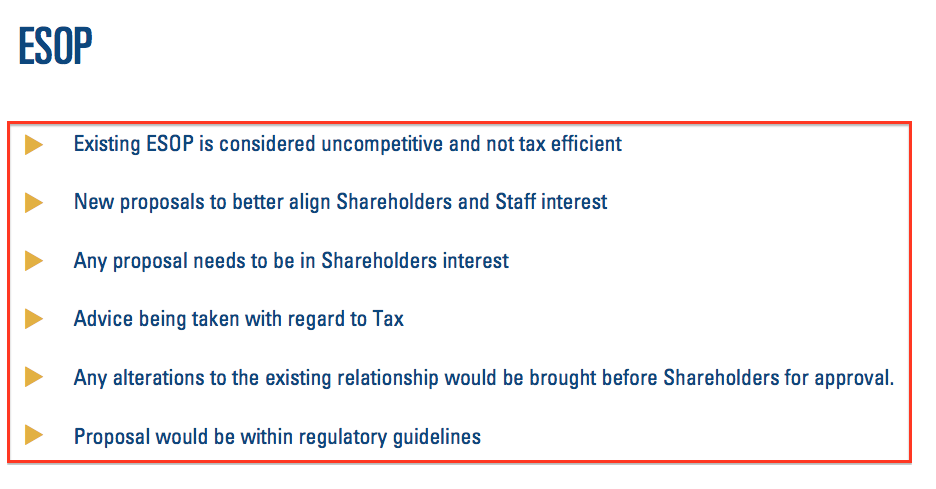
* At least CLIG’s own investment performance remains positive
One highlight within the presentation was confirmation that CLIG’s own investment performance had remained relatively positive.
The chart below shows a representative CLIG fund (denoted by the red circles) being consistently in the top half of the performance tables over various timescales: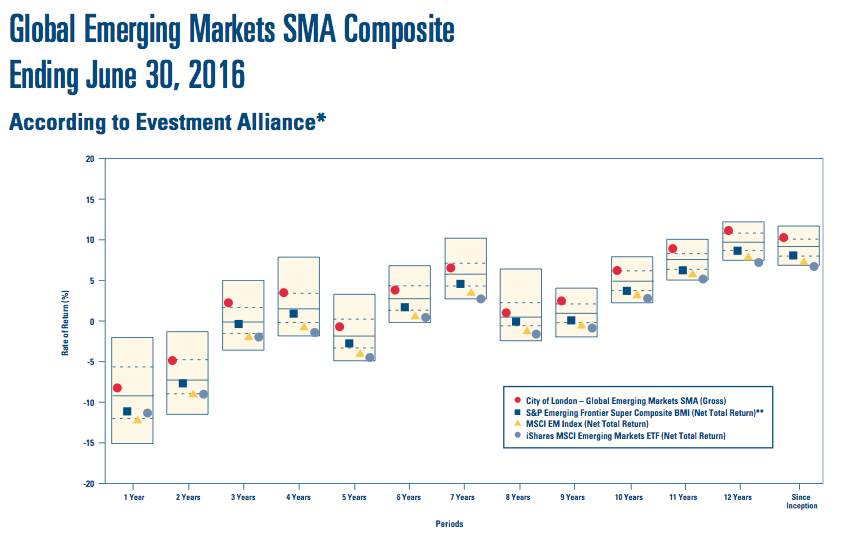
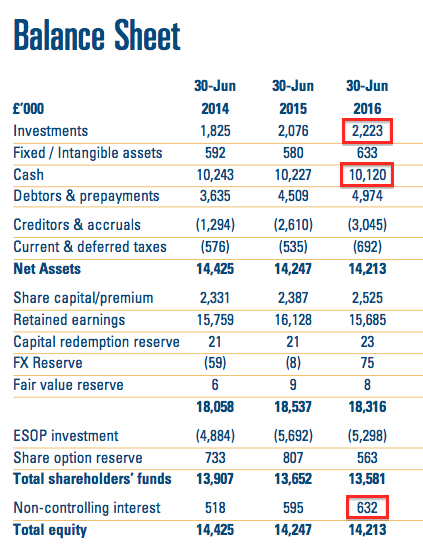
* Balance sheet and cash flow
A quick check of the summary accounts did not show anything untoward.
The balance sheet displayed cash of £10.1m and net investments of £1.6m (£2,223k less £632k minorities) versus £10.2m and £1.5m twelve months prior:
Meanwhile, the cash-flow statement confirmed the £6m dividend paid in the year matched the £6m earnings figure. Overall, there was a minor £107k total outflow of cash following other expenditure:
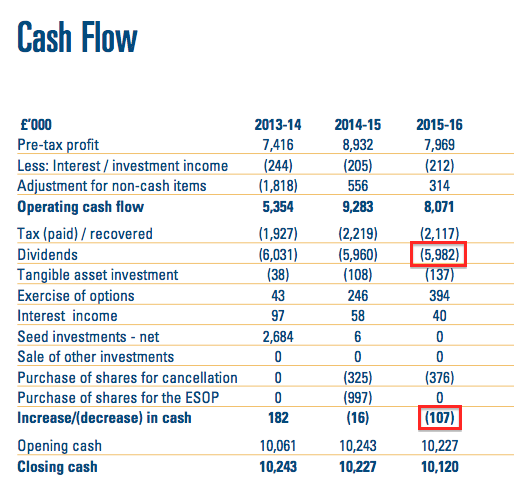
My early sums indicate operating margins were a healthy 31% during the year, with return on average equity coming in at a robust 44%. I will look at the accounts in more detail when the full annual report is issued in September.
Valuation
I’m using CLIG’s latest FUM/exchange-rate table (see above) for my valuation sums:
With £1 buying $1.31 and FUM at $4.0bn, I reckon current earnings could be running at £7.6m or 27.9p per share. If actually achieved for the full year, £7.6m would be the best earnings result since 2012.
Assuming net cash remains at around £10m or 39p per share, my enterprise value (EV) calculation for CLIG is £78m or 291p per share. Dividing that EV by my earnings guess gives me a possible P/E of 10-11.
That multiple does not look outlandish at present, although bear in mind these shares have rarely traded at an extended multiple in the past.
At least my 27.9p per share earnings guess underpins what is likely to be the seventh straight year of a 24p per share dividend — which currently equates to a 7%-plus yield on the 330p shares.
Maynard Paton
Disclosure: Maynard owns shares in City of London Investment.

Hi Maynard,
Great work as always, I’ve turned positive again on CLIG after reducing in August 2015. With a decent pickup in the MSCI Emerging Markets Index in July I expect the FUM to reach approx $4.2bn when next reported (early Aug). Whilst forward guidance is almost impossible in CLIG if it continues at that sort of level with the recent currency tailwinds we could have a decent year.
City of London Investment (CLIG)
FUM Update:
http://www.citlon.com/shareholders/announcements.php
CLIG has confirmed on its website that Funds Under Management at the end of July have advanced to about $4.15bn:
Using the latest FUM/FX earnings table shown in the Blog post above, current earnings could be running at £7.74m — equivalent to 29.5p per share — with £1 buying $1.33.
Maynard
City of London Investment (CLIG)
FUM Update:
http://www.citlon.com/shareholders/announcements.php
CLIG has confirmed on its website that Funds Under Management at the end of August have advanced to about $4.25bn:
Using the latest FUM/FX earnings table shown in the Blog post above, current earnings could be running at £8.16m — equivalent to 30.4p per share — with £1 buying $1.34.
Maynard