15 June 2016
By Maynard Paton
Quick update on Castings (CGS).
Event: Annual results for the twelve months to 31 March 2016 published 15 June 2016
Summary: A quite satisfactory set of results from the country’s largest foundry operator. Revenue, profit, the dividend and net cash all headed in the right direction, while a shareholder bonus was news of a 30p per share special payout. However, counter-balancing the 2016 figures was the admission of less work at the higher-margin machining division, which will hurt 2017 progress. Still, the shares do not appear expensive and I continue to hold.
Price: 460p
Shares in issue: 43,632,068
Market capitalisation: £200m
Click here for all my previous CGS posts
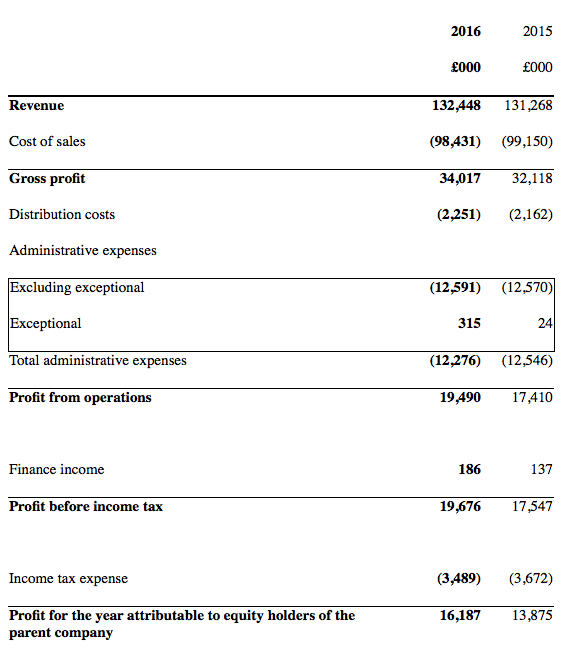
Results:
My thoughts:
* I felt these results were quite satisfactory
November’s decent first-half figures had already suggested these annual results would not be too bad.
In the event, revenue climbed 1% to £132m while operating profit advanced 10% to £19m.
The top line was hindered by lower raw-material prices, as customer contracts can contain adjustment clauses dictated by external commodity values. Operating profit, though, experienced a much better performance due to a favourable shift towards higher margin and “more complex, machined parts”.
I was pleased in particular that CGS’s foundry division once again managed to increase the revenue per tonne of castings produced:
| Year to 31 March | 2010 | 2011 | 2012 | 2013 | 2014 | 2015 | 2016 |
| Foundry revenue (£k) | 58,077 | 97,163 | 117,036 | 106,674 | 119,893 | 113,300 | 114,738 |
| Dispatched weight of castings (tonnes) | 31,800 | 50,600 | 57,200 | 52,700 | 57,600 | 52,700 | 52,000 |
| Revenue per tonne of castings (£) | 1,826 | 1,920 | 2,046 | 2,024 | 2,081 | 2,150 | 2,207 |
I was also glad to see the machining operation enjoy a super 26% margin before central costs:
| Year to 31 March | 2012 | 2013 | 2014 | 2015 | 2016 |
| Machining revenue (£k) | 9,235 | 15,541 | 17,563 | 17,968 | 17,710 |
| Machining operating profit (£k) | 4,017 | 3,803 | 5,187 | 4,521 | 4,699 |
| Machining operating margin (%) | 43.5 | 24.5 | 29.5 | 25.2 | 26.5 |
The operating margin for the wider group was a worthwhile 14.5%.
While these 2016 results appeared respectable, the table below shows how they could not match up to 2012 and 2014, when vehicle legislation changes prompted bumper demand for certain products.
| Year to 31 March | 2012 | 2013 | 2014 | 2015 | 2016 |
| Revenue (£k) | 126,271 | 122,215 | 137,466 | 131,268 | 132,448 |
| Operating profit (£k) | 22,244 | 18,702 | 21,286 | 17,386 | 19,175 |
| Other items (£k) | 693 | 149 | 363 | 24 | 315 |
| Finance income (£k) | 156 | 306 | 184 | 137 | 186 |
| Pre-tax profit (£k) | 23,093 | 19,157 | 21,833 | 17,547 | 19,676 |
| Earnings per share (p) | 40.3 | 33.9 | 39.6 | 31.8 | 37.1 |
| Dividend per share (p) | 11.8 | 12.3 | 13.0 | 13.3 | 13.7 |
| Special dividend per share (p) | - | - | - | - | 30.0 |
The group’s half-year split did not appear worrying:
| H1 2015 | H2 2015 | FY 2015 | H1 2016 | H2 2016 | FY 2016 | ||
| Revenue (£k) | 63,596 | 67,672 | 131,268 | 64,962 | 67,486 | 132,448 | |
| Operating profit (£k) | 8,262 | 9,124 | 17,386 | 9,468 | 9,707 | 19,175 |
* Loss of contract prompts mild profit warning
Today’s statement unfortunately contained a mild profit warning for the current financial year.
CGS admitted a “major contract” had ended during the final quarter at its machining division, and that the replacement work would not “come on stream immediately”.
The half-year split for the machining division does show its profit dropping during the second half:
| H1 2015 | H2 2015 | FY 2015 | H1 2016 | H2 2016 | FY 2016 | ||
| Machining revenue (£k) | 7,978 | 9,990 | 17,968 | 9,860 | 7,850 | 17,710 | |
| Machining operating profit (£k) | 1,844 | 2,677 | 4,521 | 2,553 | 2,146 | 4,699 |
Encouragingly, the group described the forthcoming profit reduction as “temporary” and predicted that the machining division would enjoy a recovery during 2017/18.
* Cash flow, balance sheet and return on equity
I could not fault CGS’s accounts. In particular, cash conversion appeared healthy:
| Year to 31 March | 2012 | 2013 | 2014 | 2015 | 2016 |
| Operating profit (£k) | 22,244 | 18,702 | 21,286 | 17,386 | 19,175 |
| Depreciation (£k) | 6,188 | 7,416 | 6,046 | 6,760 | 6,853 |
| Net capital expenditure (£k) | (12,591) | (6,846) | (9,659) | (8,138) | (7,167) |
| Working-capital movement (£k) | (3,393) | (3,644) | (16) | (4,095) | 1,216 |
| Net cash (£k) | 17,805 | 23,654 | 27,780 | 30,021 | 40,385 |
Capital expenditure was only £0.3m greater than the depreciation charged against earnings, despite £2m being spent on land and buildings.
Meanwhile, I was happy to see a favourable inflow of working-capital cash.
After paying dividends of almost £6m, CGS’s net cash position advanced by £10m to £40m — equivalent to 93p per share or 2.5 times annual earnings.
Excluding the mighty cash pile from the denominator, my return on average equity calculations show a very acceptable performance during the last year:
| Year to 31 March | 2012 | 2013 | 2014 | 2015 | 2016 |
| Return on average equity (%) | 24.9 | 19.3 | 21.4 | 16.1 | 18.1 |
* A 30p per share special dividend
While I do prefer my companies to carry surplus cash, CGS’s bank balance had looked especially weighty for some time. I therefore welcomed today’s news of a 30p per share/£13m special dividend.
Apparently the board had “reviewed the cash position… and considered the balance between increasing returns to shareholders whilst retaining flexibility for capital and other investment opportunities”.
The firm added that the special payout “in no way compromises our commitment to invest in market-leading technologies to maintain our competitive advantage”.
Valuation
Today’s reported £19.2m operating profit after 20% standard tax gives earnings of £14.3m or 35.2p per share.
Subtracting the aforementioned 93p per share net cash position from the 460p share price, my estimate of CGS’s enterprise value (EV) is 367p per share or £160m.
Dividing that 367p by my 35.2p per share EPS calculation gives a multiple of between 10 and 11 at the present 460p share price. That rating does not look wildly expensive to me, although earnings are set to drop this year due to the loss of that major machining contract.
Meanwhile, the ordinary annual dividend was upped 3% to 13.71p per share and supports a 3.0% income.
Maynard Paton
Disclosure: Maynard owns shares in Castings.

Castings (CGS)
Pension scheme surplus
Something I noticed in today’s results were these cash flow movements relating to the group’s pension scheme:
To recap, CGS is unusual in that its final-salary pension fund runs at a surplus (almost £15m) and that the surplus is so great, the trustees have agreed to hand back some of the scheme money to CGS.
The small-print within the prior interim results said £6.8m would be handed back:
So I am not sure why today’s annual results showed CGS paying £2.6m into the scheme when it was repaid £1.1m during the year. The fact that the movement is described as “Advances to the pension schemes” suggest it is some sort of temporary loan.
Indeed, the small-print within the prior interim results also said “Payments made by the company on behalf of the schemes in the current period are repayable on 30 November 2016“. So it seems that £2.6m paid into the scheme in the year just passed will be returned in the current financial year.
I hope the forthcoming 2016 annual report will clarify this matter.
Anyway, I continue to exclude what is owed to CGS by the pension scheme in my valuation sums. Only when the money has been transferred into CGS’s bank do I include it.
Maynard
Castings (CGS)
Publication of 2016 annual report
http://www.castings.plc.uk/files/44
Here are some points of interest:
1) Board meetings
Not often I mention board meetings, but CGS is unusual in this regard. For the last ten years now, at least one board member has been absent from at least one main board meeting.
During 2016, an executive and a non-exec skipped a meeting:
A non-exec skipped an audit meeting, too.
In light of CGS’s established and proven track record, I can live with the absenteeism. But this can be a useful check for companies with a more haphazard history.
At least the audit committee met four times last year versus one meeting for the remuneration committee. I do like my boardrooms to talk more about audit and risks rather than pay.
2) Director pay
Nothing much to worry about here:
Modest salary rises all round to levels that do not seem grandiose given the business reported a £19m operating profit.
However, bonuses continue to be calculated on a percentage of operating profit above £10m, and so the executives ought to receive extra cash in all but really bad years.
AT least there is no option scheme and pension contributions are a reasonable (at least for quoted PLC executives) 7% of salary.
3) Major customers
CGS remains dependent on three main customers:
The revenue proportions are 24.9%, 12.7% and 9.1%, which add up to 46.7%.
For comparison, the top-three customer revenue dependence for 2012, 2013, 2014 and 2015 was 46.5%, 47.7%, 47.7% and 45.1% respectively. So there is some history of successfully managing major clients.
4) Staff ratios
There was nothing too alarming about CGS’s employee numbers:
Revenue per employee was maintained at a respectable £116k while the average employee cost increased 3.5% to almost £38k.
5) Pension scheme
Within the Comment above, I noted some cash-flow movements that concerned the group’s pension scheme.
I thought it odd that CGS, which had been owed £6m from the scheme, received £1,135k as a payment during the year… yet also paid a £2,610k “advance” back to the scheme.
The annual report did not disclose why the advance was necessary, but it seems to me the advance will be returned.
The following extract shows what is owed to CGS by the pension scheme increasing from £5,673k to £7,148k — the difference of £1,475k being identical to the difference between the aforementioned £1,135k payment received and £2,610k advance seen in the cash-flow statement:
A quick check of the pension scheme shows assets of £65m (excluding the £7m now owed to CGS) needing to produce an annual return of £2.4m of pension benefits every year:
£2.4m of £65m = 3.7%, which I guess could just about be earned on average every year without the need for extra injections into the scheme.
This next extract confirms £3.8m of the pension fund’s assets will be repaid to CGS during the current financial year, with the £3.4m balance to be received during subsequent years:
6) Trade receivables
That same ‘trade and other receivables’ extract above shows trade receivables declining by almost £3m to £23.4m during 2016. That is not a bad achievement when revenue advanced slightly and the business is dependent on three major customers.
What is impressive, too, is that CGS does not suffer from its major customers playing hardball with late payments. This extract shows minimal levels of trade receivables being past their due date:
7) Foreign-exchange sensitivity
I was disappointed by CGS’s disclosure on foreign-exchange risk. The company confirmed it does not hedge in any significant way (which is fair enough), but there was limited information on the effect on profit should Sterling weaken or strengthen against other currencies:
I think (but am not sure) the narrative highlighted above relates only to the extra interest CGS may earn from its non-GBP cash were exchange rates move +/- 5%.
For what it is worth, two-thirds of revenue during 2016 came from overseas — which may be important given recent GBP fluctuations.
Maynard