14 June 2017
By Maynard Paton
Quick update on Castings (CGS).
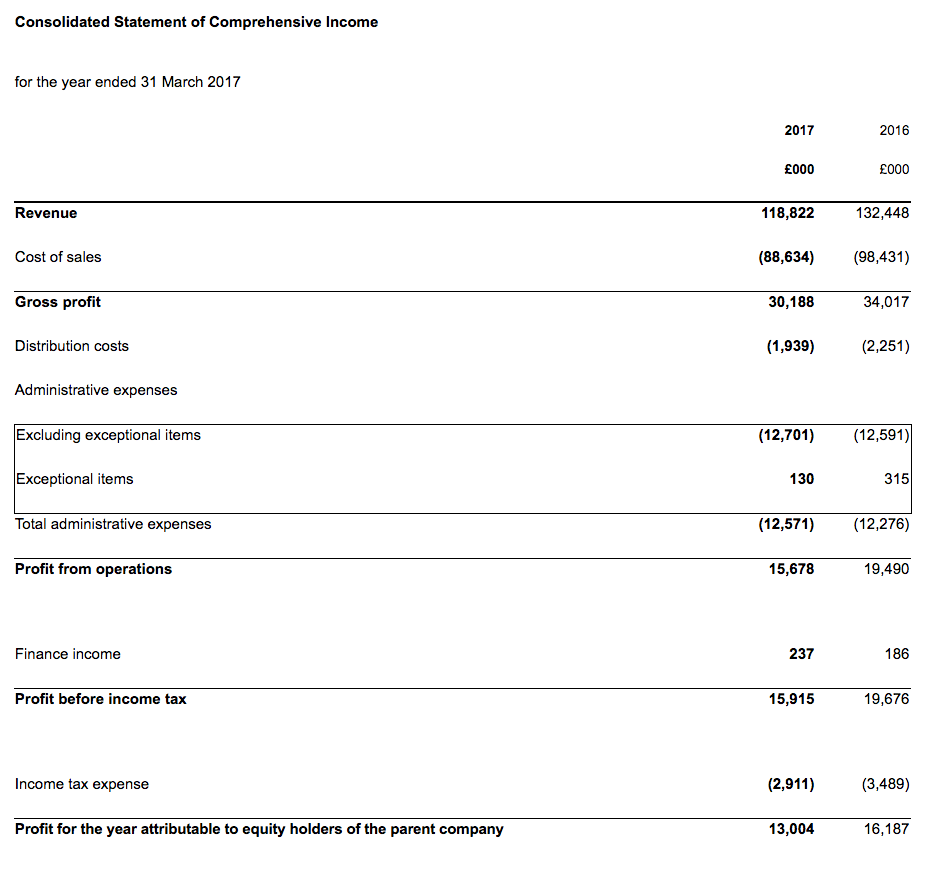
Event: Annual results for the twelve months to 31 March 2017 published 14 June 2017
Summary: A lack of work at CGS’s smaller machining division meant these annual figures were the engineer’s worst since 2011. Thankfully there were no worrying omens for 2018 — the group’s order book apparently remains “steady” while the second-half performance even showed some promise. The hefty cash pile and a resilient dividend continue to be shareholder centrepieces, and talk of “robotic handling” suggests margin improvements may be on the way. My P/E of 13 does not indicate a bargain and I continue to hold.
Price: 450p
Shares in issue: 43,632,068
Market capitalisation: £196m
Click here for all my previous CGS posts
Results:
My thoughts:
* These results were not as bad as they could have been
A profit warning this time last year had already signalled these 2017 figures would not be spectacular.
The final numbers showed revenue down 10% and operating profit down 19%. The shortfall was due mostly to the completion of a major contract — without any replacement work lined up — within the group’s smaller machining division.
The table below contrasts the 2017 performance with the achievements of prior years:
| Year to 31 March | 2013 | 2014 | 2015 | 2016 | 2017 |
| Revenue (£k) | 122,215 | 137,466 | 131,268 | 132,448 | 118,822 |
| Operating profit (£k) | 18,702 | 21,286 | 17,386 | 19,175 | 15,548 |
| Other items (£k) | 149 | 363 | 24 | 315 | 130 |
| Finance income (£k) | 306 | 184 | 137 | 186 | 237 |
| Pre-tax profit (£k) | 19,157 | 21,833 | 17,547 | 19,676 | 15,915 |
| Earnings per share (p) | 33.9 | 39.6 | 31.8 | 37.1 | 29.8 |
| Dividend per share (p) | 12.3 | 13.0 | 13.3 | 13.7 | 14.0 |
| Special dividend per share (p) | - | - | - | 30.0 | - |
Although today’s statement confirmed the worst annual result since 2011, the second-half performance did appear a tad better than November’s first-half statement.
In particular, the group’s half-year split showed the main foundry division scoring a higher H2 profit (£8,294k) than that reported for 2016 (£7,767k):
| H1 2016 | H2 2016 | FY 2016 | H1 2017 | H2 2017 | FY 2017 | ||
| Group | |||||||
| Revenue (£k) | 64,962 | 67,486 | 132,448 | 57,863 | 60,959 | 118,822 | |
| Operating profit (£k) | 9,468 | 9,707 | 19,175 | 7,010 | 8,538 | 15,548 | |
| Foundry | |||||||
| Revenue (£k) | 55,102 | 59,636 | 114,738 | 54,187 | 57,651 | 111,838 | |
| Operating profit (£k) | 6,915 | 7,767 | 14,682 | 6,212 | 8,294 | 14,406 | |
| Machining | |||||||
| Revenue (£k) | 9,860 | 7,850 | 4,696 | 3,676 | 3,308 | 6,984 | |
| Operating profit (£k) | 2,553 | 2,146 | 4,699 | 798 | 721 | 1,519 |
Another highlight within the foundry division was yet another improvement to the revenue earned per tonne of castings produced:
| Year to 31 March | 2011 | 2012 | 2013 | 2014 | 2015 | 2016 | 2017 |
| Foundry revenue (£k) | 97,163 | 117,036 | 106,674 | 119,893 | 113,300 | 114,738 | 111,838 |
| Dispatched weight of castings (tonnes) | 50,600 | 57,200 | 52,700 | 57,600 | 52,700 | 52,000 | 47,200 |
| Revenue per tonne of castings (£) | 1,920 | 2,046 | 2,024 | 2,081 | 2,150 | 2,207 | 2,369 |
The ongoing shift towards “more complex, machined parts”, alongside various productivity investments, appeared to shore up the performance.
The management narrative also referred to “investment in robotic handling” and “the role of automation”, which suggests extra employees may not be needed to handle additional future revenue.
Between 2006 and 2016, the percentage of revenue paid to staff has reduced from 37% to 32% and I’d like to think that “robotic handling” can help that proportion decline further.
If future productivity improvements can be made, then I trust CGS’s group margin may be able to increase as well. The 13.1% margin reported for 2017 was the lowest since 2009:
| Year to 31 March | 2013 | 2014 | 2015 | 2016 | 2017 |
| Operating margin (%) | 15.3 | 15.5 | 13.2 | 14.5 | 13.1 |
* Cash flow, balance sheet and return on equity
I am not too worried about CGS’s accounts.
Cash conversion appeared reasonable, with the somewhat large £14m capital-expenditure sum including £5m spent on building an extension to create extra warehousing and manufacturing space:
| Year to 31 March | 2013 | 2014 | 2015 | 2016 | 2017 |
| Operating profit (£k) | 18,702 | 21,286 | 17,386 | 19,175 | 15,548 |
| Depreciation (£k) | 7,416 | 6,046 | 6,760 | 6,853 | 7,276 |
| Net capital expenditure (£k) | (6,846) | (9,659) | (8,138) | (7,167) | (14,191) |
| Working-capital movement (£k) | (3,644) | (16) | (4,095) | 1,216 | (1,634) |
| Net cash (£k) | 23,654 | 27,780 | 30,021 | 40,385 | 27,228 |
(I suppose spending £5m on a new factory extension shows at least CGS’s directors are confident of better times returning!)
The year-end cash pile was left £13m lighter at £27m (62p per share) following the payment of the £13m/30p per share special dividend announced twelve months ago. CGS continues to carry no debt.
Meanwhile, CGS’s defined-benefit pension scheme remains in surplus — up £2.1m to £16.8m — and, perhaps uniquely for a quoted company, continues to dribble surplus cash back to the group!
Not surprisingly, the lower earnings have translated into a reduced return on average equity calculation:
| Year to 31 March | 2013 | 2014 | 2015 | 2016 | 2017 |
| Return on average equity* (%) | 19.3 | 21.4 | 16.1 | 18.1 | 13.9 |
(*adjusted for net cash)
I am hopeful this ratio can one day return to the more appealing levels of the past.
Valuation
With today’s statement claiming that “customer requirements [are] forecast to remain steady at the current levels”, I think it is fair to assume earnings for 2018 may be quite similar to those of 2017.
Taking the reported 2017 operating profit of £15.5m and deducting 19% standard UK tax, I arrive at earnings of £12.6m or 28.9p per share.
Then subtracting the aforementioned 62p per share net cash position from the 450p share price, my estimate of CGS’s enterprise value comes to 388p per share or £169m.
Dividing that 388p per share by my 28.9p per share EPS guess gives a multiple of about 13. Given the immediate “steady” outlook, the present rating does not strike me as an obvious bargain.
Meanwhile, the ordinary annual dividend was upped a very modest 2% to 13.97p per share and currently supports a 3.2% income.
The annual payout has now been lifted on 24 occasions during the last 26 years, during which time it has never suffered a cut.
Maynard Paton
Disclosure: Maynard owns shares in Castings.

Castings (CGS)
Publication of 2017 annual report
Here are the points of interest:
1) Extra risk disclosure
I always like to study the ‘risks’ section in any annual report, as companies may wish to sneak in extra dangers if unexpected trouble is on the horizon.
There was nothing untoward with the additions within CGS’s report.
Just an extra line about customer relations and an extra line about currency movements:
2) Director pay
I have no issues with boardroom pay.
I like the fact the board has considered LTIPs, but decided against them (the group continues to operate without an option scheme):
The directors enjoyed very modest pay gains last year:
The executive bonus calculation remains quite simple (although the calculation means the execs can receive a bonus when profit falls — i.e. 2017):
3) Major customers
CGS remains dependent on three large clients:
Some 51% of revenue came from this trio of customers last year — the highest proportion since the relevant figures were first disclosed in 2009.
The proportion between 2012 and 2016 has been between 45% and 48%, so 51% is not completely unknown territory… but the risk remains of CGS suffering a major setback should one of the three cut back their spending.
4) Employees
CGS’s staff ratios did not reveal anything spectacular:
CGS employed 27 fewer people last year and the average cost of each staff member dropped by about £1.3k to £36.4k. However, revenue per staff fell by about £10k to £107k — the lowest since 2010. Furthermore, total staff pay represented 34% of revenue — the highest proportion since 2008.
I wonder if management’s talk of “robotic handling” will eventually help improve these employee ratios.
5) Pension scheme
Quite a bit going on here.
First, it appears CGS’s pension scheme has commendably invested in basic index trackers:
Next, I see the benefits paid by the scheme to the scheme’s members dropped from £2.4k to £1.8k during 2017:
No explanation was given that I could find, and I do hope the payments do not revert back to £2.4k.
A quick comparison of the £1.8k benefit versus the £78.3m scheme assets suggests the assets need only to generate a 2.3% income every year to pay the scheme’s members. That return does not look outlandish to me.
I note CGS expects the pension payments to members to remain at less than £2k:
But last year CGS expected the pension payments to remain at more than £2k:
So I am not sure whether to trust the revised 2017 projection or not.
Anyway, what is also interesting is that the “weighted average duration of the defined benefit obligation of the schemes is 17 years.”
If I am reading that right — and the average member is set to collect his pension for the next 17 years before death — then CGS’s scheme does appear to be very mature.
6) Trade receivables
It’s always worth checking whether those three major customers have started to delay payments — that would indicate trouble for CGS:
There is nothing too untoward here.
Trade receivables of £24.7m represent 21% of revenue, which compares to between 17.4% and 20.4% during the previous five years. So there has been a small negative movement, but nothing too significant. Indeed, the proportion was 21% or more during 2010 and 2011, and 2005, 2006 and 2007.
The trade receivables note also mentions a short-term and long-term “receivable from pension schemes“, which total £5.4k. That sum is essentially a proposed refund from the pension scheme back to the group. I do not include this sum in my valuation calculations.
Maynard
Castings (CGS)
Board change and trading update
A slightly odd statement this, as the headline referred to ‘trading update’… yet there was no word on trading.
But there was a board change and, reading between the lines, trading at CGS’s machining division may have deteriorated of late.
Here is the text:
—————————————————————————————————————————-
Castings PLC announces today that Mark Lewis, Managing Director of CNC Speedwell Limited (“CNC”), will step down from the board. He will leave the business on 20 October 2017.
Adam Vicary, Chief Executive, will assume operational responsibility for CNC until a permanent replacement has been appointed. During this time, a full review of the machining division will be undertaken and reported on as part of the interim results on 10 November 2017.
—————————————————————————————————————————-
This sounds a little ominous.
CNC Speedwell is CGS’s machining division, which as the Blog post above notes, suffered a significant profit shortfall during 2017 (divisional profit down from £5.7m to £1.5m). A major contract finished without replacement work being on hand.
The new chef exec is taking matters into his own hands… and the risk is that his ‘full review’ unearths some unpleasant news. I suspect CNC’s trading has been very poor and there could be some restructuring costs emerging. I am bracing myself ahead of 10 November.
Maynard