07 December 2018
By Maynard Paton
Update on Mountview Estates (MTVW).
Event: Interim results for the six months to 30 September 2018 published 22 November 2018.
Summary: The property-trading specialist revealed its weakest first-half performance since 2013 after selling eleven fewer houses than this time last year. Furthermore, the 133% investment return achieved from those disposals was below MTVW’s ten-year average. Nonetheless, net asset value (NAV) still managed to creep to a fresh £92 per share high. Meanwhile, dissident shareholders continue to vote against MTVW’s directors and may be growing in number. The £100 shares do not appear expensive on an NAV and yield basis, and I have recently bought more.
Price: £100
Shares in issue: 3,899,014
Market capitalisation: £390m
Click here to read all my MTVW posts.
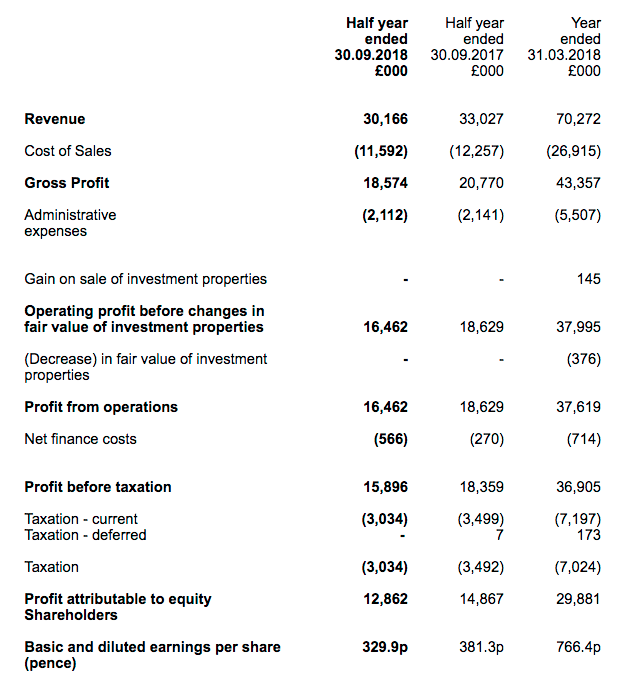
Results:
My thoughts:
* 73 properties sold for an average £283k each
These first-half results were MTVW’s weakest for five years and, once again, the residential property firm blamed Brexit and longer completion times for a subdued performance:
“The uncertainty surrounding Brexit of which I wrote last year will continue until 29 March 2019 at the earliest. Whilst the Company conducts its business entirely within the borders of the United Kingdom, it cannot escape the overall effect of these uncertainties.
During the six months ended 30 September 2018 fewer of our properties have come vacant and sales take longer to complete during uncertain times.”
In the event, total revenue fell 9% while operating profit slid 12%. At least the average proceeds raised from each property sale came in at just £2k lower than the comparable period:
| H1 2017 | H2 2017 | H1 2018 | H2 2018 | H1 2019 | |||
| Property sales revenue (£k) | 25,133 | 35,021 | 23,953 | 27,887 | 20,656 | ||
| Properties sold | 74 | 108 | 84 | 86 | 73 | ||
| Average selling price (£k) | 340 | 324 | 285 | 324 | 283 |
I am hopeful the £283k average selling price means MTVW is not too exposed to any elevated property valuations. During the last 18 months, the firm has sold 243 properties of which only 4 have achieved prices of more than £1m.
The gross margin from MTVW’s H1 property sales matched the gross margin achieved during the second half of last year:
| H1 2017 | H2 2017 | H1 2018 | H2 2018 | H1 2019 | |||
| Property sales revenue (£k) | 25,133 | 35,021 | 23,953 | 27,887 | 20,656 | ||
| Property sales gross profit (£k) | 17,843 | 22,024 | 14,297 | 15,721 | 11,706 | ||
| Property sales gross margin (%) | 71.0 | 62.9 | 59.7 | 56.4 | 56.7 |
Clearly MTVW is no longer making as much profit from its property sales — or is selling as many properties — as it once was.
For some perspective, this H1’s 57% gross margin is equivalent to MTVW selling a property for a 133% gain. During the last ten years, the group has reported gains ranging from 76% to 201% — and has enjoyed a 156% average.

As a reminder, MTVW’s style of property trading can lead to haphazard earnings.
The firm’s portfolio is dominated by 2,000 or so regulated-tenancy (or similar) properties, and the number of these homes becoming available for sale — and the proceeds they generate — can be unpredictable.
You see, the properties are sold only when the regulated tenancy ends — which most often occurs when the tenant dies.
Furthermore, the gain on each property sold — typically correlated to how long the property has been owned by MTVW — can vary somewhat.
As such, if the properties sold were bought relatively recently, then the resultant gross margin would be much lower than if the properties had been owned for decades.
* NAV inches to a fresh £92 per share high
Although MTVW’s H1 progress was not spectacular, the performance did add a further £5m to the balance sheet to propel net asset value (NAV) to a fresh £360m/£92 per share peak.
Some £9m was spent acquiring 27 additional properties during the six months (average cost: £342k), which MTVW described as “good purchases”. A £10m debt repayment plus an £8m dividend left net debt £3m lighter at £42m.
Net debt currently represents 11% of the group’s £378m property stock. In the past, this ratio has often topped 30% and suggests MTVW could have the capacity to borrow another £70m.
* Unhappy shareholders may be growing in number
MTVW commenced this first-half statement with a paragraph about the non-election of two non-executive directors:
“At the Annual General Meeting held on 8 August 2018 those shareholders deemed to be independent exercised their right to reject the re-appointment of Mr Anthony Solway and the election of Mr Anthony Powell as independent non-executive directors. At the General Meeting held in accordance with the UKLA Listing Rules on 19 November 2018, when all shareholders were entitled to vote, it was resolved to re-appoint Mr Anthony Solway and elect Mr Anthony Powell as directors of the Company. Thus the status quo is maintained.”
A similar story occurred last year when a different non-exec was not re-elected at the annual meeting. Just like this year, a general meeting was then convened, and that non-exec was eventually appointed as well after the major Sinclair family shareholders had their vote.
The table below outlines the voting pattern:
| 2017 | 2018 | |
| AGM | ||
| Votes FOR | 126,243 (13%) | 220,059 (19%) |
| Votes AGAINST | 827,277 (87%) | 927,347 (81%) |
| Subsequent GM | ||
| Votes FOR | 2,360,526 (74%) | 1,504,226 (62%) |
| Votes AGAINST | 826,230 (26%) | 941,463 (38%) |
I see the 2018 dissident vote increased by approximately 100,000 shares on 2017. Those extra votes equate to a £10m shareholding, so a few not-insignificant investors appear to have joined the protest of late.
I cannot be 100% sure what is happening behind the scenes here, but I attended the 2014 AGM and it was very clear certain members of the wider Sinclair family do not get along with each other.
In particular, Graham Murphy — whose wife Margaret Murphy is the sister of MTVW’s chief exec Duncan Sinclair — was quite vocal with his criticism of how MTVW was managed.
I understand Mr Murphy has continued to lambast the board at subsequent AGMs. I get the strong impression the Murphy family want to exit their investment — either through a trade sale or by forcing MTVW to sell its entire property estate and then return the proceeds to shareholders.
At the very least, I guess the Murphy family — with a disclosable 18% shareholding — wish to have a non-executive position on the board for themselves.
Owning 4% of the shares, the Talisman Dynamic Master Fund — controlled by the William Pears group — is the only other notifiable holder with a potential dissident motive. Every other disclosable shareholder is part of the Sinclair family’s 52% concert party.
For what it is worth, MTVW claims it will once again “seek to continue to engage with independent shareholders to take into account their concerns and considerations in the future.”
Valuation
After fine-tuning my sums, I continue to believe MTVW could be worth more than £200 per share — assuming all of the group’s regulated tenancies were to end immediately and the properties could then all be sold at a fair market value.
If you recall, MTVW employed property agents Allsop to undertake a formal valuation of the firm’s estate during September 2014.
Back then, the book value of MTVW’s properties was £318m and Allsop’s valuation — with the regulated tenancies still in place — was deemed to be £666m.
As such, the ‘Allsop-to-book’ multiple was £666m / £318m = 2.10x.
Furthermore, MTVW’s results now disclose properties included in the September 2014 valuation but have since been sold:
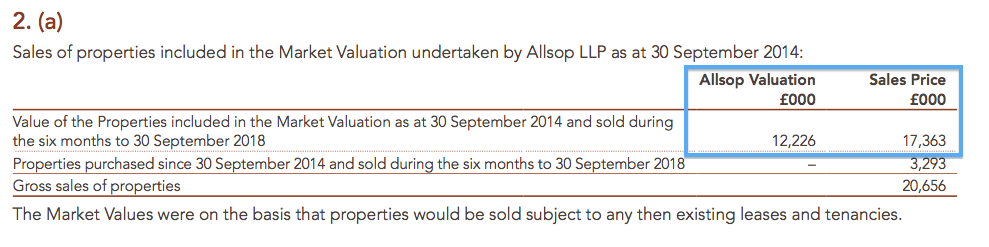
The latest ‘sold-to-Allsop’ multiple is therefore £17,363k / £12,226k = 1.42x:
| H1 2017 | H2 2017 | H1 2018 | H2 2018 | H1 2019 | |||
| Property sales revenue (£k) | 23,870 | 33,304 | 22,496 | 22,660 | 17,363 | ||
| Allsop valuation (£k) | 16,700 | 21,805 | 14,767 | 15,827 | 12,226 | ||
| Multiple (%) | 1.43 | 1.53 | 1.52 | 1.43 | 1.42 |
The following table outlines my valuation sums:
| Property stock Sept 2014 (£k) | 317,651 |
| Less property stock sold since Sept 2014 (£k) | (81,147) |
| 236,504 | |
| Allsop-to-book multiple | 2.10 |
| Sold-to-Allsop multiple | 1.42 |
| 703,985 | |
| Property stock purchased since Sept 2014 | 141,670 |
| Sold-to-Allsop multiple | 1.42 |
| 201,196 | |
| Possible property stock value (£k) | 905,181 |
I have taken the original September 2014 portfolio value of £318m and subtracted the book value of properties sold since that date. I have then multiplied the £237m remainder by my Allsop-to-book multiple and then by my sold-to-Allsop multiple.
I arrive at a £704m estimated current value for all of MTVW’s properties that were owned at September 2014 but have yet to be sold.
Since September 2014, MTVW has spent £142m buying additional properties. I have assumed all of these can be sold one day for £201m based on my sold-to-Allsop multiple.
Adding the £704m and the £201m together gives me £905m.
This next table adjusts that £905m for 19% taxation, other investments, net debt and other liabilities to give me a possible book value of £786m or £202 per share:
| Possible property stock value (£k) | 905,181 |
| Less tax at 19% (£k) | (100,131) |
| Plus other investments (£k) | 27,825 |
| Less net debt (£k) | (41,500) |
| Less other liabilities (£k) | (4,972) |
| Possible NAV (£k) | 786,403 |
| Possible NAV per share (£) | 201.69 |
These sums are not perfect, but I would like to think they are quite reasonable. Of course, the major question remains how long MTVW will take to sell all of its properties to realise my potential £202 per share NAV guess.
I trust the longer it takes, the higher house prices will rise and the greater proceeds MTVW will achieve from its future sales. In other words, that aforementioned 1.43x sold-to-Allsop multiplier should increase over time.
The following SharePad charts display MTVW’s more immediate valuation.
The chart below shows the share price (the black line) at £100 and the price to NAV (the green line) at 1.08x.
History shows buying at around NAV or less (i.e. when the green line comes close to, or dips beneath, the straight blue line) has worked out alright for investors:
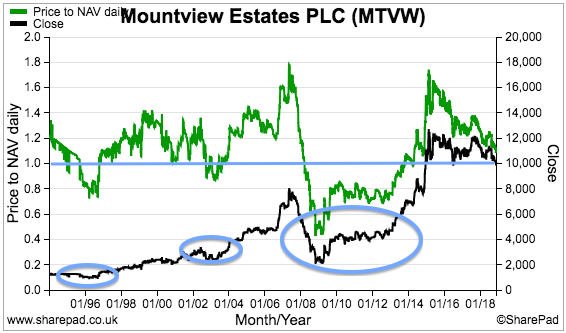
(Following the aforementioned Allsop valuation exercise — and the additional information investors can now apply to MTVW’s NAV — I am not sure whether the share price will again trade well below book value for long periods.)
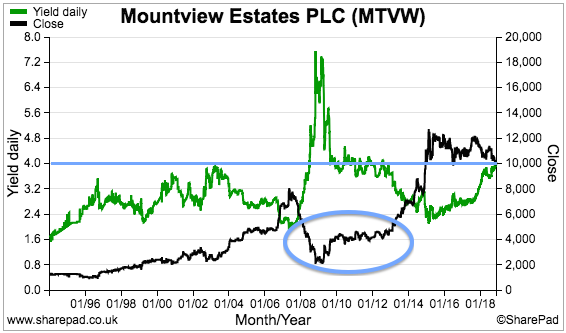
On an income basis, this H1 saw a maintained dividend and the trailing 400p per share payout presently supports a 4% yield.
History also shows buying MTVW on a 4% yield or more (i.e. when the green line reaches, or rises above, the straight blue line) has worked out well for investors:
Anyway, my sums and charts prompted me last month to increase my MTVW holding by 10%. I paid £100 a share including all costs.
Maynard Paton
PS: You can receive my Blog posts through an occasional e-mail newsletter. Click here for details.
Disclosure: Maynard owns shares in Mountview Estates.

Thanks for posting this and also your Daejan article. I find the graph that indicates the 4% yield most persuasive. As an Aussie I’m going to sit on the fence until the Brexit vote next week just in case there is some (More) market turmoil !
Thanks Christian