30 March 2017
By Maynard Paton
Quick update on S & U (SUS).
Event: Preliminary results and presentation for the year to 31 January 2017 published 28 March 2017
Summary: These results from the car-loan specialist were quite respectable, although a 60% increase to bad debts does suggest the favourable under-writing conditions of the last few years may now have turned. Still, the veteran family management does not seem too concerned and, encouragingly, appears more interested in developing the business towards 2028 rather than 2018. That length of investment horizon suits me just fine. I continue to hold.
Price: 2,070p
Shares in issue: 11,963,042
Market capitalisation: £248m
Click here for all my previous SUS posts
Results:

My thoughts:
* Record results for the 17th consecutive year
A trading statement last month had already indicated these annual figures would be very respectable.
The results showed revenue up 34% and operating profit up 26%, with the figures recording the 17th consecutive year of growth for SUS’s Advantage Motor Finance division.
(Following SUS’s disposal of its doorstep lending subsidiary during 2015, the group’s operations are now almost entirely related to Advantage):
| Year to 31 January | 2013* | 2014* | 2015* | 2016* | 2017** |
| Revenue (£k) | 20,801 | 26,147 | 36,102 | 45,182 | 60,521 |
| Operating profit (£k) | 8,925 | 12,655 | 18,922 | 23,643 | 26,871 |
| Other items (£k) | - | - | - | - | - |
| Finance cost (£k) | (845) | (1,186) | (2,207) | (3,243) | (1,668) |
| Pre-tax profit (£k) | 8,080 | 11,469 | 16,715 | 20,400 | 25,203 |
| Earnings (£k) | 6,153 | 8,897 | 13,271 | 16,320 | 20,342 |
| Dividend paid (£k) | (2,100) | (2,600) | (3,500) | (4,700) | (9,548) |
(*Advantage Finance, **Group)
The 2017 performance was driven by Advantage receiving some 750,000 loan applications (up 53% on 2016), and agreeing to 20,000. The year-end number of active customer loans advanced by around a net 10,000 to 43,000.
* Impairments increase by 60% but management does not seem too concerned
With revenue growth outpacing profit growth during the year, clearly SUS’s extra business came at the expense of margin.
The group’s gross margin reduced from 63% to 59% and the following results footnote explained why:

The loan loss provisioning charge (effectively SUS’s bad-debt charge) was raised a substantial 60%, with other cost of sales (covering commissions to car dealers) gaining 43%.
SUS did not appear to be too concerned about the movements:
“The past three years have seen impairment as a proportion of revenue in a historically low range of 16% to 20% against 25% to 37% in the previous three years when Advantage still enjoyed very good profitability.
Since 2015 the record growth and an inevitable increase in competition at the higher quality end of the Advantage product range has seen both a slight upturn in impairment to just over 20% this year and some increase in brokerage costs. These are mainly offset by improved interest rates and so margins continue to be very healthy.”
Here’s how the impairment for 2017 compares to the previous four years:
| Year to 31 January | 2013* | 2014* | 2015* | 2016* | 2017** |
| Loan provision (£k) | 5,291 | 5,087 | 5,863 | 7,611 | 12,194 |
| Revenue (£k) | 20,801 | 26,147 | 36,102 | 45,182 | 60,521 |
| Average net customer receivables (£k) | 47,377 | 62,734 | 89,678 | 125,764 | 169,335 |
| Loan provision/Revenue (%) | 25.4 | 19.5 | 16.2 | 16.8 | 20.1 |
| Loan provision/Average net customer receivables (%) | 11.2 | 8.1 | 6.5 | 6.1 | 7.2 |
(*Advantage Finance, **Group)
I think it is fair to assume 2015 and 2016 were exceptionally favourable years for impairments, and perhaps the next few years won’t be as kind.
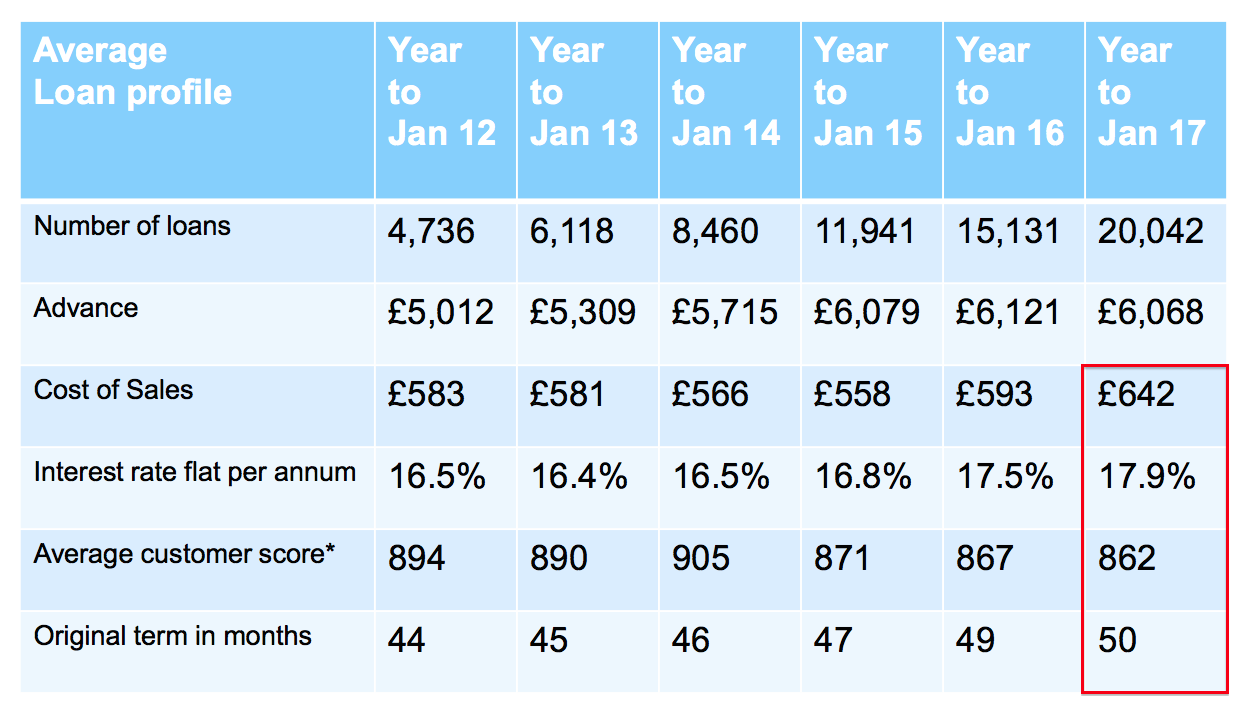
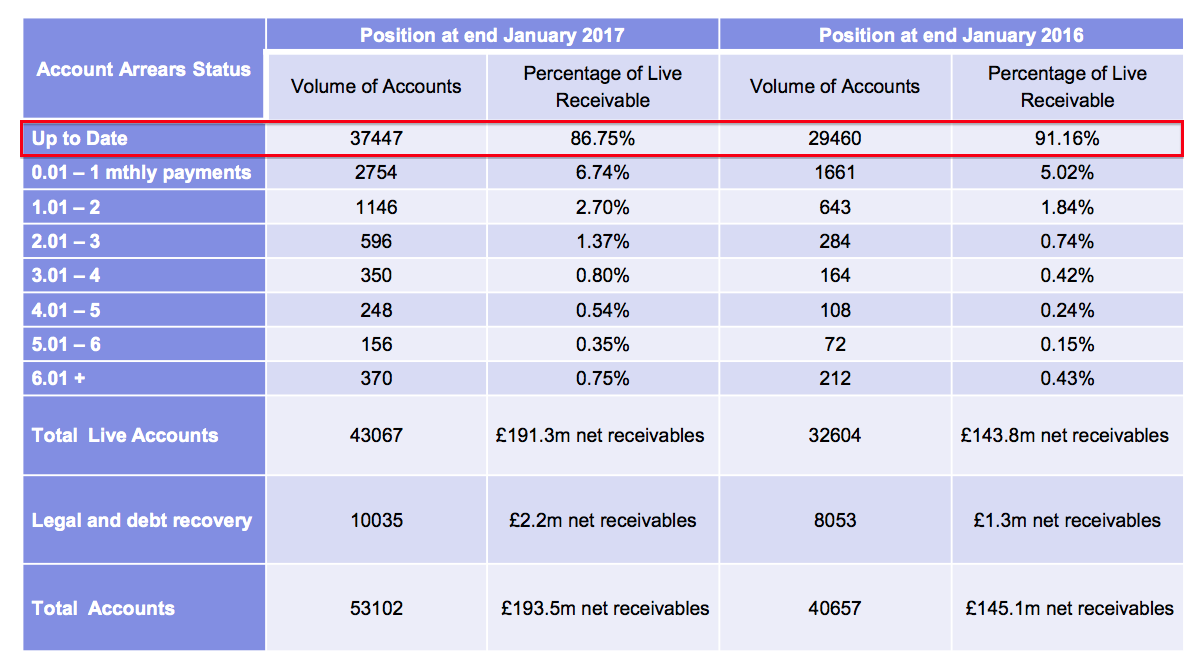
* Two slides that show the favourable lending trend starting to reverse?
SUS’s presentation slides showcased two slides that signalled a slightly reduced quality to the group’s loan book.
This first slide indicates that the cost of acquiring each loan, the rate charged on the loan, as well as the average term of the loan, have all increased slightly. Meanwhile, the credit score of a typical customer was the lowest since at least 2012:
This second slide shows the number of up-to-date accounts decreasing from 91% to 87%:
* Further evidence of greater impairments when comparing H1 vs H2
The first-half/second-half split shows impairments running at a greater rate during H2 than H1:
| H1 2016 | H2 2016 | FY 2016 | H1 2017 | H2 2017 | FY 2017 | ||
| Revenue (£k) | 20,381 | 24,801 | 45,182 | 28,283 | 32,238 | 60,521 | |
| Operating profit (£k) | 9,874 | 11,377 | 21,251 | 12,579 | 14,292 | 26,871 | |
| Loan provision (£k) | 3,205 | 4,406 | 7,611 | 4,959 | 7,235 | 12,194 | |
| Average net customer receivables (£k) | 114,415 | 133,792 | 125,764 | 159,528 | 183,722 | 169.335 | |
| Loan provision/Revenue (%) | 15.7 | 17.8 | 16.8 | 17.5 | 22.4 | 20.1 | |
| Loan provision/Average net customer receivables (%) | 5.6 | 6.6 | 6.1 | 6.2 | 7.9 | 7.2 |
Although the ratios for H2 remain below the levels seen before 2014, the calculations are further evidence of write-offs turning the wrong way.
* The margin has to be high to earn an acceptable return on equity
One upshot of the growing impairments was the operating margin coming in at 44% — versus 47% for 2016 and 46% for 2015.
While the operating margin remains extremely healthy compared to most businesses, SUS requires a high level of profit in order to generate an acceptable return on the equity that’s invested in the business.
I calculate SUS earned a 15% (£20m) return on the average £139m of equity employed throughout the year.
That 15% return was assisted by the use of significant debt — net borrowings increased from £12m to £49m during the period — and adjusting my sums for the loans and associated interest reduces the result to a modest 13%.
This next slide below from the presentation is informative:
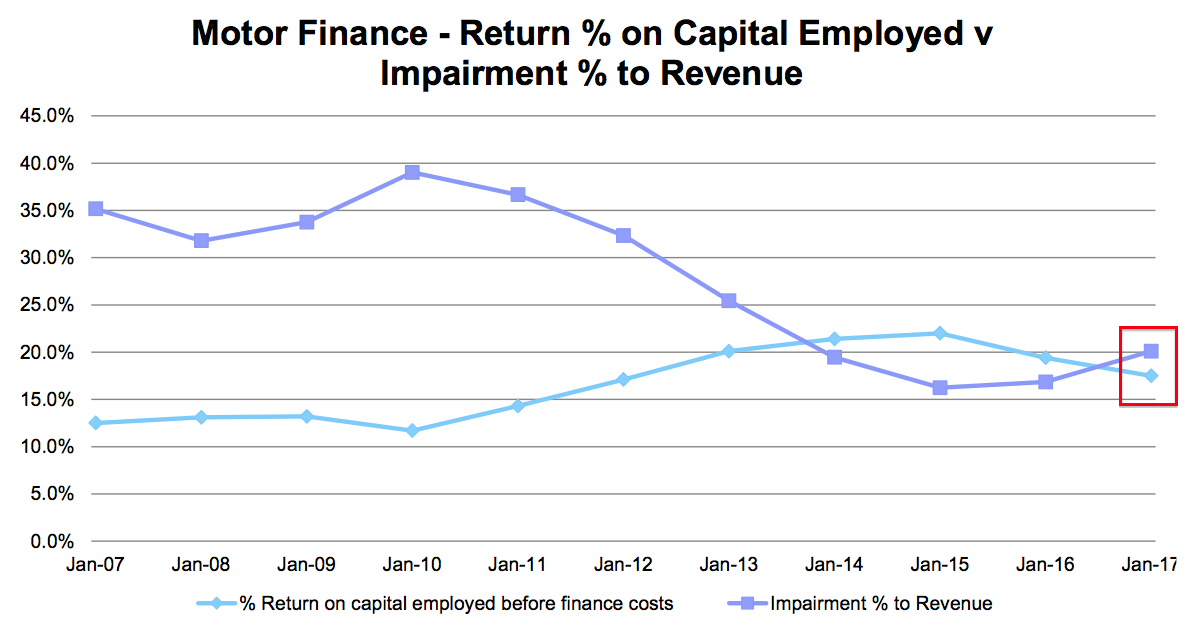
It appears SUS’s return on capital figures relate only to the Advantage division, and show 15%-plus for 2017 versus my guess of 13%.
I presume the difference is due to my use of the overall group numbers, which must include certain central assets that attract extra costs (such as director wages).
* I will need to investigate this cash flow matter further
I wrote in my original Buy report that SUS had been reinvesting significant amounts of cash flow back into the business, and that was definitely the case for 2017:
| Year to 31 January | 2013* | 2014* | 2015* | 2016* | 2017** |
| Operating profit (£k) | 8,925 | 12,655 | 18,922 | 23,643 | 26,871 |
| Working-capital movement (£k) | (5,251) | (6,099) | (8,576) | (15,688) | (48,488) |
(*Advantage Finance, **Group)
Some £48m was absorbed into new customer loans during the year — which is a huge sum when compared to the £27m operating profit.
I must confess, I am not entirely sure what has occurred here.
You see, this slide from the results presentation…
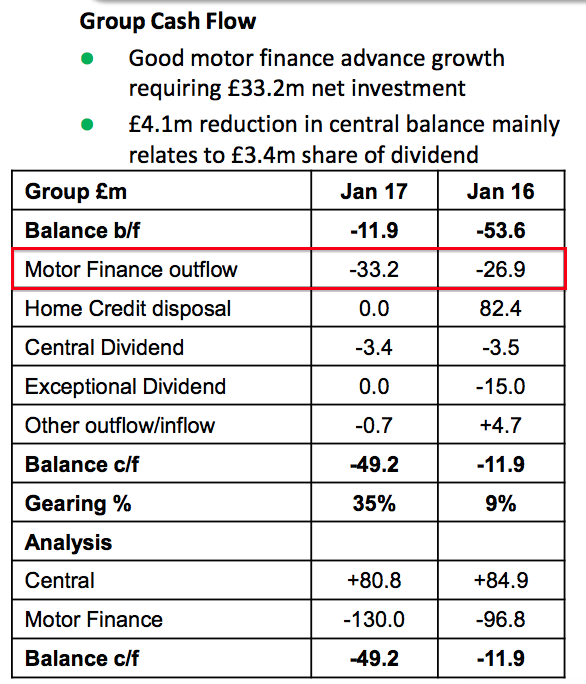
…suggests the net £33m extra funding required for Advantage was only £6m greater than that needed for 2016.
From that perspective at least, the cash movements for 2017 would not appear too worrying.
However, my earlier sums — based on old Advantage annual reports — had indicated 2016 required much less cash than that shown in above presentation slide.
I will have to investigate this matter further. I hope to deduce what has actually happened — and match the figures in the above slide with those in the accounts! — when the annual reports of both SUS and Advantage become available.
At least all the other cash-flow items, such as capital expenditure, remain immaterial.
Valuation
Revisiting my previous sums, I now estimate SUS can produce near-term revenue of £69m from net customer receivables (customer loans) of £194m.
Then applying the 44% margin witnessed during 2017 gives me an operating profit of £31m. Taxed at the forthcoming 19% UK standard rate, I calculate possible operating earnings to be roughly £25m or 208p per share.
Although my margin guess may be a little optimistic given the greater impairments witnessed during H2, my calculations do not assume any further new customers.
Anyway, adding net debt of £49m to the £248m market cap (at 2,070p per share) gives an enterprise value (EV) of £297m, or 2,481p per share.
The possible P/E based on my EV and earnings guess is therefore 2,481p/208p = 12.
That rating seems quite reasonable to me given Advantage’s recent growth rate.
For what it is worth, SUS continues to be optimistic and reckons it enjoys “the ideal platform to continue its record growth and profitability focussing on its proven fields in specialist finance.”
The group added:
“Both Advantage and (fledgling bridging-loan division) Aspen operate in growing markets. These in turn exist within a robust British economy, where the labour market is strong and where the current focus on increasing productivity and reducing regulation should underpin economic growth.”
I particularly like how SUS’s family management is looking well beyond 2018 earnings (my bold)
“The road to sustained success is not made up of a giant leap but of a thousand small steps, and this kind of approach will continue to sustain and dynamise our business over the next decade.”
I suppose fussing over the latest impairment levels could be seen as inconsequential when the bosses have an investment horizon that stretches to 2028.
Meanwhile, the 91p per share dividend pays a 4.4% income.
Maynard Paton
Disclosure: Maynard owns shares in S & U.

S & U (SUS)
Publication of 2017 annual report:
A few points of interest:
1) Additional snippets on the used-car market
It appears the used-car market has performed well of late. The estimated number of used cars sold during 2016 increased by 7.2% to 8.2 million and 1.2 million (versus 1.1 million for 2015) were bought using finance. The cost of those 1.2 million purchases was £12bn (versus £11bn for 2015):
2) Executive Brexiteers?
This text suggests the board is not too worried about Brexit and ‘experts’:
3) Director pay
3 of the 4 executives had their wages held during 2017:
JG Thompson, who is the managing director of Advantage Finance, saw his annual pay gain 14% to become the highest paid director — a fair reflection of his status in the group in my view.
That said, having 3 directors on £300k-plus does look a tad excessive for this size of business. At least bonuses for the Coombs brothers and the finance director appear modest, and this trio do not have much in the way of options either.
However, there will be pay rises all round for 2018:
Plus JG Thompson could be in line to collect a £300k bonus in the current year (the previous maximum was £150k):
At least the bonus targets are “stretching“.
4) Impairment charge and write-offs
Note 15 is interesting. It compares the loan-loss provision charge (essentially bad debts) within the income statement to the amounts actually written off (as well as against an adjustment for the discount rate applied to estimated future loan losses):
The difference between the loan-loss provision charge (£12,194k) and the combination of the write-off (£3,012k) and the discount unwind (£2,707k) is £6,475k — by far the largest figure since Advantage Finance started disclosing these numbers in 2007.
Write-offs for 2017 at £3,012k compares to about £2,000k recorded annually between 2012 and 2016, and yet the loss-loan charge for 2017 is up to £12,194k from £7,611k for 2016 and between £5,000k and £6,000k for 2010 to 2015.
I could be wrong, but I get the impression there is some conservative reserving going on here — and I trust the increase to the loan-loss charge is not going to herald huge future write-offs.
At present the full loan-loss reserve stands at a sizeable £30,754k, which essentially reflects the cumulative amount already charged against past earnings for bad debts that have yet to occur.
5) Motor Finance cash flow
I wrote in the Blog post above how I could not reconcile SUS’s cash-flow presentation slides to its accounts and that I would have to investigate this matter further.
Here is the slide in question:
The (£33.2m) and (£26.9m) entries are based on the figures within this table from the same presentation:
The (£33.2m) is the difference between (£96.8m) and (£130.0m) while the (£26.9m) is the difference between (£96.8m) and (£69.9m).
The balance b/f and balance c/f entries on the previous slide are calculated as Advantage’s cash less debt less long-term trade and other payables (which are loans lent to the subsidiary by the parent company). Effectively the balance b/f and balance c/f entries are equivalent to net debt.
Here is the balance sheet of Advantage Finance for 2016:
So the (£69.9m) entry is derived from £651k less £0k less £70,500k, while the (£96.8m) entry is derived from £0k less £2,807k less £94,000k. (The (£130.0m) entry on the presentation slide can only be double-checked after the 2017 Advantage Finance report is published.)
So at least from this perspective, the presentation slides appear to match the end net-debt result of the Advantages accounts.
Sadly many of the other entires on the presentation slide can’t be reconciled to the accounts — monthly, settlement and debt-recovery collections for instance include repayments of loan principles as well as interest, while SUS’s accounts include only interest as revenue.
All told, I do not think (at least at this stage) that the £48m working-capital movement within the 2017 accounts is ominous.
The presentation slides indicate Advantage Finance absorbed £33.2m of cash for 2017 versus £26.9m for 2016, which corresponds to the subsidiary’s accounts, and seems reasonable enough given the extra loans advanced during recent years.
Nonetheless, I will still have to double-check Advantage Finance’s 2017 annual report when it is published at Companies House (possibly in May). The £48m working-capital movement shown in SUS’s full accounts may be due to goings-on elsewhere in the group.
Maynard
S & U (SUS)
Advantage Finance 2017 annual report:
In the Comment above I wrote:
“Nonetheless, I will still have to double-check Advantage Finance’s 2017 annual report when it is published at Companies House (possibly in May). The £48m working-capital movement shown in SUS’s full accounts may be due to goings-on elsewhere in the group.”
Advantage’s 2017 annual report has now been published:
https://beta.companieshouse.gov.uk/company/03773673/filing-history
To cut a long story short, I was confused as to why this presentation slide from the 2017 annual results:
…showed a Motor Finance cash outflow of £33.2m when the group’s overall working-capital movement showed a £48m outflow.
I have looked at Advantage’s accounts and realised the £33.2m outflow was reported after the effect of short-term loans provided by the parent company. So really, that presentation slide is a little misleading — or at least the Motor Finance entry can be fudged somewhat by movements elsewhere in the group.
Now that SUS owns only Advantage (after the doorstep-lending division was sold), it makes sense just to focus on the group numbers from here.
Anyway, the fact remains that SUS will reinvest substantial amounts of cash into working capital (new customer loans) to expand the business — and take on debt to help fund that expansion. Free cash flow is likely to be negative. As such, everything boils down to what sort of return will be earned from all that cash reinvestment.
Maynard
S & U (SUS)
Trading statement:
Not a bad update — customer numbers and their loans have risen 30% since this time last year. However, the impairment provision has risen further, to 21%. Here is the full text:
——————–
“S&U, the motor finance and specialist lender, issues a trading update for the period from its full year results on 1st February 2017 up to 17th May 2017, prior to its AGM being held today.
Business at Advantage Finance our motor finance subsidiary remains excellent. Applications in the first quarter were a record, new loan transaction numbers are a fifth higher than for the same period last year and average new loan quality is ahead of Q1 last year.
Net receivables now stand at £210m, up 30% on last year, and customer numbers have now passed 46,000, another record for Advantage. Although rolling 12 months impairment to revenue has slightly increased to 21.0% (31 January 17: 20.1%), reflecting product mix, Advantage’s overall debt quality is good and monthly collections now exceed £9m per month.
Aspen Bridging, our new bridging finance pilot operation, has started trading and is expanding its broker network and refining its product offering.
Further investment in our receivables has seen Group borrowings increase to £65m against £49m at year end. Current facilities give us significant headroom for continued growth.
S&U have also announced the appointment of Peel Hunt LLP as their new brokers.
Commenting on S&U’s trading and outlook, Anthony Coombs, S&U Chairman, said:
“Advantage Finance continues to prosper in a resilient economic climate, and a stable regulatory environment. Our confidence in the Group’s steady and sustainable growth remains as strong as ever.”
——————–
Customer numbers of 46,000 and net receivables of £210m compare to 35,600 and £160m this time last year, so growth of about 30%.
However, the annualised impairment rate has advanced from 20% to 21% from January 2017 to May 2017, which doesn’t seem like much, but the rate at December 17 was 18.5%.
So the last six months have witnessed a notable impairment increase, and confirms the view from the Blog post above that the favourable under-writing conditions of the last few years may now have ended.
That said, I did note that the 2017 annual report indicated the actual write-offs during 2017 were well below the impairment charge (Point 4). So the rising impairment charge may in time prove to be overly cautious.
Revisiting my valuation sums, I now estimate SUS can produce near-term revenue of £75m from net customer receivables (customer loans) of £210m.
Then applying a 21% impairment provision, and charging 21.3% for other cost of sales (as per 2017) and 14.2% for admin costs (as per 2017), I arrive at an operating profit of £32.6m. Taxed at the 19% UK standard rate, I calculate possible operating earnings to be roughly £26.4m or 221p per share.
Adding the latest debt figure of £65m to the £239m market cap (at £20 a share) gives an enterprise value (EV) of £304m, or 2,543p per share.
The possible P/E based on my EV and earnings guess is therefore 2,543p/221p = 11.5.
Maynard
I am strictly a momentum trader but sometimes i read full review like what you did – which i believe is excellent in details and fundamental review. However the stock is now trading at a 3 year low! can it go lower? i think it will looking at several time frames. In addition, this is probably the top of the market in terms of car purchases (similar to the US market) and we may face some interesting times when new electric cars are coming (35 new models of electric can by December) and the residual value of those old clunkers goes down to whatever!
Hello Patrick
I must confess I do not know when electric cars will have a notable impact on the wider car market. SUS does have a dependence on used-car-values, as the loans are secured on the vehicles, and so the group may face issues if the clunkers suddenly lose their value. I can only trust the veteran management can spot any adverse trend before me and adapt their lending as appropriate.
Maynard
S & U
Trading Update
Here is the full statement:
——————————————————————————————————————————-
S&U plc, the hire purchase motor finance and specialist lender, today issues a trading update for the period from its AGM statement of the 18 May to 31 July 2017. It will announce half year results on 26 September 2017.
Trading
Trading at Advantage, our motor finance subsidiary, continues at record levels. New loan transactions are up by 20% and monthly collections are 27% higher than a year ago. Monthly collections hit a record £10m from nearly 49,000 customers in July and debt quality continues to be good.
Despite recent speculation as to the strength of the economy and its possible effect on the car finance market, Advantage has seen a steady increase in the number of quality applications it receives. Advantage is not involved in the PCP market which has recently come under public scrutiny. Advantage’s average loan size is just £6,200 so should changes in the PCP market have a knock-on effect upon car residual values generally, this would have only a marginal effect upon S&U’s business.
Aspen Bridging is proceeding cautiously and gradually establishing itself in the bridging market, and gaining traction in attracting good quality deals.
Funding
Committed medium term funding facilities have been increased to £95m since the end of the last financial year. This gives sufficient headroom for our anticipated growth and will be reviewed again as our businesses develop.
Commenting on the Group’s trading and outlook, Anthony Coombs, S&U chairman said:
“S&U’s performance and prospects remain healthy despite the current sentiment regarding the British consumer and motor finance sector. Our robust and well established under-writing processes, and impeccable 17 year track record at Advantage position us to trade well through any foreseeable macro-economic weakness, whilst allowing us to take advantage of the clear opportunities for steady and sustainable growth which we see at present.”
——————————————————————————————————————————-
This update appeared quite reassuring. The PCP issue has been doing the rounds of late, so it was useful that management referred to the worries. Debt quality “continues to be good” is encouraging — I take this to mean the debt provision of 21% reported within the previous update has not increased further.
There’s not really enough new information from this statement to adjust my earlier valuations sums, so going on my previous figures, I reckon a £19.50 share price gives an underlying P/E of 11.3.
Maynard
Thanks for your note. I closed my short position (3000 shares) gradually last week – but it is a low volume stock so it is not a very good trading stock. but good profit! close to 20% in 5 months – it is quite amazing that several brokers and small funds went to the rescue of the stock as well as statements from the aging management team of the company as the stock started taking a nose dive! – quite funny. This was a small experiment for me in the UK market _ i traded mostly automotive / trucks / AI stocks in the US _ so no complains but will keep watching as i do not believe this will go much higher…..